Seminar Liga Ilmu Serantau 2015 (LIS 2015)
Measuring the Performance of District Local Government of
Batam City Using the Balanced Scorecard
Dwi Kartikasari1
1Department of Business and Management, Politeknik Negeri Batam [email protected]
Saronto2
2Department of Applied Business Administration, Politeknik Negeri Batam [email protected]
ABSTRACT. The Balanced Scorecard (BSC) is a management system that has been applied by many organizations across the globe but has not been really implemented by governments. In the mean time, Indonesian government, especially local one like city of Batam, is demanded to operate as effectively and efficiently as possible. Therefore, the BSC has been becoming more relevant nowadays. Although the literature of the BSC implementation in the public sector in many developed countries is abundant, it is not well supplied in Indonesia due to its newly adaptation. This study aims to describe the implementation of the BSC to measure the the performance of local government. The object of this study is Batam city government, Bengkong district. A survey to 100 customers/residents was conducted to score their satisfaction towards customers and stakeholders as well as internal business process perspectives. Whilst in-depth interview was conducted to 67 civil servants working in the district government to score the financial perspective as well as learning and growth perspective based on 2012 to 2014 data collected. Although the customers are satisfied with the performance of Bengkong district’ services, the score of financial as well as learning and growth perspectives are low leading to a total of 0.8 of the BSC score. Thus the authors consider the performance of the district local government is fair. The authors hope the local government use the results of this study as feedback to continously improve its performance, especially the performance of perspectives that underperform.
KEYWORDS: The Balanced Scorecard; Performance; Measurement; Batam City Government
1 INTRODUCTION
Indonesian bureaucracy is notorious for its ineffective and inefficient public services, corruption and static working culture (Budiati, 2005). However, the government is making efforts for creating good governance. The earliest effort that endorsed the Balanced Scorecard (BSC) was in 2007 by the Finance Minister under the Centre of the Bureaucracy Reform Team. With the BSC as a tool to design and evaluate key performance indicators based on the balanced perspectives to improve performance, the bureaucracy reform in the Ministry of Finance has been promising (Budiarso, 2014).
autonomous authority to local government to regulate and manage the interests of local people. Because the citizens, particularly those in Batam, basically demand the government to improve the efficiency and effectiveness of its programs, the local government, has been
searching for strategies to meet the constituents’s need. The decentralized systems has given Batam city government more authority to implement the BSC.
Until now, performance measurement in government organizations is based on the Performance Agreement Document. The result of performance measurement is presented in Government Performance Accountability Report (LAKIP). LAKIP covers a comprehensive performance measurement, not only financial aspects but also non-financial aspects. However, Surawijaya and Wibisono (2013) notes that sometimes LAKIP rings a false alarm as is the case of the Ministry of Energy and Mineral Resources where it was always awarded as one of the government institutions with the best LAKIP Report but the public and other stakeholders do not feel the improvement in the management of energy and mineral resources. At last, the two authors last mentioned recommend the BSC as the framework of performance measurement system (PMS).
The BSC based PMS is considered appropriate to be implemented by local government because it measures the organization’s performance through four perspectives which are the financial perspective, customer perspective, internal business process perspective, and learning and growth perspective. With the BSC’s perspectives, the local government should take into account the customer perspective (or the public) and growth perspective the way it does to financial perspective. Not surprisingly, with its comprehensive perspectives, the BSC has been applied by many organizations across the globe although it has not been widely implemented by governments. In Indonesia, the number of government agencies implementing the BSC has been increasing each year.
Although the literature of the BSC implementation in the public sector in many developed countries is abundant, it is not well supplied in Indonesia due to its newly adaptation. Thus, this paper aims to enrich the literature in the area of the BSC implementation of local government performance measurement. The authors hope the local government use the results of this study as feedbacks to continously improve its performance.
2 LITERATURE REVIEW
Bengkong District, Batam City
District of Bengkong was formed on June 1, 2006 according to Batam City Regulation No. 2 of 2005 on Redistricting, Changes and Formation of sub-district or village in Batam. There are 12 districts in Batam, and out of 1.153.860 residents in Batam City per April 2012, 68.873 residents live in Bengkong district.
The Balanced Score Card (BSC)
According to Kaplan and Norton (1996), the BSC is coherent set of measures to
translate a company’s vision. The four perspectives of the BSC offer a balance between
Figure 1: Public Sector Strategy Map
3 METHODOLOGY
To elaborate customer and stakeholder as well as internal business process perspective, the authors obtained primary data from questionnaires. The survey was conducted at different times of day and a couple of times per week from January to April 2015. The authors use Slovin’s (sometimes Sloven’s) formula (see Tejada and Punzalan, 2012) with the margin of error of 10 percent as follows:
n = N / (N.e² + 1) (1)
99.85 = 68,873/(68,873x10%x10%+1)
where n is the sample size, N is the population size and e is the margin of error.
So, sample size is 99.85 rounded up to 100 people. Using accidental sampling technique, we collected 100 respondents out of 4 sub districts in Bengkong, Batam. Using five level Likert (1932), the questionnaire mainly covered the following variables:
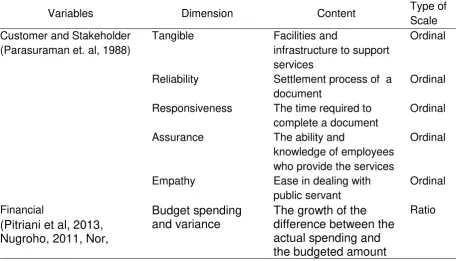
Table 1: Operationalization of Variables (Rohm 2004, Imelda (2004)
Variables Dimension Content Type of Scale Customer and Stakeholder
(Parasuraman et. al, 1988)
Tangible Facilities and
infrastructure to support services
Ordinal
Reliability Settlement process of a document
Ordinal
Responsiveness The time required to complete a document
Ordinal
Assurance The ability and
knowledge of employees who provide the services
Ordinal
Empathy Ease in dealing with public servant
Ordinal
Financial
(Pitriani et al, 2013,
Budget spending
and variance
The growth of the
difference between the
2011, Jiang and Liu 2014)
Budget growth The increase in budget approved over timeRatio
Internal Business Process Waiting time
(Nugroho, 2011; Jiang validity of the questionnaire with the significant level of 5 percent. Because the value of rxy >
rtable product moment for all questions tested, then the authors declare that the instrument is valid to
reveal the data of the variables studied. Next, to test the reliability of the questionnaire, we use Method Alpha using SPSS. Because the value of Cronbach’s Alpha obtained for customer and stakeholder perspective is 0.963 and that for internal business process perspective is 0.716 which both are more than 0.9, we conclude that our instrument has a high degree of reliability.
On the other’s hand, to detail financial as well as learning and growth (a.k.a employee and organization capacity) perspective, the authors collect data from in-depth interviews to 67 civil servants who work at Bengkong district and observations to the management and operational activities in Batam City Government District Bengkong. In addition, the authors study some documents related such as budget reports from 2012 – 2014.
After analyzing each variable, the authors give scores to each variable in order to be able to compare the performance of the balanced perspectives (Mulyadi, 2001), under the following rule:
Table 2: the BSC-based Scoring System
Variables
Scoring system
-1 = when not at all to slightly satisfied
0 = moderately satisfied
1 = very and extremely satisfied
4 RESULTS AND DISCUSSIONS
4.1 Characteristics of the respondents
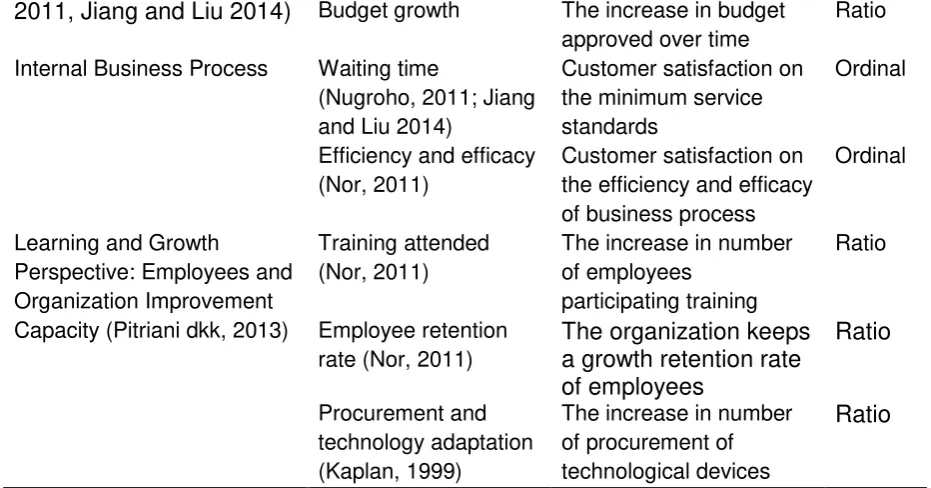
The data presented at table 3 below are based on respondents’ answers to survey
questions. Most respondents are male, who respresent their families for administering family card. Generally, the residents taking the survey age 17 – 22 years with senior high school certificate who come from proportionally diverse part of sub districts. The authors believe that the distribution of respondents reflects in some extent the actual demographic data in terms of education level and sub district.
Table 3: Characteristics of the respondents
Characteristics
Options
Percentage (%)
Gender
Male
Education level
Senior high school
Junior high school
Documents Needed ID Card/Family Card
ID-home base change/move
Job Seekers card / AK1
Letter of acknowledgement
Introduction to SKCK
Certificate of Business Domicile etc
72
Sub districts
Tanjung Buntung
Bengkong Indah
4.2 The District Government Performance
a. Customer and stakeholder perspective
b. Financial Perspective
In the financial perspective, there are two parameters used for assessment, namely, budget spending and budget growth.
Table 4: Parameters of financial perspective
Year Budget Actual 2012 Rp2,229,877,000.00 Rp2,196,567,302.00 99 1 105
2013 Rp3,124,790,400.00 Rp2,988,998,909.00 96 4 40
2014 Rp4,096,756,199.76 Rp3,976,963,454.00 97 3 31 Source: LAKIP Disctrict Bengkong 2012 – 2013
The above table shows that the percentage of budget spending from 2012 to 2014 fluctuated, namely in 2012 budget spending was 99 percent, in 2013 down to 96 percent, and in 2014 rose to 97 percent. In the local government perspective, the higher budget spending, the less the budget variance, the better. In fact, LAKIP as Indonesian government performance measurement was mainly based on this rule. The perspective of government contradicts that of private companies which focuses on budget efficiency and the least budget spending. However, Indonesian government has been encouraging more on outcomes and outputs. In other words, the more budget spending should be accompanied with more outcomes.
In the mean time, budget growth decreased during the study period. Based on the above table, it can be seen that there was a decline in budget growth from 105 percent in 2012 to 40 percent in 2013 and finally to 31 percent in 2014. Thus, the authors give score of 0 for budget spending because its volatility and score of -1 (minus 1) for budget growth due to its decline.
c. Internal Business Process Perspective
The survey results in the index of consumer satisfaction on internal business process by 73.80 percent which is within the interval of 60 to 80 percent. The score means that the customers and stakeholders are very satisfied with the Bengkong district’s business process. The authors give score of 1 for the satisfaction of customer and stakeholders for the efficiency of business process of Bengkong District.
d. Learning and growth perspective
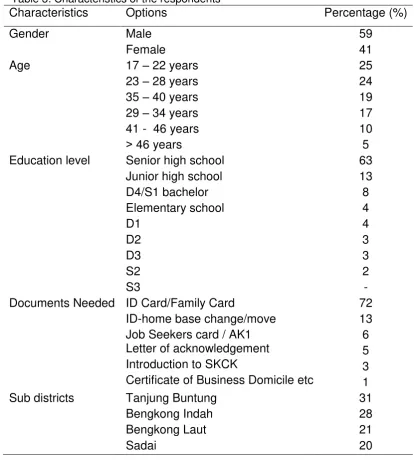
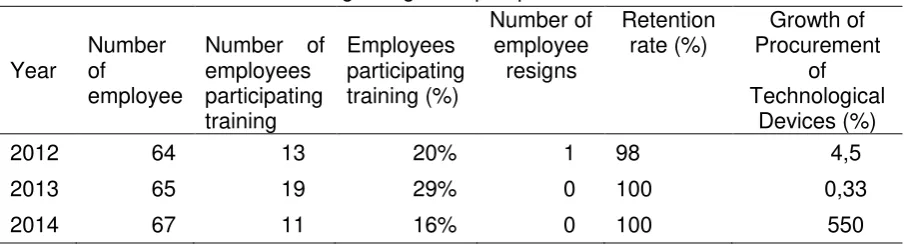
Indicators in this perspective are three, namely the ratio of employee training, employee retention rate, and the growth of the procurement and technology utilization. The three measurement of the ratio is as follows:
Table 5: Parameters of learning and growth perspective
Year
from 20 percent in 2012 to 29 percent in 2013, then fell to 16 percent in 2014. Whilst the number of civil servants attending training fluctuated, the number of those resign was very low to zero, thus tend to decrease each year. In 2012 the number of employees who resign at 0.02 percent, in 2013 0 percent, and in 2014 amounted 0 percent. Last, the ratio of the procurement of technological devices fluctuated during the study period, decline from 4.5 percent in 2012 to 0.33 percent in 2013 and rose to 550 percent in 2014. Thus, the authors give score of 0 for the number of employee participating training, score of 1 for employee retention because of its very high and increasing retention rate, and score of 0 for its uncertainties in procuring tecgnological devices.
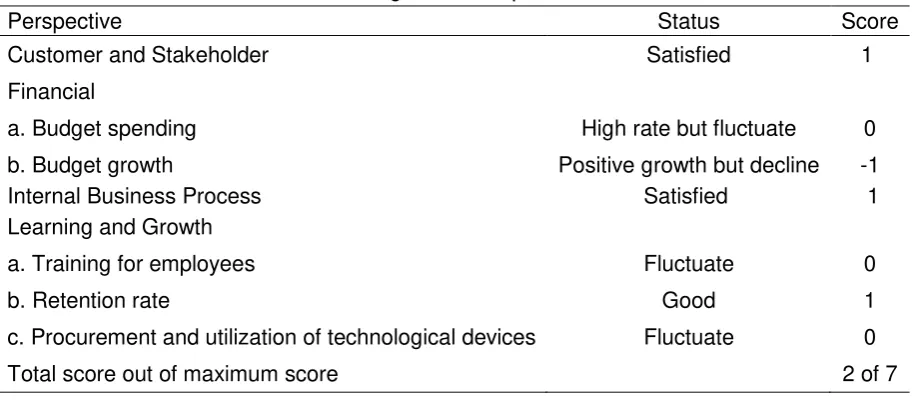
By totaling all the scores given, we summarize as follows:
Table 6: Total score of the district government performance
Perspective Status Score
Customer and Stakeholder Satisfied 1
Financial
a. Budget spending High rate but fluctuate 0
b. Budget growth Positive growth but decline -1 Internal Business Process Satisfied 1
Learning and Growth
a. Training for employees Fluctuate 0
b. Retention rate Good 1
c. Procurement and utilization of technological devices Fluctuate 0
Total score out of maximum score 2 of 7
Table 6 above shows that the total score of Bengkong district government is 2 of 7 or 0.28 on -1 to 1 scale or 57.14 percent. Thus, the authors argue that the performance of the district government is considered normal. When compared with previous studies, the results of this study are consistent with research of Pitriani, et.al (2013) who got close value of the BSC-based performance. By concluding to 0.5 point, she stated that the performance of Riau Islands provincial tourism office is considered normal as well. Another researches that are conducted by Effendi (2012), Fathoni and Inda Kesuma (2011), Muhammad (2011), and Shu-Hsin Huang et. al. (2004) concluded by an excellent outperformance of the government under scrutiny. With a more balanced perspective, the authors hope that Bengkong district of Batam city government can consider the BSC-based performance measurement as the basis and guidelines for the mission of continous improvement of performance of the district government in the future.
5 CONCLUSIONS
The authors conducted a survey to 100 customers/residents conducted to score their satisfaction towards customers and stakeholders as well as internal business process perspectives of Bengkong district of Batam city government. The survey was conducted at different times of day and a couple of times per week from January to April 2015. On the
other’s hand, to detail financial as well as learning and growth (a.k.a employee and
to a total of 0.28 of the BSC score. Thus the authors consider the performance of the district local government is fair. The authors hope the local government use the results of this study as feedback to continously improve its performance, especially the performance of perspectives that underperform.
The authors understand that this study limits its application to one district out of 12 districts in addition to its technique of non-probability sampling which lead to its limitation with regard to generalization. The authors recognize that because the respondents do not truly represent a population, we cannot make valid inferences about the larger group from Batam city or even larger Indonesia citizens. In order to increase validity, the authors suggest to switch current sampling technique to random sampling and avoid bias into sample selection.
6 ACKNOWLEDGEMENTS
The authors feel grateful for the contributions of all civil servants at Bengkong District Batam City government.
7 REFERENCE
Budiarso, A. (2014). Improving government performance in indonesia: the experience of the balanced scorecard in the ministry of finance. A doctorate thesis of The University of Canberra. Retrieved from http://www.canberra.edu.au/researchrepository/file/1a2c8cf2-bdca-47bd-86d5-674f3a216b70/1/full_text.pdf
Budiati, A. (2005). The role of bureaucratic reform and e-government in eradicating corruption and improving public service delivery in indonesia (a strategic action to create harmonious society in indonesia. Network of Asia-Pacific Schools and Institutes of Public Administration and Governance (NAPSIPAG) Annual Conference, Beijing, 5-7 December 2005. Retrieved from http://napsipag.org/pdf/Eradicating_Corruption.pdf
Effendi, R. (2012). Pengukuran Kinerja Sektor Publik dengan Menggunakan Balanced Scorecard: Studi Kasus Kanwil DJP Sumsel dan Kep. Babel, Jurnal Ilmiah STIE MDP,
1 (2), p.67-73. Retrieved from:
http://eprints.mdp.ac.id/669/1/1.%20Pengukuran%20Kinerja%20Sektor%20Publik%20 Dengan%20Menggunakan%20Balanced%20Scorecard%20(Studi%20Kasus%20Kanw il%20DJP%20Sumsel%20dan%20Kep.%20Babel)l%20.pdf
Fathoni, Inda, K.S. (2011). Analisis Penilaian Kerja Rumah Sakit dengan Penerapan Balanced Scorecard : Studi kasus Rumah “ABC”, Jurnal Sistem Informasi (JSI), 3 (1), p. 327-335. Retrieved from: http://ejournal.unsri.ac.id/index.php/jsi/index
Huang S.S. et.al. (2004). Using a Balanced Scorecard to Improve the performance of an Emergency Department, Scholarly Journals of Nursing Economics, 22 (3). p.140-146.
Imelda, R. H. N. (2004). Implementasi balanced scorecard pada organisasi publik. Jurnal Akuntansi & Keuangan. 6(2), p.106-122. Retrieved from: jurnalakuntansi.petra.ac.id/index.php/
Jiang, D.K, Liu, Z.K. (2014). Research on Application of Balanced Scorecard in the Government Performance Appraisal. Open Journal of Social Sciences, 2, p.91-96 Retrieved from: http://www.scirp.org/journal/jss
http://dx.doi.org/10.4236/jss.2014.29016.
Kaplan, R.S. (1999). The Balanced Scorecard for Public Sector Organizations, Balanced Scorecard Report, Harvard Business School Publishing and Balanced Scorecard Collaborative, 1(2). Retrieved from:
http://mjfgroup.biz/Templates/BalancedScorecard/Articles/BSR_The%20BSC%20for% 20Public%20Sector_v1n2.pdf
Likert, R. (1932). A Technique for the Measurement of Attitudes. Archives of Psychology, 140. p.1–55.
Muhammad, S. M. (2011). Analisis Balanced Scorecard (BSC) untuk Evaluasi Kinerja Pada PT PLN (Persero) Makassar, Skripsi, Fakultas Ekonomi Jurusan Manajemen Universitas Hasanuddin Makassar. Retrieved from: http://repository.unhas.ac.id/bitstream/handle/123456789/413/Laporan%20Skripsi.pdf
Mulyadi. (2001). Balanced Scorecard: Alat Manajemen Kontemporer untuk Pelipatganda
Kinerja Keuangan Perusahaan, Salemba Empat, Jakarta.
Nor, W., (2012). Penerapan Balanced Scorecard pada Pemerintah Daerah, AUDI Jurnal Akuntansi & Bisnis, 7 (2), p. 280-292. Retrieved from: http://download.portalgaruda.org/article.php?article=162665&val=945&title=PENERAP AN%20BALANCED%20SCORECARD%20PADA%20PEMERINTAH%20DAERAH
Nugroho, B., (2011). Perencanaan Strategis Berbasis Kerangka Kerja Balanced Scorecard (BSC) pada Lembaga Pemerintahan Non Departemen (LPND), Studi Kasus: Lembaga Ilmu Pengetahuan Indonesia (LIPI). Pusat Dokumentasi Dan Informasi Ilmiah Lembaga Ilmu Pengetahuan Indonesia. Retrieved from: http://www.pdii.lipi.go.id/wp-content/uploads/2011/08/budinugroho-analisis-BSC1.pdf
Parasuraman, A., Zeithame, Valerie A., Berry, Leonard L. (1988). Servqual: Multiple – Item Scale for Measuring Consumer Perception of Service Quality, Journal of Retailing, 64(1) p. 13-40. Retrieved from http://areas.kenan- flagler.unc.edu/Marketing/FacultyStaff/zeithaml/Selected%20Publications/SERVQUAL-
%20A%20Multiple-Item%20Scale%20for%20Measuring%20Consumer%20Perceptions%20of%20Service %20Quality.pdf
Pitriani, A., Uzaimi, A., and Suryadi. (2013). Analisis Kinerja Melalui Balanced Scorecard : Studi pada Dinas Pariwisata Provinsi Kepulauan Riau, Fakultas Ekonomi Universitas Maritim Raja Ali Haji, Tanjungpinang.
Rohm, H. (2004), “Improve Public Sector results With A Balanced Scorecard: Nine Steps To
Succcess”, http:\\www.balancedscorecard.org.
Sugiyono. (2008). Metode Penelitian Bisnis, Alfabeta, Bandung.
Surawijaya, A., Dermawan, W. (2013). Analysis and proposed of performance measurement system framework at ministry of ESDM. The Indonesian Journal of Business Administration. 2 (1), p.29-38. Retrieved from http://download.portalgaruda.org/article.php?article=88698&val=2219
Tejada, J.J., Punzalan, J.R.B. (2012) On the Misuse of Slovin’s Formula. The Philippine
Statistician, 61(1) p. 129-136. Retrieved from: