ELECTRICITY
Generation Mix Has
Shifted, and Growth in
Consumption Has
Slowed, Affecting
System Operations
and Prices
Highlights of GAO-15-524, a report to congressional requesters
Why GAO Did This Study
Electricity in the United States has traditionally been generated largely from coal, natural gas, nuclear, and hydropower energy sources. More recently, various federal and state policies, tax incentives, and research and development efforts have
supported the use of renewable energy sources such as wind, solar, and geothermal. In addition, consumption of electricity has been affected by federal efforts to improve energy efficiency, changes in the economy, and other factors.
GAO was asked to provide information on changes in the electricity industry. This report examines what is known about (1) how electricity generation and consumption have changed since 2001 and (2) the implications of these changes on efforts to maintain reliability, and on electricity prices. GAO analyzed data on electricity generation, consumption, and prices and reviewed literature. GAO also interviewed 21 stakeholders, including government officials, and industry representatives, selected to represent different perspectives and experiences regarding changes in the industry. GAO is not making recommendations in this report. The Department of Energy and Federal Energy Regulatory Commission reviewed a draft of this report and provided technical comments that GAO incorporated as appropriate.
What GAO Found
The mix of energy sources for electricity generation has changed, and the growth in electricity consumption has slowed. As shown in the figure below, from 2001 through 2013, natural gas, wind, and solar became larger portions of the nation’s electricity generation, and the share of coal has declined. These changes have varied by region. For example, the majority of wind and solar electricity
generation is concentrated in a few states—in 2013, California and Arizona accounted for over half of electricity generated at solar power plants. Regarding consumption, national retail sales of electricity grew by over 1 percent per year from 2001 through 2007 and remained largely flat from that time through 2014.
Percentage of Electricity Generation by Source, 2001 and 2013
Note: Other includes biomass, geothermal, oil, and other nonrenewable sources. Numbers may not sum to 100 because of rounding.
The literature GAO reviewed and stakeholders GAO interviewed identified the following implications of these changes:
• Maintaining Reliability: System operators, such as utility companies, have taken additional actions to reliably provide electricity to consumers. For example, some regions have experienced challenges in maintaining the delivery of natural gas supplies to power plants. In particular, severe cold weather in the central and eastern U.S. in 2014 led to higher than normal demand for gas for home heating and to generate electricity. Challenges delivering fuel to natural-gas-fueled power plants resulted in outages at some plants. System operators took various steps to limit the effect of this event, including relying on power plants that utilize other fuel sources that were more readily available at the time, such as coal and oil-fueled power plants, and implementing certain emergency procedures.
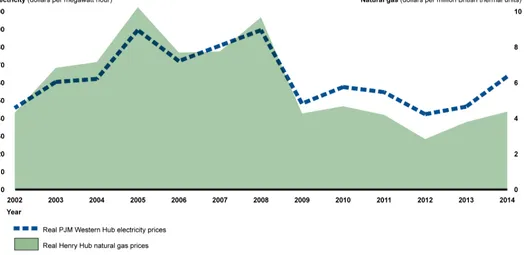
• Prices: Increased gas-fueled generation has influenced electricity prices, with wholesale electricity prices and gas prices generally fluctuating in tandem over the past decade. The effect of the increased use of wind and solar sources on consumer electricity prices depends on specific
circumstances. Among other things, it depends on the relative cost of wind and solar compared with other sources, as well as the amount of federal and state financial support for wind and solar development that can offset some of the amount that consumers might otherwise pay. Taken together, the addition of wind and solar sources could have contributed to higher or lower
View GAO-15-524. For more information, contact Frank Rusco at (202) 512-3841 or
Letter 1 Background 3 The Electricity Generation Mix Has Shifted Toward More Natural
Gas, Wind, and Solar Sources, and Growth in Electricity
Consumption Has Slowed 11 Changes in Generation and Consumption Require System
Operators to Take Additional Actions to Maintain Reliability and
Affect Electricity Prices to Varying Extents 26 Agency Comments 36 Appendix I Scope and Methodology 37 Appendix II Stakeholders Interviewed 40 Appendix III Additional Information on Electricity-Generating Capacity and Actual
Generation 41 Appendix IV Additional Information on Electricity Consumption 53 Appendix V Additional Information on Electricity Prices 55 Appendix VI GAO Contact and Staff Acknowledgments 57 Related GAO Products 58
Tables
Table 1: Electricity Generation from Wind Power Plants and Percentage of National Wind Electricity Generation in
Table 2: Electricity-Generating Capacity and Actual Generation by Regional Reliability Entities and Select Sub-Regions and
Source, Select Years 43 Table 3: Electricity-Generating Capacity and Actual Generation by
Regional Transmission Organization (RTO) and Source,
Select Years 48 Table 4: Electricity-Generating Capacity and Actual Generation by
Regulatory Status and Source, Select Years 51 Table 5: Electricity-Generating Capacity Additions and
Retirements by Source, Actual (2001–2014) and Under
Construction and Planned (2015–2025) 52 Table 6: Retail Electricity Sales by Consumer Type, 2001–2014 53 Table 7: Retail Electricity Sales by Census Region, 2001–2014 54 Table 8: Real Retail Average Electricity Revenue per Kilowatt
Hour by Consumer Type, 2001–2014 55 Table 9: Real Retail Average Electricity Revenue per Kilowatt
Hour by Census Region, 2001–2014 56
Figures
Figure 1: Functions of the Electricity System 4 Figure 2: Share of Electricity-Generating Capacity and Actual
Generation in 2001 and 2013 by Source 12 Figure 3: Electricity Generated from Gas-Fueled Power Plants,
2001 through 2013 13 Figure 4: Electricity Generated from Wind and Solar Power Plants,
2001 through 2013 15 Figure 5: Change in Electricity Generated from Coal-Fueled
Power Plants, 2001 through 2013 20 Figure 6: Electricity-Generating Capacity under Construction and
Planned for Retirement from 2015–2025 by Source 23 Figure 7: U.S. Real Average Annual Retail Electricity Price, 2001–
2014 31
Figure 8: Real Annual Average Henry Hub Natural Gas Prices and PJM Western Hub Wholesale Electricity Prices, 2002–
2014 33
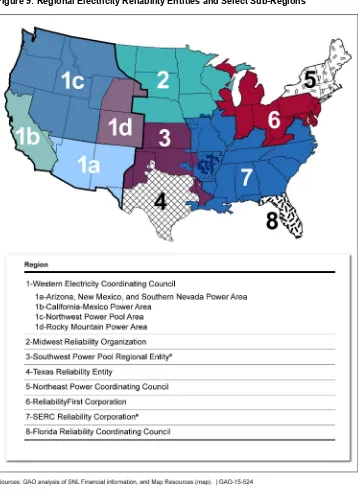
Figure 9: Regional Electricity Reliability Entities and Select
Sub-Regions 42
Figure 10: United States Regional Transmission Organizations
Abbreviations
EIA Energy Information Administration ERCOT Electric Reliability Council of Texas DOE Department of Energy
FERC Federal Energy Regulatory Commission ISO Independent System Operator
ITC Investment Tax Credit
NERC North American Electric Reliability Corporation PTC Production Tax Credit
RTO Regional Transmission Organizations SNL SNL Financial
May 29, 2015
The Honorable Lamar Smith Chairman
Committee on Science, Space, and Technology House of Representatives
The Honorable Jeff Sessions United States Senate
The Honorable Cynthia Lummis House of Representatives
The Honorable Gary Palmer House of Representatives
The electricity system is important to the health of the U.S. economy and well-being of Americans. Electricity has traditionally been generated largely from coal, natural gas, nuclear, and hydropower energy sources. More recently, various federal and state policies, tax incentives, and research and development efforts have supported the use of renewable energy sources such as wind, solar, and geothermal, which offer
environmental benefits over some traditional sources of electricity, such as fewer emissions of air pollutants. In addition, consumption of electricity has been affected by energy efficiency improvements, changes in the economy, and other factors.
You asked us to provide information on changes in the electricity system. This report examines what is known about (1) how electricity generation and consumption have changed since 2001, and (2) the implications of these changes on efforts to maintain reliability, and on electricity prices.
To conduct this work, we analyzed data on electricity generation,
Financial (SNL) current as of April 3, 2015.1 We generally present data on
changes from 2001 through 2013 because 2013 is the most recent year for which complete data are available, though in some instances we present more recent data. To describe changes in electricity
consumption, we examined data from the Energy Information Administration (EIA) on retail sales of electricity to consumers.2
We conducted this performance audit from November 2014 to May 2015 in accordance with generally accepted government auditing standards. Those standards require that we plan and perform the audit to obtain sufficient, appropriate evidence to provide a reasonable basis for our findings and conclusions based on our audit objectives. We believe that
We took several steps to assess the reliability of SNL and EIA data. We reviewed relevant documentation, interviewed SNL and EIA representatives, and compared some data elements to those available from other sources. We determined the data were sufficiently reliable for the purposes of this report. To identify implications of changes in electricity generation and consumption, we reviewed literature and interviewed stakeholders. We identified literature by conducting a literature search and obtaining
suggestions from the stakeholders we interviewed. Stakeholders included power plant owners, system operators, a state regulator,
non-governmental organizations, and federal agencies. We selected stakeholders to represent different perspectives and experiences
regarding changes in the industry, and to maintain balance with respect to sources of electricity and stakeholders’ roles in the market. Because this was a nonprobability sample, the views of stakeholders we selected are not generalizable to all potential stakeholders, but they illustrate a range of views. Identifying and examining federal agency actions to address the challenges identified were beyond the scope of this review. Appendix I provides additional information on our scope and methodology and appendix II lists the stakeholders we interviewed.
1SNL’s energy database combines information from multiple sources including the Energy
Information Administration, Federal Energy Regulatory Commission, and others. Data used in this report reflect information collected through a variety of means including the EIA-860 form that collects generator-level specific information about existing and planned power plants and the EIA 923 form that collects data on electricity generation and fuel consumption, among other things. Some data are updated annually, but SNL updates others more frequently. As plans may change, actual future retirements and units placed in service may differ from these plans.
2EIA is a statistical administration within the Department of Energy that collects, analyzes,
the evidence obtained provides a reasonable basis for our findings and conclusions based on our audit objectives.
This section describes (1) electricity generation and consumption in the United States, (2) federal and state actions that have influenced electricity generation and consumption, (3) electricity reliability, and (4) federal and state regulation.
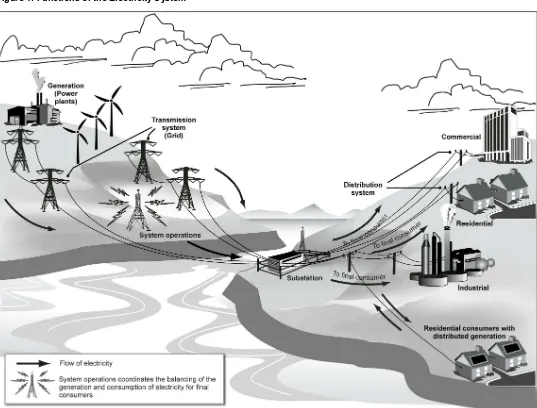
The electricity system includes four distinct functions: generation, transmission, distribution, and system operations (see fig. 1). Electricity may be generated at power plants by burning fossil fuels; through nuclear fission; or by harnessing renewable sources such as wind, solar,
geothermal energy, or hydropower.3 Once electricity is generated, it is
sent through the electricity grid, which consists of voltage, high-capacity transmission systems, to areas where it is transformed to a lower voltage and sent through the local distribution system for use by
industrial, commercial, residential, and other consumers.4
3Generating capacity is measured in megawatts (MW) and refers to the maximum
capability to generate electricity. The amount of electricity that is actually generated is referred to as generation, commonly expressed in megawatt hours (MWh). A megawatt is equal to 1,000,000 watts. One traditional incandescent light bulb consumes about 60 watts, and a comparable compact fluorescent light bulb consumes approximately 15 watts; therefore, 1,000,000 compact fluorescent light bulbs would consume 15 MWh in one hour.
Throughout this process, system operations are managed by a system operator, such as a local utility, that must constantly balance the generation and
consumption of electricity. To do so, system operators monitor electricity consumption from a centralized location using computerized systems and send minute-by-minute signals to power plants to adjust their output to match changes in consumption.
4According to EIA: (1) the industrial sector encompasses manufacturing, agriculture,
mining, and construction; (2) the commercial sector consists of businesses, institutions, and organizations that provide services such as schools, stores, office buildings, and sports arenas; (3) the residential sector includes households and excludes transportation; and (4) other includes electricity users not captured in the other three categories, including transportation.
Background
Figure 1: Functions of the Electricity System
had the lowest hourly operating costs.5 In general, system operators
maximize the amount of electricity supplied by the baseload plants, which are often used continuously for long periods of time. As demand rises through the day and through the year and exceeds the amount of electricity generation that can be delivered from baseload power plants, system operators have generally relied on electricity supplied by plants that provide peak generation, known as “peakers.” Peakers are usually less costly to build but more costly to operate.6 Wind and solar capacity
has somewhat different characteristics. Similar to baseload plants in some respects, wind and solar power plants are generally costly to build, but they have near-zero operating costs because they do not have to purchase fuel. However, wind and solar power plants are variable energy sources. That is, the amount of electricity they can generate varies with the amount of wind and sun and generally not at the discretion or request of system operators.
Various federal and state actions have influenced electricity generation. Regarding federal actions, in April 2015, we found that from fiscal year 2004 through 2013, federal programs aided the development of new electricity-generating capacity through various means, including outlays, loan programs, and tax expenditures.7 In more recent years, federal
actions have been targeted toward renewable sources such as wind and solar, although there has also been federal support for coal, nuclear, and natural gas-fueled generation.8
5The types of technologies used to provide baseload generation vary but often include
plants using coal, nuclear, hydropower, or combined-cycle natural gas technologies—units that utilize a combustion turbine in conjunction with a steam turbine to produce electricity.
For example, two tax credits—the
6The types of technologies used to provide peaking generation can vary but often include
plants using natural gas in combustion turbines.
7Electricity Generation Projects: Additional Data Could Improve Understanding of the
Effectiveness of Tax Expenditures
expenditures are tax provisions—including tax deductions and credits—that are exceptions to the normal structure of individual and corporate income tax requirements necessary to collect federal revenue. Tax expenditures can have the same effects on the federal budget as spending programs—namely that the government has less money available to use for other purposes.
8The scope of our April 2015 report was limited to supports for the construction of new
utility-scale electricity generation projects. For more information on federal supports for energy production and consumption more broadly, see GAO, Energy Policy: Information on Federal and Other Factors Influencing U.S. Energy Production and Consumption from
2000 through 2013
Production Tax Credit (PTC) and the Investment Tax Credit (ITC)—and a related program that provided payments in lieu of these tax credits
supported wind and solar electricity by lowering the costs associated with electricity generation and providing an incentive to those firms engaged in the construction and operation of wind and solar projects. The
Department of the Treasury estimated that these two tax credits resulted in almost $12 billion in revenue losses for the federal government from fiscal year 2004 through 2013.9 In addition, the related payment program
provided almost $17 billion in outlays from fiscal year 2004 through 2013.10 EIA recently estimated that wind, solar, and other renewables,
accounted for about 72 percent of all electricity-related direct federal financial interventions and subsidies in fiscal year 2013.11
Regarding state actions, our April 2015 report found that key state supports aided the development of electricity generation projects— particularly renewable ones—in most states, from fiscal year 2004 through 2013.12
9Specifically, the PTC accounted for an estimated $8.1 billion in forgone revenue and, as
of the end of 2013, provided an income tax credit of 2.3 cents per kilowatt-hour of electricity produced form wind and certain other renewable sources. Since it was first made available in 1992, the PTC has expired six times—in 1999, 2001, 2003, 2012, 2013, and 2014. Most recently, the PTC was extended for certain qualified facilities for projects that began construction before January 1, 2015. Because the credit is taken over a 10-year period once a project is placed in service, the PTC will continue to result in forgone revenue for years to come. The ITC accounted for an estimated $3.4 billion in forgone revenue and provided an income tax credit up to 30 percent for the development of solar, wind, and certain other renewable projects. The ITC was first established in 1978 at 10 percent of eligible investment costs and was temporarily increased in 2005 to 30 percent for solar and certain other technologies. Subsequent legislation extended the ITC at 30 percent for these technologies through December 31, 2016. After January 1, 2017, the ITC is scheduled to return to 10 percent of eligible investment costs for solar projects.
For example, we found that as of September 2014, 38 states and the District of Columbia had established renewable portfolio
10Section 1603 of the American Recovery and Reinvestment Act of 2009 (Pub. L. No.
111-5, § 1603, 123 Stat. 115, 364 (Feb. 19, 2009)), as amended, allows taxpayers eligible for the PTC or ITC to receive a payment from the Treasury in lieu of a tax credit.
11EIA’s estimates do not include all subsidies beneficial to energy activities, and were
instead limited to activities that provide a financial benefit with an identifiable federal budget effect and that are specifically targeted at energy markets. Further, EIA’s estimates do not account for the effectiveness of support programs, which may vary across fuel sources. See EIA, Direct Federal Financial Interventions and Subsidies in Energy in Fiscal Year 2013 (Washington, D.C.: March 2015).
standards or goals.13
Federal and state activities have also encouraged energy efficiency, which can reduce the consumption of electricity. For example, Treasury estimated that energy-efficiency-related federal tax expenditures, such as for household energy efficiency improvements and the purchase of energy efficient equipment, amounted to over $15 billion in forgone revenue for the federal government from fiscal year 2000 through 2013.
Such policies mandate or set goals that retail service providers obtain a minimum portion of the electricity they sell from renewable sources, creating additional demand for renewables. Retail service providers meet these requirements in various ways, such as by building renewable generating capacity or purchasing renewable generation from other producers through long-term contracts known as power purchase agreements.
14
State governments have also played an important role in encouraging energy efficiency. According to the American Council for an Energy-Efficient Economy, as of April 2014, 25 states had fully funded policies in place that establish specific energy savings targets that utilities or
nonutility program administrators must meet through customer energy efficiency programs. In March 2014, we found that the federal
government has also made efforts to facilitate activities that encourage customers to reduce demand when the cost to generate electricity is high, known as demand-response activities.15 These efforts have included
actions to fund the installation of advanced electricity meters that facilitate these demand-response activities, as well as regulatory efforts to
encourage demand-response activities.
Electricity reliability—the ability to meet consumers’ electricity demand at all times—is influenced by a variety of factors. Since electricity cannot be
13This information is derived from our survey of state regulatory commissions and data
from the Database of State Incentives for Renewable Energy, which is funded by DOE and others.
14Specifically, Treasury estimated that forgone revenue associated with the credit for
energy efficiency improvements to existing homes amounted to $10.36 billion, the credit for residential energy efficiency property amounted to $3.08 billion, and the exclusion of utility conservation subsidies amounted to $2.04 billion from fiscal 2000 through 2013.
15GAO, Electricity Markets: Demand-Response Activities Have Increased, but FERC
Could Improve Data Collection and Reporting Efforts, 27, 2014).
easily and inexpensively stored, electricity generated must be matched with demand, which varies significantly depending on the time of day and year. To maintain a reliable supply of electricity, system operators take steps to ensure that power plants will be available to generate electricity when needed. In doing so, system operators typically ensure available capacity exceeds estimated demand so that any unexpected increases in demand or power plant or transmission outages can be accommodated without consumers losing access to electricity.
Maintaining a reliable supply of electricity is a complex process requiring the system operator to coordinate three broad types of services as follows:
• Capacity: Operators procure generating capacity—long-term commitments to have available specific amounts of
electricity-generating capacity to ensure that there will be sufficient electricity to reliably meet expected future electricity needs. Procuring capacity may involve operators of power plants committing that existing or new power plants will be available to generate electricity in the future, if needed.
• Energy: Operators schedule which power plants will generate electricity throughout the day—referred to as energy scheduling—to maintain the balance of electricity generation and consumption.
• Ancillary services: Operators procure several ancillary services to maintain a reliable electricity supply. Ancillary services generally involve resources being available on short notice to increase or
decrease their generation or consumption.16 These and other services
are needed to ensure supply and demand remain in balance so that electricity can be delivered within technical standards—for example, at the right voltage and frequency—to keep the grid stable and to protect equipment that needs to operate at specific voltage and frequency levels.
16Such ancillary services are often referred to as reserves, and they help ensure that
Responsibility for regulating electricity prices is divided between the states and the federal government. Most electricity consumers are served by retail markets that are regulated by the states, generally through state public utility commissions or equivalent organizations. As the primary regulator of retail markets, state commissions approve many aspects of utility operations, such as the siting and construction of new power plants, as well as the prices consumers pay and how those prices are set.17 Prior
to being sold to retail consumers, electricity may be bought, sold, and traded in wholesale electricity markets by a variety of market participants, including companies that own power plants, as well as utilities and other retail service providers that sell electricity directly to retail consumers. Wholesale electricity markets are overseen by the Federal Energy Regulatory Commission (FERC).18
During the last 2 decades, some states and the federal government have taken steps to restructure electricity markets with the goal of increasing competition. The electricity industry has historically been characterized by utilities that were integrated and provided the four functions of electricity service—generation, transmission, distribution, and system operations— to all retail consumers in a specified area. In much of the Western, Central, and Southeastern United States, retail electricity delivery continues to operate under this regulatory approach, and these regions are referred to as traditionally regulated regions. In parts of the country where states have taken steps to restructure retail electricity markets, new entities called retail service providers compete with utilities to provide electricity to retail consumers by offering electricity plans with differing
17The price consumers pay for electricity is often a combination of rates determined by
regulators and prices determined by markets. Rates are generally approved by regulators and set to recover the cost of providing a service plus a rate of return. Prices are market-based, determined based on the interaction of supply and demand. For the purposes of this report, we generally use “prices” to refer to both rates and prices.
18FERC oversees wholesale electricity sales and, among other things, has statutory
responsibility to ensure that wholesale electricity rates are “just and reasonable” and not “unduly discriminatory or preferential.” FERC is also responsible for regulating
transmission of electricity in interstate commerce by privately owned utilities. FERC does not regulate transmission or wholesale electricity sales in most of the state of Texas because Texas’ grid is separate from the rest of the U.S. grid. In addition, FERC does not regulate transmission or wholesale electricity sales in Alaska or Hawaii because of their geographical isolation. Further, FERC does not have jurisdiction over municipal utilities or most electric cooperatives.
Federal and State
prices, terms, and incentives.19 Beginning in the late 1990s, FERC took a
series of steps to restructure wholesale electricity markets, and wholesale electricity prices are now largely determined by the interaction of supply and demand rather than regulation. In addition, FERC encouraged the voluntary creation of new entities called Regional Transmission
Organizations (RTO) to manage regional networks of electric
transmission lines as system operators—functions that had traditionally been carried out by local utilities.20
In addition to its role in regulating aspects of the electricity market, FERC is also responsible for approving and enforcing standards to ensure the reliability of the bulk power system—generally the generation and transmission systems.21 FERC designated the North American Electric
Reliability Corporation (NERC) to develop and enforce these reliability standards, subject to FERC review. These standards outline general requirements for planning and operating the bulk power system to ensure reliability. For example, one reliability standard requires that system planners plan and develop their systems to meet the demand for
electricity even if equipment on the bulk power system, such as a single generating unit or transformer, is damaged or otherwise unable to operate.22
19We use the term retail service provider to encompass regulated utilities providing retail
electricity service as well as other qualified providers who may not own generation, transmission, or distribution assets.
20RTOs have been created in regions that cover much of California and the eastern
United States, except the Southeast. In addition to acting as system operators, these regional transmission organizations have developed organized wholesale markets for buying and selling electricity and other needed services to operate the grid, such as ancillary services.
21The bulk power system refers to facilities and control systems necessary for operating
the electric transmission network and certain generation facilities needed for reliability.
22NERC, Transmission System Planning Performance Requirements, Standard
According to our analysis of SNL data, the mix of energy sources used to generate electricity has generally shifted to include more natural gas, wind, and solar, but less coal and nuclear, from 2001 through 2013, though the extent of these changes varied by region. Growth in electricity consumption has generally slowed, with key differences among different types of consumers and regions.
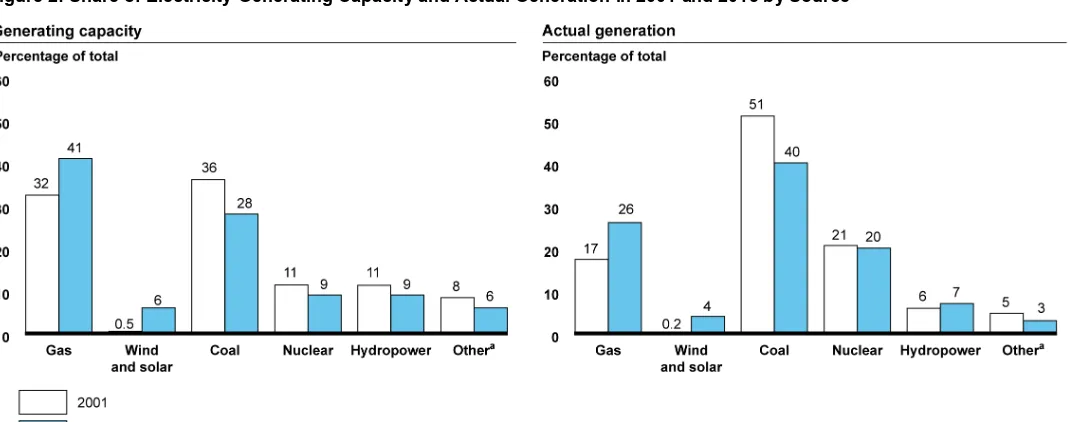
Natural gas, wind, and solar sources provided larger portions of the nation’s electricity mix from 2001 through 2013 in terms of both generating capacity and actual generation, while coal and nuclear
sources provided smaller portions, according to our analysis of SNL data (see fig. 2).23
23SNL data include data on generating units and power plants. (A power plant may have
multiple generating units.) All capacity data presented here refer to generating-unit level data. Because of differing data availability, generation data represent a combination of individual data at the unit level (representing about 71 percent of generation in 2013) and at the plant level (representing the remaining 29 percent of generation in 2013). These plant level data were imputed to the unit level based on each generating unit’s share of a plant’s generating capacity. SNL identifies the primary energy source for each unit using data from the most recent year, and we used this categorization to analyze changes in generating capacity and generation. One shortcoming of this approach is that it misses changes over time in energy sources at units capable of using more than one energy source. See appendix I for additional information on these data.
At the time of our analysis, 2013 was the most recent year with complete data for both generating capacity and generation. The growth or decline in specific energy sources varied over this time period and across U.S. regions. (See app. III for additional information on
electricity-generating capacity and actual generation by region.) SNL data on power plants under construction and planned for retirement suggest that these recent trends are likely to continue.
Figure 2: Share of Electricity-Generating Capacity and Actual Generation in 2001 and 2013 by Source
Notes: Includes generating units identified by their primary energy source in the most recent year at power plants with capacities of at least 1 megawatt that are connected to the grid and intend to sell electricity to retail customers or retail service providers. Generating capacity refers to the maximum capability of a generating unit to generate electricity. Numbers may not sum to 100 due to rounding.
a
The “other” category includes biomass, geothermal, oil, and other nonrenewable sources.
Generating capacity and actual generation from natural-gas-fueled power plants increased across the nation from 2001 through 2013, with different regions seeing varying levels of growth, according to our analysis of SNL data. Natural-gas-fueled generating capacity increased by about 181,000 MW during this period, and accounted for 72 percent of the new
generating capacity added from all sources.24
24This trend continued in 2014 with the addition of approximately 4,000 MW of gas-fueled
generating capacity.
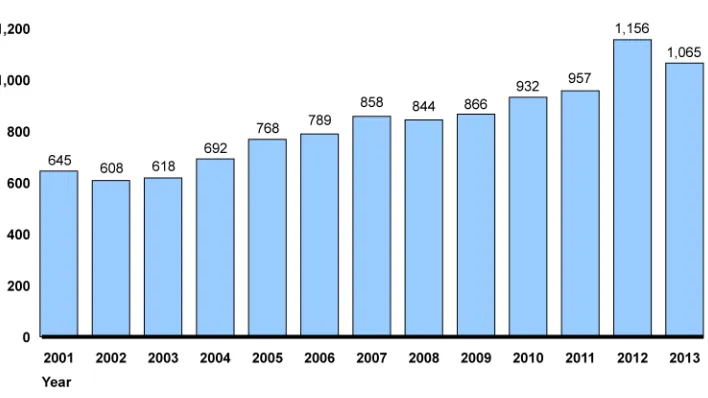
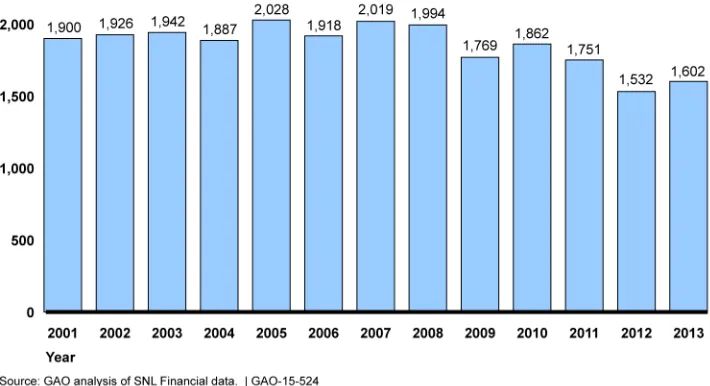
This increase in gas-fueled capacity resulted from the construction of about 270,000 MW during this period offset by a smaller amount of retirements. Regarding actual generation, electricity generated from natural-gas-fueled power plants generally increased throughout this period, with a pronounced jump from 2011 through 2012 when generation increased by about 21 percent (see
fig. 3).25 The average utilization of natural-gas-fueled capacity—a
measure of the intensity with which capacity was operated—varied over this period, declining from about 30 percent in 2001 to a low of about 20 percent in 2003 before generally increasing to about 27 percent in 2013.26
Figure 3: Electricity Generated from Gas-Fueled Power Plants, 2001 through 2013
Increases in gas-fueled capacity and generation led to natural gas accounting for a larger share of the nation’s electricity mix, increasing from 17 percent of generation in 2001 to 26 percent in 2013.
Note: Includes generation from units identified by their primary energy source in the most recent year at power plants with capacities of at least 1 megawatt that are connected to the grid and intend to sell electricity to retail consumers or retail service providers.
All but one region of the country experienced increases in the amount of electricity generated from natural gas over this period. Specifically, electricity generated from natural gas declined in Alaska and increased in
25Preliminary data from EIA suggest that electricity generated from natural gas declined
by 0.3 percent in 2014. (See EIA, Monthly Energy Review, March 27, 2015.)
26Data on utilization presented in this report are the capacity-weighted annual average
the rest of the United States, ranging from an increase of 5 percent in Texas to almost 200 percent in some regions in the East. In some regions, natural gas became an increasingly significant energy source in the generation mix. For example, in New England, natural gas increased from 31 percent of the region’s electricity generation in 2001 to 42 percent in 2013. According to EIA, lower natural gas prices, regional
environmental initiatives, and other factors have contributed to increases in gas-fueled electricity generation.27
As the use of natural gas to generate electricity has increased since 2001, the mix of technologies used in gas-fueled power plants has also changed. Specifically, combined-cycle plants, which use a combustion turbine in conjunction with a steam turbine to generate electricity, have become an increasingly common technology for generating electricity— growing from 7 percent of total electricity generation in 2001 to 23 percent in 2013, according to SNL data (increasing from 42 percent of electricity generated from gas in 2001 to 86 percent in 2013).28
27See, for example, EIA, Today in Energy: Northeast grows increasingly reliant on natural
gas for power generation (Washington, D.C.: November 12, 2013).
Though more
expensive to build initially, such plants are more fuel-efficient than simpler combustion turbine plant designs. This efficiency can make it
economically feasible to generate electricity with natural gas for sustained periods. As a result, these plants can be economically operated like traditional baseload generation such as coal and nuclear plants, which often run continuously for long periods of time. Trends in the utilization of combined-cycle and other gas-fueled power plants differed over this period. Utilization decreased for all gas-fueled capacity in the early 2000s, but while it has increased since 2003 for combined-cycle capacity (from 34 percent in 2003 to almost 44 percent in 2013), utilization has declined somewhat for other gas-fueled technologies (from 12 percent in 2003 to 8 percent in 2013).
28Combined-cycle plants use two processes to produce electricity, one of which involves
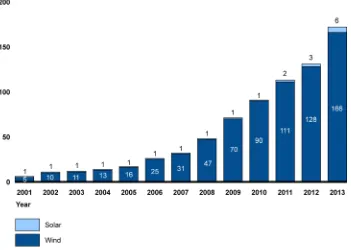
Generating capacity and actual generation from wind and, to a lesser extent, solar power plants increased from 2001 through 2013, with most of the increase occurring since 2007. (See fig. 4.) We have previously found that various federal and state actions have contributed to increases in wind and solar power plant capacity, including financial supports and state renewable portfolio standards.29
Figure 4: Electricity Generated from Wind and Solar Power Plants, 2001 through 2013
These increases led to wind and, to a lesser extent, solar accounting for a larger share of the nation’s energy mix, increasing from just over 0 percent of electricity generation in 2001 to 4 percent in 2013.
Note: Includes generation from units identified by their primary energy source in the most recent year at power plants with capacities of at least 1 megawatt that are connected to the grid and intend to sell electricity to retail consumers or retail service providers.
29SWind Energy: Additional Actions Could Help Ensure
Effective Use of Federal Financial Support, 2013); and Solar Energy: Federal Initiatives Overlap but Take Measures to Avoid
Duplication,
Regarding wind, generating capacity increased about sixteen fold over this period, with 57,000 MW of capacity added from 2001 through 2013 and wind’s share of total generating capacity increasing from just over 0 percent in 2001 to 5.4 percent in 2013.30
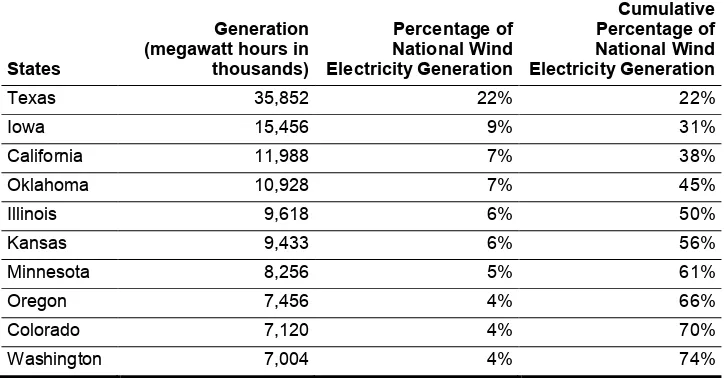
Electricity generated from wind is concentrated in a few states; as shown in table 1, 74 percent of total electricity generated from wind came from 10 states in 2013. In addition, wind can contribute a substantial portion of generation in some areas. For example, in the Upper Midwest region of the country, including states such as Minnesota and Iowa, about 14 percent of the region’s electricity came from wind power plants. In addition, representatives from one utility told us they have had hours where 60 percent of the electricity produced on their system came from wind sources, and their system has experienced longer periods with over 50 percent wind generation. By contrast, other regions of the country, such as the southeastern United States, produced less than 1 percent of their total electricity from wind in 2013.
However, these plants operate less intensively than some other sources because wind power plants only generate electricity when the wind is blowing. As such, wind’s share of the nation’s actual generation increased from just over 0 percent in 2001 to about 4 percent in 2013. Generation from wind increased by over 160 million MWh from 2001 through 2013, the second largest increase in actual generation of all energy sources after natural gas. Most of this increase, 136 million MWh (or 84 percent of the total increase), occurred since 2007. The average utilization of wind power plants fluctuated over this period between 26 and 33 percent.
30This trend continued in 2014 with the addition of about 5,000 MW of wind generating
Table 1: Electricity Generation from Wind Power Plants and Percentage of National Wind Electricity Generation in 2013 for the Top 10 States
States
Generation (megawatt hours in thousands)
Percentage of National Wind Electricity Generation
Cumulative Percentage of National Wind Electricity Generation
Texas 35,852 22% 22%
Iowa 15,456 9% 31%
California 11,988 7% 38%
Oklahoma 10,928 7% 45%
Illinois 9,618 6% 50%
Kansas 9,433 6% 56%
Minnesota 8,256 5% 61%
Oregon 7,456 4% 66%
Colorado 7,120 4% 70%
Washington 7,004 4% 74%
Source: GAO analysis of SNL Financial Data. | GAO-15-524
Regarding solar, generating capacity increased by about 7,000 MW, or about eighteen-fold, from 2001 through 2013 at larger power plants with capacities of at least 1 MW. This trend accelerated in 2014 with the addition of over 3,000 MW of solar generating capacity, and total solar generating capacity reached about 10,000 MW. Regarding actual generation, electricity generated at large solar power plants increased about 7 fold—by about 5 million MWh—from 2001 through 2013. The average utilization of solar power plants fluctuated over this period between 16 percent and 25 percent. Despite the growth in solar capacity and generation, large solar power plant generation contributed less than 0.2 percent of total electricity generation nationwide in 2013.31 More so
than wind generation, generation from solar power plants was
concentrated in a small number of states. For example, California and Arizona accounted for over half of electricity generation from large solar power plants in 2013.
Generating capacity and actual generation from coal-fueled power plants declined from 2001 through 2013 as plants retired and in some cases, witnessed changes in their usage patterns, according to our analysis of SNL data. Coal-fueled electricity-generating capacity was stable for most of this period, but declined over the last couple years as aging plants retired and little new capacity was added. Specifically, from 2001 through 2013, about 29,500 MW of coal-fueled generating capacity retired, with about 75 percent of those retirements occurring from 2009 through 2013.32
31Preliminary estimates from EIA suggest that solar accounted for over 0.4 percent of
electricity generation in 2014. (See EIA, Monthly Energy Review (Mar. 26, 2015).)
In our October 2012 and August 2014 reports, we found that a
32This trend continued in 2014 with the retirement of about 3,700 MW of coal-fueled
generating capacity.
Distributed solar generation has also increased
Data on solar generating capacity and actual generation do not include distributed solar installations, such as capacity installed on household or commercial rooftops—known as distributed generation. Data from an industry association show that distributed solar generating capacity has increased to reach over 8,500 MW as of the end of 2014— compared to about 10,000 MW that was installed at larger solar power plants based on SNL data that we reviewed.a
Source: GAO. |
The electricity generated at such distributed generation sites is not generally measured or managed by the system operator. Nonetheless, it can be a significant portion of the generation mix in some regions. For example, according to the largest utility in Hawaii, solar systems had been installed on 12 percent of residential consumer sites in Hawaii as of the end of 2014, and on the island of Oahu, this capacity was equivalent to about 25 percent of the island’s peak electricity needs.
GAO-15-524
a
Contribution of Coal Has
Declined
number of factors have contributed to companies retiring coal-fueled power plants, including comparatively low natural-gas prices, the potential need to invest in new equipment to comply with environmental
regulations, increasing prices for coal, and low expected growth in demand for electricity.33
Actual generation from coal declined—in particular since 2008—as natural gas prices fell and made coal-fueled power plants comparatively less competitive (see fig 5). Generation from coal declined in most regions of the country. Several regions, such as New England, experienced large decreases as they shifted away from coal. As coal-fueled generation has declined, coal-coal-fueled power plants have, in general, been utilized less intensively. The average utilization of coal-fueled
capacity fluctuated around 70 percent from 2001 through 2008 and then began a general decline to about 59 percent in 2013. For example, representatives from the system operator ISO New England told us that their region no longer regularly uses its coal-fueled power plants to generate baseload electricity.
We found that the facilities that power companies have retired or plan to retire are generally older, smaller, and more
polluting, and some had not been used extensively.
34 Instead, representatives told us that these
plants are more often used to generate electricity during peak periods or when other resources are not available.35
33GAO, Electricity: Significant Changes Are Expected in Coal-Fueled Generation, but Coal
is Likely to Remain a Key Fuel Source
Retirements of some coal-fueled power plants and the decrease in usage among others led to coal accounting for a smaller share of the nation’s generating capacity and generation.
and EPA Regulations and Electricity: Update on Agencies’ Monitoring Efforts and
Coal-Fueled Generating Unit Retirements,
34ISO New England serves Connecticut, Maine, Massachusetts, New Hampshire, Rhode
Island, and Vermont.
35ISO New England representatives also noted that the region’s oil plants provided similar
Figure 5: Change in Electricity Generated from Coal-Fueled Power Plants, 2001 through 2013
Note: Includes generation from units identified by their primary energy source in the most recent year at power plants with generating capacities of at least 1 megawatt that are connected to the grid and intend to sell electricity to retail customers or retail service providers.
Generating capacity and actual generation from nuclear power plants both increased from 2001 through 2013, but the share of nuclear in the national electricity mix declined because other sources increased by a larger amount, according to our analysis of SNL data. No new nuclear power plants were built during this period, and four nuclear power plants retired in the last 2 years, accounting for about 4,200 MW of capacity.36
36In 2013 and 2014, four nuclear power plants with five nuclear generating units retired.
Specifically, in 2013, three plants with four nuclear generating units retired: Kewaunee (574 MW) in Wisconsin, Crystal River Nuclear Unit 3 (877 MW) in Florida, and San Onofre Nuclear Generating Station, Units 2 and 3 in California (1,070 and 1,080 MW,
respectively). In December 2014, the Vermont Yankee plant in Vermont (604 MW) retired. These retirements are not reflected in the 2013 capacity numbers presented above because all of the plants were operating during part of 2013.
However, nuclear generating capacity increased by 5 percent from 2001 through 2013 because of capacity increases at some existing plants as owners upgraded equipment or undertook other changes. Regarding
actual generation, electricity generated at nuclear power plants increased by 3 percent. The average utilization of nuclear power plants fluctuated around 90 percent throughout this period. Since nuclear plants tend to be larger capacity plants that run continuously for long periods of time, the retirement of a single plant can have significant effects on a regional power system. For example, representatives at ISO New England said that the Vermont Yankee nuclear power plant, which retired in December 2014, had generated about 5 percent of total electricity generation in their region in 2014. Since nuclear generating capacity and generation did not increase as much as gas, wind, and solar, nuclear accounted for a slightly smaller share of the national electricity mix, decreasing from 21 percent of generation in 2001 to 20 percent in 2013.
The contributions of other energy sources to the nation’s energy mix have also changed according to our analysis of SNL data, as follows:
• Hydropower: Generating capacity and actual generation from hydropower plants increased from 2001 through 2013, by 3,600 MW and 68 million MWh respectively.37 Generation from hydropower
plants varies from year to year based on a region’s weather,
particularly the amount of rain or snow, according to EIA. The western region generates more electricity from hydropower than any other region and accounted for 57 percent (about 39 million MWh) of the increase in generation during this period. The average utilization of hydropower capacity fluctuated between 28 percent and 38 percent throughout this period. While hydropower generating capacity increased in absolute terms through new construction and increases in capacity at existing hydropower plants, its share of capacity
declined because hydropower generating capacity did not increase as much as other sources, such as natural gas and wind.
• Other sources: Generating capacity and actual generation from other sources—including oil, biomass, and geothermal together—declined overall from 2001 through 2013. This decline was primarily driven by declines in oil-fueled power plants, where generation declined by over 80 percent and average utilization declined over the period. Two regions, New England and Florida, accounted for a large portion of the decline in oil-fueled power plant generation. Although oil was a relatively small portion of overall generation in the beginning of the
37Hydropower sources include conventional hydropower plants and pumped storage.
Contributions of Other Sources
period, its share of generation declined further as oil prices rose in the mid-2000s. Generating capacity and actual generation from biomass, geothermal, and other sources increased overall from 2001 through 2013. These changes had little effect on the overall national electricity generation mix, as these other sources represent a small and stable portion of generation—about 2 percent of the national total in both 2001 and 2013.
Our analysis of SNL data on generating capacity currently under
construction and companies’ plans to retire generating capacity suggests that these general changes in the electricity generation mix are likely to continue.38 Figure 6 shows the amount of generating capacity under
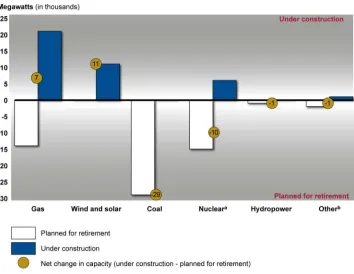
construction, the amount planned for retirement from 2015 through 2025, and the net change (capacity under construction minus planned for retirement), and highlights that natural gas, wind, and solar capacity may continue to increase. There is no coal capacity under construction, and while about 6,000 MW of nuclear capacity is under construction, more nuclear capacity (about 15,000 MW) is planned for retirement than is under construction.39
38These data reflect information available through SNL as of April 3, 2015, and include
units with announced retirement dates from 2015 through 2025 and units that are currently under construction. These data may not reflect all plans, particularly for later years.
These data do not include capacity that is in pre-construction-planning stages or that has not formally announced retirement.
39Planned retirements for nuclear plants included officially announced retirements as well
as plants in which the license to operate is set to expire. This license expiration date may not reflect an actual intent to retire the plant, it can indicate that the request for a license renewal has either not yet been submitted for an extension, or that the license renewal request has not yet been approved by the Nuclear Regulatory Commission.
Figure 6: Electricity-Generating Capacity under Construction and Planned for Retirement from 2015–2025 by Source
Notes: Includes generating units identified by their primary energy source in the most recent year at power plants with capacities of at least 1 megawatt that are connected to the grid and intend to sell electricity to retail customers or retail service providers. Capacity under construction refers to all capacity under construction, and capacity planned for retirement refers to capacity with planned retirement dates from 2015–2025. Generating capacity refers to the maximum capability of a generating unit to generate electricity. Capacity under construction minus capacity planned for retirement may not equal net change due to rounding.
a
Planned retirements for nuclear plants included officially announced retirements as well as plants in which the license to operate is set to expire. This license expiration date may not reflect an actual intent to retire the plant; it can indicate that the request for a license renewal has either not yet been submitted for an extension or that the license renewal request has not yet been approved by the Nuclear Regulatory Commission.
b
The “other” category includes biomass, geothermal, oil, and other nonrenewable sources. The majority of the change in this category is from planned retirements of oil-fueled power plants.
Continuing a long-term trend, growth in electricity consumption slowed from 2001 through 2014. According to EIA data on annual national electricity retail sales—a proxy for end-use consumption—the rate of growth of electricity consumption has slowed in each decade since the 1950s, from growing almost 9 percent per year in the 1950s, to over 2 percent per year in the 1980s and 1990s. This decreasing growth trend
continued in the 2000s, with electricity retail sales growing by over 1 percent per year from 2001 through 2007, and fluctuating, but remaining largely flat from that time through 2014.40
These overall trends mask differences in consumption patterns for
different types of consumers, in different regions, and during peak periods of consumption. Regarding consumers, industrial electricity consumption has decreased since 2001, while commercial and residential consumption have increased. Specifically, industrial consumption decreased by 4 percent over the period from 2001 through 2014, and the sector’s share of total electricity consumption declined from 29 percent to 26 percent. Meanwhile, residential electricity consumption increased 17 percent, and commercial consumption increased 25 percent over this period.
Regarding regional differences, consumption patterns have varied across the country. For example, consumption declined by almost 5 percent in the Northeast (Mid-Atlantic and New England states) since the recession of 2007 and through 2014, while it increased by over 9 percent in the West South Central states of Texas, Louisiana, Oklahoma and Arkansas over that same period. (See app. IV for additional information on
consumption by consumer type and region.)
In contrast to the slowdown in the growth of overall electricity
consumption, peak consumption has, in some cases, increased. Peak consumption refers to the level of electricity consumed when the overall system usage is at its highest, such as during hot days when air
conditioning usage is high.41 Changes in peak consumption levels have,
in some instances, differed from changes in total consumption over the course of a year. For example, in New England, while overall
consumption has declined, peak consumption has risen according to EIA.
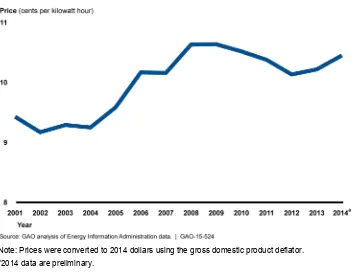
402014 data are preliminary estimates.
41Peak consumption, as used here, is the maximum level of demand over a specified
According to literature we reviewed, the following factors have contributed to these changes in electricity consumption:
• Changes in the economy: Changes in electricity consumption are often closely linked to the economy, according to EIA.42 In this regard,
the economic recession from late 2007 through 2009 was associated with a large drop in electricity consumption in the industrial sector. Since many industrial operations operate more evenly throughout the year, declines in industrial operations could lead to reduced electricity consumption throughout the year.
• Efficiency improvements: Overall improvements in the efficiency of technologies powered by electricity—such as household appliances and others—have slowed the growth of electricity consumption, according to EIA.43 For example, according to EIA, a new refrigerator
purchased today uses less than a third as much electricity as one purchased in the late 1970s, despite the larger size of today’s refrigerators.44
• Changes in the uses of electricity: Consumer uses of electricity have changed over the last decades, affecting the nature of electricity consumption. For example, the growing use of computers and home entertainment devices has increased the use of electricity. In addition, air conditioning has become more widely used in U.S. households. As a result, a heat wave—often associated with peak levels of electricity consumption—may lead to more electricity consumption during peak periods than in the past.
• Demand-response activities: Another factor that may have affected consumption trends, particularly peak consumption, is the increasing use of demand-response activities—steps taken to encourage consumers to reduce consumption during periods of high demand when the costs to generate electricity are high. For example, system operators may call on industrial consumers to reduce their electricity usage during periods of high demand in exchange for a payment or
42EIA, Today in Energy: U.S. economy and electricity demand growth are linked, but
relationship is changing (Mar. 22, 2013).
43EIA, Annual Energy Outlook 2014, DOE/EIA-0383 (Washington, D.C.: April 2014).
44EIA, Today in Energy (Mar. 22, 2013).
Distributed generation and electricity consumption data
Growth in distributed generation such as rooftop solar may have also contributed to changes shown in EIA’s data on retail electricity sales. Households and commercial facilities that generate some of their own electricity displace some electricity sales. Therefore, actual electricity consumption may be higher than suggested by retail electricity sales data. According to EIA, this effect is difficult to measure because data on electricity generated from distributed generation sources are not readily available.
other financial incentive. In March 2014, we cited FERC data suggesting that the extent of demand-response activities had
increased overall—more than doubling from 2005 to reach about 8.5 percent of potential reduction in peak consumption in 2011.45
According to literature we reviewed and stakeholders we interviewed, changes in electricity generation and consumption have required system operators to take additional actions to maintain reliability. Changes in generation and consumption, together with additional actions system operators have taken to maintain reliability, have affected consumer electricity prices to varying extents, though the net effect on prices is unclear.
According to several stakeholders we interviewed and literature we reviewed,46
• Increased reliance on natural gas: The increased reliance on natural gas to generate electricity in some regions of the country has sometimes required system operators to take additional actions to maintain reliability. Although all fuel-based electricity generation can face fuel supply challenges, natural-gas-fueled power plants face different challenges than sources such as coal, oil, and nuclear. For
changes in generation and consumption have led system operators to take additional actions to reliably provide electricity to consumers, as follows:
45The potential to reduce peak electricity consumption describes the capability of
consumers participating in demand-response programs to reduce their electricity use, an action that, in turn, may reduce the system’s peak electricity consumption. These data reflect the 59 percent of utilities and other entities responding to FERC’s survey, rather than the extent of demand-response throughout the United States. S
46We spoke with 21 stakeholders selected to represent a cross section of the electricity
industry and reviewed relevant literature. Throughout the report we use the indefinite quantifier, “several” when three or more stakeholder and literature sources combined supported a particular idea or statement.
example, natural gas is not easily stored on site, so the ability of a natural-gas-fueled power plant to generate electricity generally depends on the real-time delivery of natural gas through a network of pipelines. Some regions have recently experienced challenges in maintaining the delivery of natural gas supplies to power plants. For example, in January 2014, a severe cold weather event know as a “polar vortex” affected much of the central and eastern United States, causing significant outages at plants using various fuel sources and leading to higher than normal demand for natural gas for both electricity generation and home heating. According to FERC, there were no widespread electricity outages. However, challenges delivering fuel to natural-gas-fueled power plants posed significant concerns and resulted in outages at some natural-gas-fueled power plants. System operators took various steps to limit the effect of this event, including relying on power plants that utilize other fuel sources that were more readily available at that time, such as coal and oil, issuing public appeals for conservation, utilizing demand-response resources, and implementing certain emergency procedures. Going forward, several stakeholders raised concerns about the sufficiency of natural gas pipeline capacity in some regions to meet potential greater future needs. However, FERC has reported that actions taken since the 2013–2014 winter—including improved communications between the electricity and natural gas industries and additional cold-weather preparation—led to better operational performance during the 2014– 2015 winter, which also presented extremely challenging cold-weather conditions.47 In addition, a recent Department of Energy (DOE) study
suggests that the future needs for interstate natural gas pipelines may be modest relative to the historical level of pipeline capacity
additions.48
• Increased use of wind and solar: The increased use of wind and solar to generate electricity has increased operational uncertainty, which has required system operators to take additional actions to maintain reliability. The electricity that wind and solar power plants provide is variable—that is, the amount of electricity they generate varies with the availability of the wind and sun at a given point in time
47FERC, 2014 State of the Markets (Washington, D.C.: Mar. 19, 2015).
48DOE, Natural Gas Infrastructure Implications of Increased Demand from the Electric
and cannot generally be increased by the system operator. Among other things, system operators modulate the operation of traditional power plants—referred to as ramping and cycling—to offset
fluctuations in wind and solar electricity generation throughout the day. Because these fluctuations are largely weather-based, several system operators told us they have had to develop forecasting tools to be able to predict wind and solar output in order to effectively
schedule other sources to generate electricity when wind and solar sources are not available. According to several stakeholders and literature, the addition of large amounts of wind and solar could require system operators to procure additional ancillary services— commitments from resources to increase or decrease their generation or consumption on short notice to better accommodate unexpected deviations in forecasted output—and invest in upgrades to the transmission system, including new transmission lines. Overall, according to a recent DOE report, wind variability has had a minimal and manageable effect on electricity reliability.49
• Power plant retirements: The retirement of coal, nuclear, and other power plants may require system operators to take additional actions to maintain reliability. As we found in 2012, in some cases, the
retirement of individual plants can contribute to reliability challenges.50
To address the retirement of power plants, system operators may need to rely on new power plants, utilize more costly existing power plants more often, or invest in upgrades to transmission lines to transfer power from other locations to areas where it is needed, among other things. These actions can take time to complete.51
49DOE, Wind Vision: A New Era for Wind Power in the United States,
DOE/G0-102015-4557(March 2015).
For example, according to documentation from ISO New England, up to 8,300 MW of older coal and oil-fueled power plants are considered at risk for retirement by 2020. Although coal and oil-fueled power plants generated only about 7 percent of electricity in ISO New England during 2014, these power plants play more significant roles in
generating electricity on peak demand days and have helped system operators maintain grid reliability during challenging periods such as
51In some cases, system operators can enter into contractual arrangements to keep a
power plant needed for reliability from retiring until solutions are in place to address related reliability concerns.
Effects of distributed generation on system operations to maintain reliability
The addition of distributed generation such as rooftop solar can present unique challenges that system operators must manage to maintain reliability. Several stakeholders told us that because distributed generation occurs behind a consumer’s meter, such as at an individual residence or business, changes in generation are not visible to or controllable by the system operator without the installation of specialized technology.
Regarding the lack of visibility, increases in distributed generation would be seen by the system operator as decreases in demand, since the electricity generated is used on-site and displaces electricity that would have been provided through the grid. Because system operators only see the net effect of these changes, it is more difficult for them to understand and predict demand. Regarding lack of control, if distributed generation results in more electricity than customers can use on site, electricity flows can exceed equipment technical
specifications, which could require equipment upgrades. Additionally, if there is more distributed generation than can be used by all customers, the imbalance of supply and demand could put the stability of the grid at risk.
Accommodating increased distributed generation may therefore require system operators to, among other things, use models to predict distributed generation patterns or install advanced controls to make distributed generation visible to and controllable by the utility in order to maintain electric reliability.
the polar vortex. According to ISO New England’s system plan, preserving the reliable operation of the system will become
increasingly challenging as a result of expected retirements, and the region is in a precarious position for the next several winters as retirements continue and actions to address retirements—such as investments in the addition of new transmission and power plants— are years away from completion.52
• Changes in electricity consumption. Changes in electricity
consumption may require system operators to take additional actions to maintain reliability both in the long and short-term. Over the long-term, system operators need to ensure they have sufficient generating and transmission capacity to meet forecasted consumer electricity needs. This means that a system operator may need to continually add more transmission or generation capacity when peak demand is rising, even if average consumption is stable or declining. In the short-term, system operators may need to take actions to increase or decrease the use of power plants and demand-response resources to address deviations between forecasted and actual consumption. According to NERC, the electricity industry faces several challenges in forecasting electricity consumption, because conservation
programs, distributed generation, and other changes in electricity consumption have increased the uncertainty of traditional forecasting methods used in long-term and short-term planning.
The degree to which system operators have had to take additional actions to maintain reliability in response to changes in generation and
consumption varies regionally based on the extent of these changes and other characteristics. For example, the extent to which system operators manage the grid in response to wind and solar growth will depend on factors such as the relative amount of generation from wind and solar power plants compared to traditional power plants, the size of a region’s grid and how interconnected it is with neighboring grids, and other factors. In this regard, representatives of Midcontinent Independent System Operator said they have been able to reliably accommodate larger amounts of wind generation without major operational challenges or the need for significant additional ancillary services because the large size of their grid and its extensive connections to neighboring grids provide a broad base of power plants that system operators can use to balance
variations in the output of wind power plants.53 In contrast, according to
literature we reviewed and representatives of the largest utility in Hawaii, while that state has been able to reliably integrate high levels of wind and solar, its isolated island grids means it has no neighboring grids to turn to for balancing variations in the output of wind and solar electricity
generation. Therefore, system operators there have fewer backup resources to turn to in the event of an unexpected change in wind and solar output than system operators managing larger, more integrated grids.
Changes in generation and consumption, together with associated actions system operators have taken to maintain reliability, have influenced consumer electricity prices in complex, interrelated, and sometimes contradictory ways, and the net effect of these changes on consumer prices is unclear, based on our review of literature and
discussions with stakeholders. National average real consumer electricity prices were nearly 11 percent higher in 2014 than 2001, but prices over this period fell in 5 years, rose in 6 years, and were relatively stable in 2 years (see fig.7). Prices and trends vary by consumer type and region. (App. V provides additional information on prices by consumer type and region.)
53The Midcontinent Independent System Operator is a regional transmission organization
that coordinates the markets and the movement of wholesale electricity. It operates in all or parts of the following U.S. states: Arkansas, Illinois, Indiana, Iowa, Kentucky, Louisiana, Michigan, Minnesota, Mississippi, Missouri, Montana, North Dakota, South Dakota, Texas, and Wisconsin.