CALIBRATING AND EVALUATING A RANGE CAMERA FOR
CULTURAL HERITAGE METRIC SURVEY
F. Rinaudo a*, F. Chiabrando a
a
DAD – Politecnico di Torino, Viale Mattioli 39, 10125 Torino – (fulvio.rinaudo, filiberto.chiabrando)@polito.it
KEY WORDS: Cultural Heritage, Modelling, Point Clouds, Close Range, Advancement
ABSTRACT:
At the last ISPRS Congress in 2008, the first experimental evaluations of range cameras were presented. During the last four years, much research has been done by different research groups and some meetings have allowed a continuous sharing of experiences and results. The research group of the Politecnico di Torino has developed some original methodologies for calibrating range cameras and a set of tests for evaluating the possible use of range cameras for Cultural Heritage metric surveys. Cultural Heritage objects are characterized by complex shapes and different materials (e.g. stones, plasters, etc.). The present paper describes the results achieved in calibrating the SR4000 range camera and it studies the influences of the measuring direction inclination and of the different materials on distance measurements accuracy and completeness. This allows defining which are the possible strategies to be adopted to give affordable and useful point clouds for the metric description of Cultural Heritage objects. Some basic metric survey examples of architectural objects are given to demonstrate the real application of such devices to Cultural Heritage metric documentation, from the acquisition of point clouds up to 2D (elevations) and 3D representations (texturized 3D models). Considering the current development of such devices and their possible future evolutions, the expected possible uses of range cameras in Cultural Heritage metric survey should be advantageous, especially considering the low costs of such devices and the possibility of their making 3D videos which can be acquired in a short time.
1. INTRODUCTION
In the last few years, a new generation of active sensors has been developed, which allow acquiring 3D point clouds without any scanning mechanism and from just one point of view at video frame rates. The working principle is the measurement of a signal emitted by the device towards the object to be observed, with the advantage of simultaneously measuring the distance information for each pixel of the camera sensor. These sensors are usually called ToF (Time Of Flight) cameras. There are two main approaches currently employed in ToF camera technology: one measures distances by means of direct measurement of the runtime of a travelled light pulse, using for instance arrays of Single-Photon Avalanche Diodes (SPADs) [Albota 2002, Rochas 2003] or an optical shutter technology [Gvili 2003]; the other method uses amplitude-modulated light and obtains distance information by measuring the phase shift between a reference signal and the reflected signal [Lange 1999]. The result is the possibility of acquiring distance measurements for each pixel at high speed and with accuracies up to about 1 cm. While ToF cameras based on phase shift measurement usually have a working range limited to 10-30 m, RIM (Range Imaging) cameras based on direct ToF measurement can measure distances up to 1500. Moreover, ToF cameras usually have a low resolution (no more than a few thousands of tens of pixels), small size, low cost, and a lower power consumption, compared to classical laser scanners. The accuracy is limited to about 1 cm in the best cases (actual phase shift commercial ToF cameras).
In the last few years, several papers have been published on the performance and calibration of ToF cameras, with different aims and applications [Lichti 2010, Boehm 2010].
In the following paragraphs the main calibrations needed to face a possible metric survey of Cultural Heritage objects are described based on the experiences developed by using one of
the most diffused ToF camera (Swiss-Ranger-4000).
The main problems by facing the metric survey of a Cultural Heritage objects (e.g. buildings, relics, freezes, etc.) are due to the always complex shapes of the details and of the different reflectivity properties of the materials.
After a short description of the used instrument, the main calibration procedures and results performed on incidence angles of the measuring direction and on different materials are described in terms of adopted procedures and obtained results. The last paragraphs show some possible applications on two small details of a Cultural heritage object (e.g. a frieze and a window) and the last paragraph explains some possible developments of the research suitable to solve more complex surveys by using ToF technology.
2. THE SR4000 TOF CAMERA
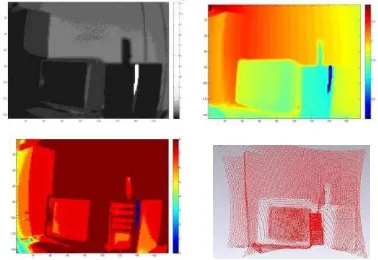
This camera has a 176 x 144 pixel array and a working range from 0.3 mm up to 5 m (see Table 1). This camera delivers a range image and an amplitude image at video frame rates: for each pixel, the range image contains the radial measured distance between the considered pixel and its projection on the object, while the amplitude image contains, for each pixel, the strength of the signal reflected by the object. A confidence map is also delivered, which contains information about the accuracy of the acquired data. Moreover, a 3D point cloud (with X, Y and Z coordinates referred to a local coordinate system fixed to the camera) is also delivered, which is equivalent to the 3D scan of classical laser scanning instruments, but with the advantage of real-time acquisition (see Figure 1).
2.1 Warm up time
Since semiconductor materials are highly responsive to
temperature changes, temperature variations within a ToF camera can affect its distance measurements. This problem could result from two different effects: self-induced heating caused by thermal losses of the camera electronics, and ambient temperature changes. While ambient temperature changes cannot be predicted and need to be measured at runtime, camera heating is predictable and can therefore be characterized. It can be proved that for a constant ambient temperature, the inner temperature increases in the first minutes after the device starts working and then should stabilize.
TECHNICAL SPECIFICATIONS
SR-4000
Focal length [mm] 10
Pixel array size [-] 176 (h) x 144 (v)
Pixel pitch [mm] 40
Field of view [°] 43.6 (h) x 34.6 (v)
Working range with
standard settings [m] 0.3-5.0
Repeatability (1σ)
[mm]
4 (typical) - 7 (maximum) (@ 2 m working range and 100% target
reflectivity)
Absolute accuracy
[mm] ±10 (@ 100% target reflectivity
Frame rate [fps] up to 54 (depending on camera settings)
Table 1. SR4000 ToF camera specifications
Figure 1. Visualization of data acquired with SR-4000 camera: amplitude and range image (up, from left to right); confidence
map and 3D point cloud already corrected for lens distortion (manufacturer calibration) (bottom, from left to right)
In previous experiences of the authors (e.g. the calibration of the scanners) the inner temperature of electronic devices equipped with CCD arrays usually reach a stability after some time and the geometric deformations increase in an irregular way until the inner temperature reach a stable value.
The same effect was noticed as far as the distances measured by the SR-4000 camera. In order to define the camera warm up time needed to achieve distance measurement stability, the room temperature was kept constant (20°C) and the distance measurements were analysed for two hours of camera operation. The SR-4000 camera was set up on a photographic tripod, with the front of the camera parallel to a white wall. After turning on the camera, five consecutive frames were acquired every five minutes for two hours. The test was carried out at several distances . Data were acquired using the “auto acquisition time”
suggested by the SR_3D_View software delivered with the camera in order to avoid pixel saturation and to achieve a good balance between noise and high frame rate.
In all cases, the five frames (range images) acquired at each time were averaged, pixel by pixel, in order to reduce the measurement noise.
The variations of the averaged distances during two hours of camera operation are given in Figure 2 and Figure 3 respectively. In all cases a central sub-image of 84 × 96 pixels was considered in order to avoid border effects.
As can be observed from Figures 2 and 3, both the mean and the standard deviation of the distance measurements vary during the operating time: a maximum variation of about 6 mm was detected for the mean, while a maximum variation of about 3 mm was estimated for its standard deviation.
Figure 2. Relative variation of the mean value of averaged range images during the working time of several tests for the SR-4000
Figure 3. Relative variation of the standard deviation of averaged range images during the working time of several tests
for the SR-4000
Since the calculated variations are nearly constant after 40 minutes of camera operation, a warm up period of 40 minutes has been judged sufficient to achieve a good measurement stability of the SR-4000 camera. For this reason, all the following tests were performed after this warm up period of the camera.
2.2 Integration time
The other fundamental measurement parameter is the integration time (I.T.), which represents the length of time that the pixels are allowed to collect light. This parameter has several influences on the distance measurements. In particular, an increasing of the I.T. (maintaining all other factors constant, such as distance to the object, object reflectivity, room temperature, modulation frequency, angle of incidence…) leads to the following effects: a better Signal to Noise Ratio (SNR) and, consequently, more precise data;since the amplitude of the
reflected signal increases, the pixel saturation level is reached faster compared to the same object’s reflectivity and a lower I.T.; since more time is requested to acquire a single frame, the data acquisition speed (frame rate) decreases; the discrepancy between real distance and measured distance may show little variations changing the integration time: an increasing I.T. usually leads to slightly measured distances; since the illumination unit (e.g. LEDs) has to be on for longer periods, more heat is created in the system, which may influence the distance measurements stability.
In order to estimate the influence of the I.T. on the precision of the measured distances the SR-4000 camera was positioned on a photographic tripod, parallel to a white wall. Then, 100 frames were acquired for several I.T. values.
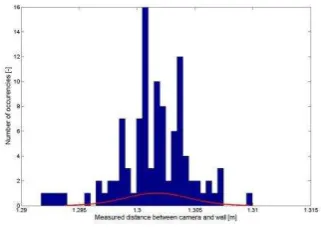
Figure 4 shows an histogram of the 100 distance measurements performed by the central pixel with an I.T. of 11 ms for an approximate distance of 1.30 m between camera and wall. Figure 4 shows that the distance measurements of a single pixel comply with a Gaussian distribution. The maximum of the distribution is very close to the approximate distance between the camera and the wall. In order to compare the data acquired with different I.T., the following terms were estimated: the mean value of the estimated standard deviations (m) for all the pixels; the mean value of the range image (averaged over 100 frames) (mDm) and its standard deviation (stdDm); the mean value of the amplitude image (averaged over 100 frames) (mAm) and the mean value of the confidence map (averaged over 100 frames) (mAm).
Figure 4. Histogram of the 100 distance measurements performed by the central pixel of the SR-4000 camera with an integration time of 11 ms (approximate distance camera–wall:
1.30 m)
Table 2. Results for the SR-4000 camera acquisition at 1.3 m of distance, where, mis the mean of the estimated standard deviations for all the pixels, mDm and stdDm are, respectively, the
mean and standard deviation of the range image, mAm is the mean of the amplitude image, and mCm is the mean of the
confidence map
As can be seen from Table 2 with data acquired by using the auto acquisition time (the one suggested by the acquisition manager software) the following results were obtained: the lowest mean value of the pixel standard deviations (m) without saturated pixels, a null or negligible number of saturated pixels, and a less noisy distribution of the distance measurements over the acquired area of the wall. The variations of the mean value of the measured distances (mDm) considering different I.T. are very small, limited to some millimeters when only a few saturated pixels appear. For these reasons, the auto acquisition time will has to be adopted during data acquisition with the SR-4000 camera instead of adjusting it manually.
Figure 5 gives a 3D representation of the i term for each pixel for the whole sensor, and the amplitude image (averaged over 100 frames).
(a) (b)
Figure 5. SR-4000 (a)i over the whole sensor, and (b) amplitude image for data acquired with the auto acquisition
time (distance camera–wall: 1.30 m; I.T. 11 ms)
This test shows how important is the relation between the strength of the reflected signal and the precision of the distance measurement. The results show that the auto acquisition time suggested by the SR_3D_View software completely adheres to this principle.
2.3 Distance measurement calibration
In order to evaluate the presence of systematic distance measurement errors of the SR-4000 camera, it was positioned parallel to a vertical plywood panel. The distance between the camera front and the panel was accurately measured using two parallel metal tape-measures.
A Mensi S10 (which acquired about 780,000 points with sub-millimetric precision) based survey of the plywood was performed in order to create a detailed model of the panel. After the camera warm up, the panel was positioned each 5 cm in the 0.50 ÷ 4.50 m distance range between the camera and the plywood. Thirty consecutive frames were acquired for each position, using the “auto acquisition time”. The variation of the mean values of the discrepancies of all the considered pixels according to the mean measured distance is given in Figure 7 (see green line) As can be observed from this figure, the discrepancies between the measured distance and the real distance attain a maximum value of 0.011 m and a minimum value of −0.008 mm.
However a systematic trend (similar to a sinusoidal wave) of the measurement errors still remains which needs to be corrected. These measurement errors (discrepancies) have been modeled with a distance error model which simulate the sinusoidal
frequency, λ3 = phase shift).
(a) (b)
Figure 6. (a) Data acquisition with the SR-4000 camera (b) Laser scanner survey of the plywood panel with Mensi S10
As shown in Figure 7, the proposed distance error (blue line) model fits well the distance measurement errors, apart from distances smaller than 0.7 m and larger than 3.7 m. The parameter values have been estimated by minimization of the square root of the squared differences between the experimental data and the distance error model function.
Figure 7. Variation of the mean values of the discrepancies (green line) according to the mean distance and distance error
model (blue line)
2.4 Angle of incidence
The signal emitted by the camera impinges the observed object with an angle which depends on the camera orientation with respect to the normal of the object surfaces. If the amount of energy emitted by the camera illumination unit, the object reflectivity, and the mean distance between camera and object are considered constant, the precision of the distance measurements will decrease when increasing the incidence angle. This problem is of extreme importance in case of Cultural Heritage objects where complex shapes are always present in an unpredictable way and the location of the camera cannot be forced in order to avoid this kind of systematic effects.
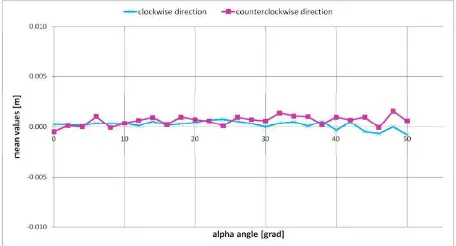
In order to evaluate the influence of the α angle on the precision of the distance measurements the SR-4000 camera was positioned on a photographic tripod, with the camera front parallel to a flat panel, which was fixed to a Leica TS; the panel was covered with a white sheet, in order to have a surface with homogeneous reflectivity. After the camera warm up, using the Leica TS, the panel was accurately rotated each two grads in the 0÷50 grad rotation interval. Fifty consecutive frames were acquired for each panel position.
Figure 8 shows that the mean value of the differences between the measured plane and the SR-4000 distance measurements have small fluctuations around the zero value according to the α angle: these small fluctuations are limited to about 2 mm in
both directions. In conclusion, adopting the “auto acquisition time” for data acquisition, there is no appreciable variation of the distance measurement precision for camera orientations included within the considered α angle interval.
Figure 8. Mean values of the differences between range image and estimated reference plane
2.5 Object reflectivity
Cultural heritage objects are usually realized by using different materials (e.g. stones, plasters, bricks, etc.) each of one being characterized by different reflectivity properties which can influence the precision of the distance measurements. The distance measurement standard deviation is in inverse proportion to the amplitude of the signal reflected by the object, which in turn depends on the object’s reflectivity with respect to the camera’s emitted signal when all other parameters (I.T., distance between camera and object, background illumination, angle of incidence) are fixed as constants.
Table 3. Results for data acquired with the “A.T. ref.” (1.799 m), where mdiffand σdiff are the mean and the standard deviation
of the estimated differences, msdis the mean precision, mamplis the mean of the amplitude image, %satis the percentage of saturated pixels in the area of analysis, and r is the relative
reflectivity
The tested materials have been chosen from among common materials which could be found in the case of both indoor scene reconstructions and architectural element surveys, since these are the fields with the main interest for the topic of this paper. For each material, fifty frames were acquired with two different acquisition times, and then averaged in order to reduce the measurement noise. This procedure was repeated for several taking distances, ranging from 1.30 m to 1.80 m, moving the camera with respect to the objects. The camera positions and the object surface positions were estimated in an arbitrary coordinate system. In the following, only the data acquisition
and processing details relative to a distance of 1.799 m between camera and system are given. For each material the fifty frames were acquired twice, with different acquisition times: “A.T. auto” and “A.T. ref.”, which corresponds to the auto acquisition time for “Kodak R27 grey card”, that was adopted as the reference acquisition time for the considered distance. For each of the materials used, the differences between the estimated plane and the camera distance measurements were estimated. The means (mdiff) and standard deviations (σdiff) of the differences are given in Table 3.
Finally, the obtained results show that the SR-4000 camera is quite insensitive to different object reflectivities, since both the estimated measurement accuracy and precision are on the order of the values declared by the camera manufacturer.
Nevertheless, some problems of pixel saturation and high noise have been observed for three materials, which are probably related to very different reflectivity of the grains which constitute those materials.
3. CULTURAL HERITAGE METRIC SURVEY TESTS
By considering the achieved results in terms of influence of the main factors which can affect the use of a ToF camera for Cultural heritage objects, some data of an architectural frieze were acquired with the SR-4000 camera in an indoor environment and then compared with LiDAR data acquired from the same object. The object to be surveyed was positioned on a table, in front of the SR-4000 camera at a medium distance of two meters (Figure 9). Seven cubic targets covered with a white sheet were distributed around the object to be surveyed in order to have reference points to be used for comparing the ToF camera data with other data coming from LiDAR devices in the same coordinate system. Fifty frames were acquired with the SR-4000 camera and then averaged in order to reduce the measurement noise. Furthermore, both the Mensi S10 and the Riegl LMS-Z420 laser scanners were employed to acquire data to be compared with the SR-4000 data (Figure 9). In both cases, the point clouds were acquired with a step of 2 mm.
Figure 9. Data acquisition for an architectural frieze
In the case of the SR-4000, the distance measurements was corrected with the proposed distance calibration model: in the previous paragraphs it was demonstrated that no other calibration are needed if the 40 minutes warming-up is used as a standard procedure to stabilize the acquisition system. Since the Mensi S10 laser scanner has sub-millimetric accuracy, these data were used as a reference for the estimation of the SR-4000 accuracy on real objects. Therefore, the discrepancy between the distance of the corresponding point on the Mensi S10 data and the distance measured by each pixel of the SR-4000 camera was calculated after averaging over 50 frames.
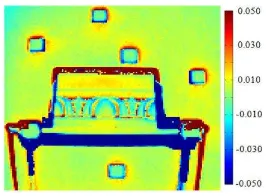
Figure 10 shows that the estimated discrepancies vary considering objects which are at different distances from the camera: the error function depends on the distance between the camera and the object. Since the SR-4000 data and the Mensi S10 data were acquired from slightly different viewpoints, the
blue areas show high values of the difference, which are wrong because they are related to occluded points. Moreover, the red areas contain high values of the differences, which are related to the mixed pixels, which degrades greatly the data acquired on the borders of the object.
Figure 10. Discrepancies (m) between distances obtained from the Mensi S10 points and the SR-4000 original point cloud
The mean value of the discrepancies considering the original ToF data is of about 6 mm, while after applying the proposed distance calibration model, the mean value of the discrepancies becomes 1 mm (Figure 11). Since the standard deviation of the estimated discrepancies is 11 mm in both cases, it is possible to state also from an experimental point of view, that, after applying the proposed calibration model to the measured distances, the SR-4000 camera is able to produce more accurate measurements with a precision that is close to the manufacturer’s technical specifications.
The discrepancies between the Riegl laser scanner points and the ToF point cloud were estimated too, even if the measurement accuracy of the Riegl LMS-Z420 laser scanner is worse than that of the Mensi S10: the results are practically identical to the previous ones.
Finally, the Riegl points have been compared with the Mensi data. A procedure similar to the previous one was adopted: the discrepancies between the Mensi data and the Riegl LMS-Z420 data in the direction orthogonal to the surveyed frieze were estimated.
As shown in Figure 11, values of the discrepancies of about ± 15 mm have been obtained also in the flat areas of the frieze. Nevertheless, the mean and standard deviation of the discrepancies are -2 mm and 9 mm, respectively.
Figure 11. Discrepancies for the frieze: between distances obtained from Mensi S10 and SR-4000 before (top left), and
after (bottom left) distance correction; between Mensi and Riegl LMS-Z420 (right)
The obtained results show that SR-4000 distance measurements after frame averaging and distance correction have practically the same accuracy of the Riegl LMS-Z420. However, considering only one static position for acquiring data the Riegl LMS-Z420 allows acquiring point clouds which are denser than those of the SR-4000 but also noisier even if filtering techniques with commercial software are applied. The results
demonstrate the validity of the proposed distance calibration model and the great potential of ToF cameras for Cultural Heritage metric survey purposes.
In order to show an example of the application of ToF cameras to Cultural Heritage documentation for more complex objects (e.g. made of different materials and larger than the one showed before), some results are given in Figure 12.
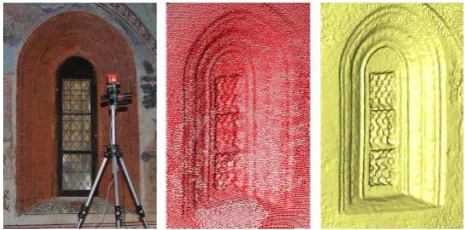
A window of the Church of S. Giorgio in Valperga (Italy) was surveyed with the SR-4000 camera from three different points of view.
After averaging the acquired frames and applying the proposed distance error model, a 3D point cloud (Figure 12 centre) was obtained with manual registration. The final 3D model of the window can be used for several purposes, such as documentation, geometric measurements, and also the generation of 2D drawings.
Figure 12. Window of the San Giorgio in Valperga (Italy): data acquisition with SR-4000 camera (left), 3D point cloud after
manual registration (centre), and final 3D model (right)
4. CONCLUSIONS
SR-4000 ToF camera is able to carry out today’s metric 3D surveys of small objects with an accuracy which satisfies all the major needs of Cultural Heritage metric documentation. The proposed distance calibration model provides this device with the same accuracy (or even better) than that obtainable by using modern laser scanner devices. Small objects that can be described by using a static taking position approach can be surveyed by SR-4000 ToF cameras with a reduced cost: the cost of the instrument is less than 1/10 that of other methods, and the practical management of the primary data acquisition is also made easier thanks to the limited size and weight of a ToF camera. The efficiency of the ICP algorithms and the possibility of automatically recognizing control points materialized on the object by using the amplitude images allows one to consider also useful applications to medium sized objects (e.g., rooms and statues).
In the future, ad hoc studies on the possibility of using the ToF camera as a video device able to reconstruct a 3D panorama will open new and interesting application fields for these instruments.
Also the possibility to increase the taking distance, and the sensor resolutions will open new possibilities for point cloud generation that among the ones generated by using digital photogrammetric automatic approaches and traditional terrestrial laser scanner systems will contribute to the new trends in Cultural Heritage documentation which are moving towards a not intelligent acquisition of objective metric information (e.g. point clouds) from where the surveyors can insert the needed intelligence to realize 3D models in the post
processing phases.
A last dream for ToF cameras is the possibility to acquired not only the distances for each pixel of the sensor but also the RGB information that in this case will be directly connected to the same coordinate system without any orientation procedure or calibration of different sensors.
References
Albota, M.A., Heinrichs, R.M., Kocher, D.G., Fouche, D.G., Player, B.E., Obrien, M.E., Aull, G.F., Zayhowski, J.J., Mooney, J., Willard, B.C., Carlson, R.R. Three-dimensional imaging laser radar with a photon-counting avalanche photodiode array and microchip laser. Appl. Opt. 2002, 41, 7671–7678.
Boehm, J., Pattinson, T. Accuracy of exterior orientation for a range camera. In Proceedings of ISPRS Archives, Newcastle Upon Tyne, UK, 2010, Volume XXXVIII, part B5, 103-108. Chiabrando, F., Chiabrando, R., Piatti, D., Rinaudo, F. Sensors for 3D imaging: Metric evaluation and calibration of a CCD/CMOS time-of-flight camera. Sensors 2009, 9, 10080– 10096.
Gvili, R., Kaplan, A., Ofek E., Yahav, G. Depth keying,
Proceedings of SPIE Electronic Imaging, vol. 5249, 2003, pp. 534–545.
Kahlmann, T., Remondino F., Ingensand, H. Calibration for increased accuracy of the range imaging camera SwissRanger.
International Archives of Photogrammetry, Remote Sensing and Spatial Information Sciences 2006, XXXVI, 136–141.
Kim, Y.M., Chan, D., Theobalt, C., Thrun, S. Design and calibration of a multi-view TOF sensor fusion system. IEEE CVPR Workshop on Time-of-flight Computer Vision 2008, 1–7.
Klose, R., Penlington, J., Ruckelshausen, A. Usability study of 3D time-of-flight cameras for automatic plant phenotyping. In
Image Analysis for Agricultural Products and Purposes 2009,
69, 93–105.
Lange, R. Time-of-Flight range imaging with a custom solid-state image sensor. In Proceedings of SPIE, Munich, Germany, 1999, Vol. 3823, pp. 180-191.
Lichti, D. Self-Calibration of a 3D range camera. International Archives of Photogrammetry, Remote Sensing and Spatial Information Sciences 2008, XXXVII, part B5, 927–932. Lichti, D., Kim, C., Jamtsho, S. An integrated bundle adjustment approach to range camera geometric self-calibration.
Journal of Photogrammetry and Remote Sensing 2010, 65, 360–368.
Ollikkala Arttu, V.H., Mäkynen, A.J. Range imaging using a time-of-flight 3D camera and a cooperative object. IEEE Conference on Instrumentation and Measurement Technology
2009,817–821.
Piatti D. Time-of-Flight cameras: tests, calibration and multi-frame registration for automatic 3D object reconstruction. Ph. D. thesis – Politecnico di Torino – 2011 (tutor Rinaudo F.)
Rochas, A., Gösch, M., Serov A., Besse, P.A., Popovic, R.S. First fully integrated 2-D array of single-photon detectors in standard CMOS technology. IEEE Photonic. Technol. Lett. 2003, 15, 963–965.
Weyer, C.A., Bae, K., Lim, K., Lichti, D. Extensive metric performance evaluation of a 3D range camera. International Archives of Photogrammetry, Remote Sensing and Spatial Information Sciences 2008, XXXVII, 939–944.