FINANCIAL RESULTS
FOR YEAR 2002
PERFORMANCE SUMMARY
Contents
Page
Financial Highlights 2
Financial Review 4
Net Interest Income and Net Interest Margin 6
Non-Interest Income 7
Operating Expenses 8
Provisions Charge 8
Taxation 9
Asset Quality 9
Balance Sheet 10
Customer Deposits 11
Customer Loans 11
Capital Adequacy Ratio 12
Unrealised Valuation Surpluses 12
Geographical Segment Analysis 13
Business Segment Analysis 14
APPENDIX I: Audited Consolidated Profit And Loss Account APPENDIX II: Audited Consolidated Balance Sheet
APPENDIX III: Audited Consolidated Cash Flow Statement
APPENDIX IV: Audited Statements of Changes in Shareholders’ Equity APPENDIX V: Notes to the Accounts – Selected
1. Goodwill
2. Earnings Per Ordinary Share 3. Income Tax and Deferred Taxation 4. Subordinated Term Debts
5. Financial Derivatives
6. Daily Earnings at Risk And Trading Income
7. Exposures To Malaysia, Indonesia, Thailand, Korea, The Philippines (Regional Countries), Hong Kong And China
Financial Highlights
DBS prepares its financial statements in accordance with Singapore Statements of Accounting Standard (“SAS”).
expenses 4,066 3,532 1,048 983 966
Operating profit before provisions 1,937 1,670 504 462 380
Net profit before tax 1,448 1,361 329 324 308
Net profit attributable to members 1,017 997 282 199 167 Net profit attributable to members
(excluding goodwill
amortisation) 1,295 1,130 355 268 237
At period-end
Shareholders' funds 14,445 13,613 14,445 14,089 13,613 Interest bearing assets 127,529 131,516 127,529 129,086 131,516 Customer loans 60,709 68,208 60,709 63,442 68,208 Customer deposits 101,315 106,771 101,315 100,419 106,771 Total assets 149,375 151,462 149,375 148,117 151,462
S$ S$ S$ S$ S$
Per share
Basic earnings excluding
goodwill amortisation 2/ 0.87 0.89 0.95 0.72 0.69
Basic earnings 2/ 0.68 0.78 0.75 0.53 0.59
Diluted earnings 2/ 0.66 0.74 0.73 0.51 0.57
Dividend 0.30 0.30 0.16 - 0.16
Net asset value at period-end 9.45 8.98 9.45 9.20 8.98
Performance ratios
Return on assets 2/ 0.68 0.76 0.76 0.53 0.55
Return on equity 2/ 7.23 8.81 7.91 5.66 6.49
Excluding goodwill amortisation
Return on assets 2/ 0.86 0.86 0.95 0.71 0.64
Return on equity 2/ 9.21 9.99 9.95 7.62 7.56
Efficiency and revenue mix ratios
Cost-to-income ratio (excluding
goodwill amortisation) 45.5 48.9 45.0 46.0 53.4 As a percentage of total
operating income:
- net interest income 65.1 63.9 61.3 68.2 73.2
- non-interest income 34.9 36.1 38.7 31.8 26.8
BIS Capital ratios (at period-end)
- Tier 1 capital 10.3 12.2 10.33/ 13.73/ 12.2
- Total capital 15.5 17.4 15.5 19.0 17.4
Notes:
1/ Figures for Year 2001 have been restated to reflect the adoption of Statement of Accounting Standard 12 “Income Taxes”. Details of which are set out in Appendix V Note 3.
2/ Earnings per share, return on assets and return on equity for the Quarters are annualised.
Adoption of New Accounting Standard
Effective for financial periods beginning on or after April 1, 2001, companies in Singapore are required to adopt the revised Statement of Accounting Standard (“SAS”) 12 on Income Taxes. As a result, DBS Group Holdings and its subsidiary companies (“DBSH Group”) have applied the revised Standard in the preparation of the Group financial statements. The impact on the Group financial statements is summarised in Appendix V Note 3.
The comparative figures for Year 2001 have been restated accordingly to conform with SAS 12.
Consolidation of Dao Heng Bank Group Limited (“DHG”)
On January 10, 2003, DBS Bank exercised its Call Option on the minority shareholders of DBS Diamond Holdings Ltd (“DDH”) to acquire approximately 28.4% of the remaining issued share capital of DDH. DDH owns 100% of Dao Heng Bank Group Limited (“DHG”). Each outstanding DDH share was acquired at call option price of HK$ 21.70 per share in cash.
Financial Review
Financial results of Dao Heng Bank Group Limited (“DHG”) and DBS Vickers Securities Holdings Pte Ltd (“DBSV”) were consolidated from June 29, 2001 and September 12, 2001 respectively. Consequently, the Group’s financial results had the full year impact of the acquisitions in Year 2002. The consolidation of Group Profit & Loss Statement is based on ownership interest of 71.6% for DDH (See note above on Consolidation of DHG) and 59.5% for DBSV.
DBSH Group’s operating profit before goodwill amortisation and provisions increased by 22.9% to S$2,215 million in Year 2002 over 2001 contributed by higher net interest income and fee and commission income. However, due to the higher goodwill amortisation (full year impact) and provision charge (reflecting the uncertain economic environment and a soft property market), net profit attributable to members (“NPAM”) increased by 1.9% to S$1,017 million. Cost-to-income ratio (excluding goodwill amortisation) improved to 45.5% compared to 48.9% for Year 2001.
Compared to third quarter 2002 (“3rd Qtr 2002”), fourth quarter 2002 (“4th Qtr 2002”) operating profit before goodwill amortisation and provisions increased by 8.5% to S$577 million. Gain of S$96 million on sale of shares in NatSteel Ltd was received in 4th Qtr 2002. Tax charges were lower in 4th Qtr 2002 and this had partially contributed to the 41.6% increase in NPAM to S$282 million. Cost-to-income ratio (excluding goodwill amortisation) decreased from 46.0% in 3rd Qtr 2002 to 45.0% in 4th Qtr 2002.
Financial Performance Summary
S$'m Year
2002
Year 2001
4th Qtr 2002
3rd Qtr 2002
4th Qtr 2001
Profit and Loss Account
Net interest income 2,645 2,257 642 671 707
Non-interest income 1,421 1,275 406 312 259
Income before operating expenses 4,066 3,532 1,048 983 966
Operating expenses (1,851) (1,729) (471) (452) (516)
Operating profit before goodwill
amortisation and provisions 2,215 1,803 577 531 450
Goodwill amortisation (278) (133) (73) (69) (70)
Operating profit before provisions 1,937 1,670 504 462 380
Provisions (534) (379) (181) (150) (87)
Operating profit 1,403 1,291 323 312 293
Share of profit and loss of associates 45 70 6 12 15
Net profit before taxation 1,448 1,361 329 324 308
Taxation (298) (266) (20) (93) (83)
Minority interests (133) (98) (27) (32) (58)
Net profit attributable to members 1,017 997 282 199 167
NPAM excluding goodwill amortisation 1,295 1,130 355 268 237
Note:
Contributions from Dao Heng Bank Group Limited (“DHG”)
DHG’s operating profit before provision for Year 2002 showed an increase of 115.3%. Financial result of DHG was consolidated from June 29, 2001. As a result, Year 2001 financial results reflect DHG’s contribution for six months.
DHG’s operating profit for 4th Qtr 2002 was lower by 39.8% compared to the previous quarter due to higher provision charge. The provision charge was higher in the 4th Qtr 2002 due primarily to loan-related provisions.
Financial Performance Summary
S$'m Year
2002
Year 2001
4th Qtr 2002 #
3rd Qtr 2002 #
4th Qtr 2001 #
Profit and Loss Account
Net interest income 622 321 151 157 171
Non-interest income 231 126 60 60 57
Income before operating expenses 853 446 210 218 228
Operating expenses (375) (224) (96) (92) (124)
Operating profit before provisions 478 222 114 125 104
Provisions (185) (22) (52) (22) 2
Operating profit 293 200 62 103 106
Net profit before taxation 294 203 61 102 105
Net profit after taxation 272 208 84 88 124
Notes:
1/ Appropriate adjustments have been made to Dao Heng Bank Group Limited accounts to bring them in line with the Singapore Statements of Accounting Standard (“SAS”).
Exhibit 1
Group Net Interest Income and Net Interest Margin
2 ,0 3 5 2 ,0 3 9 2 ,2 5 7
Net Interest Income and Net Interest Margin
Net interest income for Year 2002 increased by 17.2% to S$2,645 million. The increase was due primarily to the inclusion of DHG’s full year net interest income compared to six months in Year 2001. Excluding DHG, net interest income was 5.3% higher than Year 2001.
Compared with 3rd Qtr 2002, net interest income decreased by 4.3% to S$642 million due to re-pricing of housing loans, flatter S$ interbank yield curve and as a result, reduced benefits from deployment of net free funds.
Net interest margin was 1.99% for Year 2002, an improvement of 12 basis points over same period last year reflecting the benefit of lower funding costs.
For the quarter, net interest margin was 1.97% compared to 2.00% for third quarter 2002, due to highly competitive market conditions and intense interest margin pressure for both mortgage and corporate loans.
Table 1
Group Net Interest Income and Net Interest Margin
S$’m Year 2002 Year 2001
Net interest income 2,645 2,257 Average interest bearing
assets 132,651 120,656
Gross interest yield (%) 3.32 4.37 Net interest spread (%) 1/ 1.89 1.74 Net interest margin (%) 2/ 1.99 1.87
S$’m
Net interest income 642 671 707 Average interest bearing
assets 128,506 132,621 132,765 Gross interest yield (%) 3.18 3.26 4.21 Net interest spread (%) 1/ 1.89 1.90 2.02 Net interest margin (%) 2/ 1.97 2.00 2.11
Notes:
1/ Net interest spread is the difference between the average interest rate earned on average interest-earning assets and the average interest rate paid on average interest-bearing funds. 2/ Net interest margin is net interest income expressed as a
Table 2
Fee and commission income 797 626
Stockbroking 126 73
Investment banking 72 72
Trade and remittances 111 96
Loan related 138 110
Deposit related 109 100
Credit card 95 69
Fund management 35 20
Wealth management 77 65
Others 34 21
Dividend and rental income 61 63
Other income 563 586
Net gains on foreign exchange,
securities and derivatives 307 324 Singapore government securities 103 80
Equities 100 (1)
Disposal of investment securities 18 130 Disposal of fixed assets 10 22
Others 25 31
Total 1,421 1,275
Non-interest income as a percentage
of Operating income (%) 34.9 36.1
Fee and commission income 191 201 207
Stockbroking 20 24 42
Investment banking 22 19 18 Trade and remittances 27 28 32
Loan related 39 41 32
Deposit related 27 28 27
Credit card 22 24 24
Fund management 9 5 6
Wealth management 13 20 21
Others 12 12 5
Dividend and rental income 13 17 8
Other income 203 95 44
Net gains on foreign exchange,
securities and derivatives 77 57 25 Singapore government securities 17 39 2
Equities 98 (14) 18
Disposal of investment securities (1) 7 (4) Disposal of fixed assets 5 1 (3)
Others 7 5 6
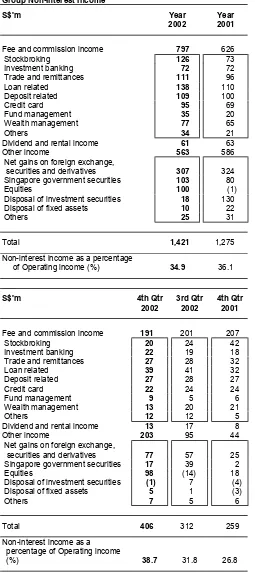
Non-Interest Income
Fee and commission income increased by 27.3%. The increase was partially driven by the full year contributions from DHG and DBSV. Excluding the contributions from these acquisitions, fee and commission was 10.3% higher than Year 2001. The increase was due mainly to fees received from fund management, credit card operations and loan related fees.
Compared to 3rd Qtr 2002, fee and commission income was 5.0% lower in the fourth quarter. The decline in stockbroking and wealth management fees over the previous quarter was due to the less favourable conditions in the equity markets.
Other income for Year 2002 decreased 3.8%. Higher profits from sales of shares were included in Year 2001 compared to Year 2002. Profits of S$181 million from the sale of shares in The Insurance Corporation of Singapore Limited and Keppel Capital Holdings Limited and profit of S$96 million from sale of shares in NatSteel Ltd were included in Year 2001 and Year 2002 respectively.
Table 3
DBSV/DBS Securities Group 162 91 Restructuring and integration
Staff Head Count Number (at
year-end) 12,035 13,536
Staff costs 226 219 232
Occupancy expenses 58 55 68
Technology-related expenses 66 58 75
Others 112 117 101 Staff Head Count Number (at
period-end) 12,035 12,510 13,536
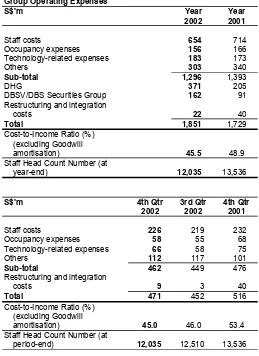
Operating Expenses
Excluding operating expenses of DHG and DBSV, goodwill amortisation and restructuring and integration costs, Year 2002 operating expenses declined 7.0% over the same period in Year 2001.
Staff costs were 8.4% lower as a result of a 11.1% headcount reduction that arose from rationalisation of workflow and businesses. Other operating expenses also declined as a result of the implementation of cost management initiatives. Last year’s divestment of the Group’s stake in former subsidiaries, The Insurance Corporation of Singapore Limited and DBS Bank Philippines Inc., also resulted in lower costs as their operating expenses have been excluded. The Group’s cost-to-income ratio (excluding goodwill amortisation) was 45.5% for Year 2002 compared with 48.9% for the same period in Year 2001. Compared to 3rd Qtr 2002, fourth quarter operating expenses (excluding goodwill amortisation) was 4.4% higher. The increase was contributed by expenses incurred for restructuring exercise and one–time write off of assets related to discontinued projects. Cost-to-income ratio
Specific Provision 575 446 176 159 96
General Provision (41) (67) 5 (9) (10)
Total 534 379 181 150 87
Provisions Charge
Provision charge was S$534 million for Year 2002. Approximately 33% of the total charge was due to valuation shortfall for properties as well as equity investments held by the Group.
Taxation
DBSH Group's tax expenses were lower in 4th Qtr 2002. This was partially accounted for by the adoption of SAS 12, which requires deferred tax to be recognised on all temporary differences with certain limited exceptions.
4,4114,834 4,577 4,512 4,503 4,360
4,155
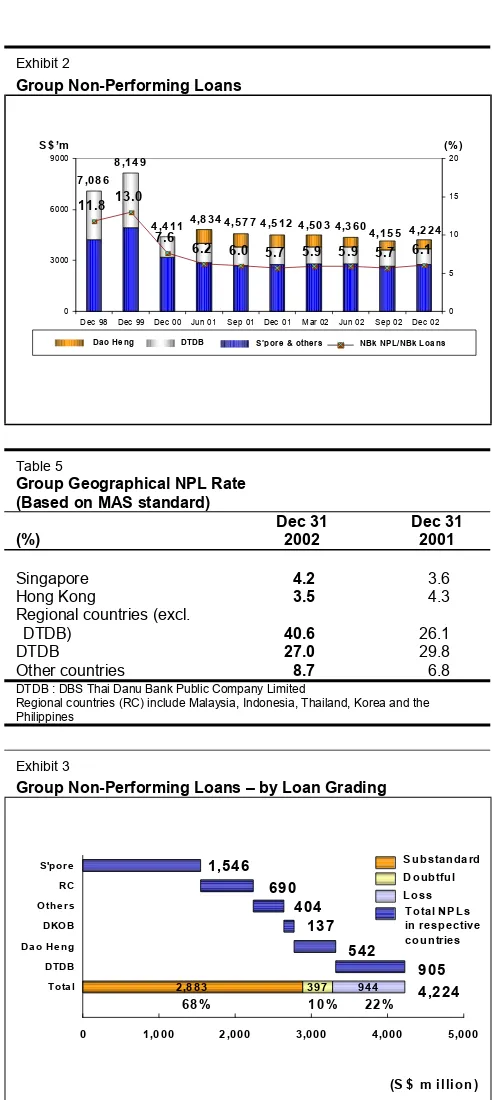
DTDB : DBS Thai Danu Bank Public Company Limited
Regional countries (RC) include Malaysia, Indonesia, Thailand, Korea and the Philippines
Exhibit 3
Group Non-Performing Loans – by Loan Grading
DKO B
The volume of non-performing loans (“NPLs”) was S$4.2 billion at the end of December 2002. This includes S$1.5 billion of restructured NPLs. (A loan is considered restructured when concessions are granted to the original terms of the loan for reasons that related to the financial difficulties of the borrower).
The ratio of NPLs to the total non-bank loans (“NPL rate”) increased from 5.7% at the end of September 2002 to 6.1% as at the end of December 2002 due mainly to higher NPLs and a lower non-bank loan base. If the loan base had remained unchanged, the NPL rate would have been 5.9%.
The NPL rate for Hong Kong operations was 3.5% at the end of December 2002. Our Hong Kong credit card business recorded a 1.16% loan delinquent rate for 90 days past due. The net charge-off rate rose to 11.6%, reflecting the higher unemployment rate and increases in personal bankruptcy filings.
Of the total S$4.2 billion NPLs as at the end of December 2002, 68% were in the substandard category, 10% in the doubtful category and the remaining 22% in the loss category.
Exhibit 4
Group Cumulative Specific and General Provisions
102.7118.4 129.9
146.5 143.9 142.5
132 129.2 124.8 120.7
44.4 52.6 51.8 54.7 58.7 60.3 60.4 60.4 61.0 59.2 0
1000 2000 3000 4000 5000
Dec 98 Dec 99 Dec 00 Jun 01 Sep 01 Dec 01 Mar 02 Jun 02 Sep 02 Dec 02 S$'m
0 100 200 300 (%)
SP GP SP+GP/Unsecured NPLs SP+GP/NPLs
3,147 4,286
2,286
2,687
2,643 2,719 2,721 2,633 2,533 2,500
Cumulative Specific and General Provisions
Total cumulative specific and general provisions at the end of December 2002 was 120.7% of unsecured NPLs, and 59.2% of total NPLs (or 61.2% of total NPLs of S$4,081 million under US SEC guidelines).
Table 6
Group Key Balance Sheet Items
S$'m Dec 31
2002
Dec 31 2001 Total Assets 149,375 151,462 Interest Bearing Assets 127,529 131,516 Customer Loans 60,709 68,208 Customer Deposits 101,315 106,771 Loan-to-Deposit Ratio
(%) 59.9 63.9
Balance Sheet
At the end of 2002, total assets was S$149.4 billion. Customer loans decreased by 11.0% to S$60.7 billion, due mainly to the low loan demand in a highly competitive environment. Customer deposits decreased by 5.1% to S$101.3 billion. The Group’s loan-to-deposit ratio at the end of 2002 was 59.9%.
Note:
1/ Figures for Year 2001 have been restated to reflect the adoption of Statement of Accounting Standard 12 “Income Taxes”. Details of which are set out in Appendix V Note 3.
Table 7
Customer Deposits
S$'m December 31 2002 December 31 2001
Analysed by Currency
Singapore dollar 53,655 55,137
US dollar 20,096 21,811
Hong Kong dollar 18,731 20,976
Thai Baht 3,164 3,242
Others 5,669 5,605
Total 101,315 106,771
Analysed by Product
Savings accounts (include S$ autosave) 43,047 43,750
Current accounts 8,975 9,577
Fixed deposits 46,026 52,338
Other deposits 3,267 1,106
Total 101,315 106,771
Table 8
Customer Loans
S$'m December 31 2002 December 31 2001
Gross 62,901 70,649
Less:
Specific provisions 1,288 1,422
General provisions 904 1,019
Net total 60,709 68,208
Including:
Bills receivable 1,574 1,530
Loans 59,135 66,678
Net total 60,709 68,208
Industry Breakdown
Manufacturing 5,856 6,383
Building and Construction 8,057 10,227
Housing Loans 21,910 24,407
General Commerce 5,707 5,253
Transportation, Storage and Communications 4,617 6,103 Financial Institutions, Investment and Holding Companies 3,626 4,096 Professionals and Private Individuals (except Housing Loans) 7,784 8,373
Others 5,344 5,807
Gross total 62,901 70,649
Analysed by Currency and Fixed / Variable Rates Fixed rate
Singapore dollar 8,359 12,370
Hong Kong dollar 460 778
US dollar 1 1
Thai Baht 862 941
Others 1 2
Sub-total 9,683 14,092
Variable rate
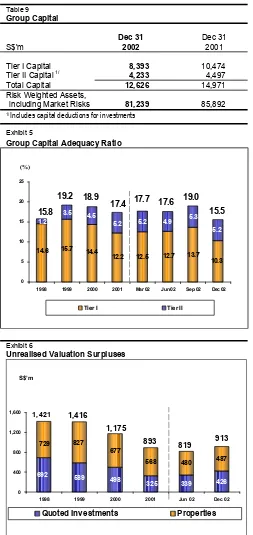
Table 9
Tier I Capital 8,393 10,474 Tier II Capital 1/ 4,233 4,497 Total Capital 12,626 14,971 Risk Weighted Assets,
including Market Risks 81,239 85,892
1/ Includes capital deductions for investments
Exhibit 5
For Year 2002, the total Capital Adequacy Ratio (“CAR”) for the DBSH Group, measured according to the Bank for International Settlements (“BIS”) guidelines was 15.5%, which is above the minimum CAR requirement of 8.0%.
The reduction in the Tier 1 CAR ratio, from 13.7% in September 2002 to 10.3% in December 2002, was due primarily to the additional goodwill arising from DBS' purchase of the DHG minority interest in early January 2003.
1998 1999 2000 2001 Jun 02 Dec 02
Quoted Investments Properties
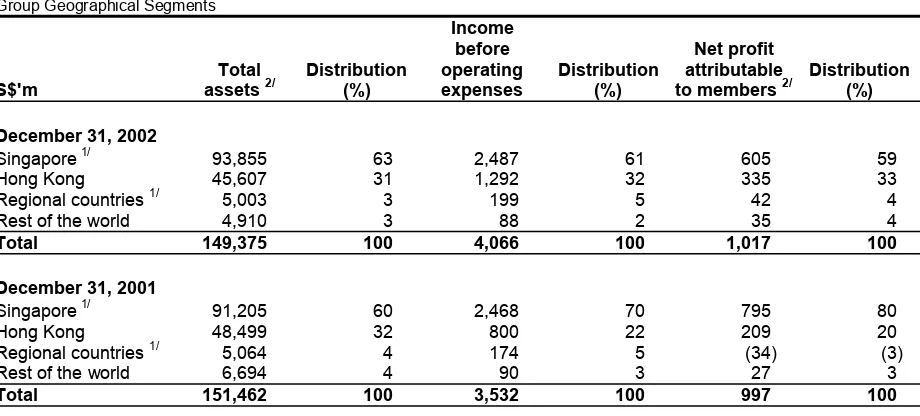
Geographical Segment Analysis
The following tables analyse total assets, income before operating expenses and NPAM by geographical segments. Unless otherwise stated, the analyses of geographical segments are generally based on the location of office recording the transactions.
Table 10
Group Geographical Segments
S$'m
Total assets 2/
Distribution (%)
Income before operating expenses
Distribution (%)
Net profit attributable to members 2/
Distribution (%)
December 31, 2002
Singapore 1/ 93,855 63 2,487 61 605 59
Hong Kong 45,607 31 1,292 32 335 33
Regional countries 1/ 5,003 3 199 5 42 4
Rest of the world 4,910 3 88 2 35 4
Total 149,375 100 4,066 100 1,017 100
December 31, 2001
Singapore 1/ 91,205 60 2,468 70 795 80
Hong Kong 48,499 32 800 22 209 20
Regional countries 1/ 5,064 4 174 5 (34) (3)
Rest of the world 6,694 4 90 3 27 3
Total 151,462 100 3,532 100 997 100
Notes:
1/ Special general provisions for regional exposure, additional provisions for DTDB's loans and amortisation of goodwill on acquisitions of DDH and DBS Group Holdings (Hong Kong) Ltd are booked in Singapore.
2/ Figures for Year 2001 have been restated to reflect the adoption of Statement of Accounting Standard 12 “Income Taxes”. Details of which are set out in Appendix V Note 3.
DBSH Group operates in four main geographical areas :
• Singapore, which includes the operations of the Asian Currency Unit.
• “Hong Kong”, which includes branch and subsidiary operations in Hong Kong.
• "Regional countries", which includes branch and subsidiary operations in Malaysia, Indonesia, Thailand, Korea and the Philippines.
• Rest of the world, which are mainly branch operations in China, India, Taiwan, United States,
and United Kingdom.
Business Segment Analysis
The business segment results represent the customer segments of the respective businesses and are determined by:
• Income and direct expenses attributable to each customer and other segment; and
• Management accounting policies relating to the allocation of indirect expenses and funds transfer pricing between the central treasury unit and the customer/other segments.
In Year 2001, contributions from DHG and DBSV were included in DBSH Group financials from June 29, 2001 and September 12, 2001 respectively. The full year financials of these subsidiary companies have been included in Year 2002.
The various customer segments are:
• Consumer Banking
Consumer Banking focuses on providing products and services to individual customers. The products and services offered to customers include credit facilities (mortgage, personal loans, etc.), credit cards, deposit collection, remittance services, stock brokerage and asset management products.
The decline in net profit after taxation (S$59 million, 16.7%) was mainly attributable to the increase in provisions in Year 2002.
• Enterprise Banking
Enterprise Banking focuses on providing products and services to small and medium enterprises. The product and services offered to customers include credit facilities (overdraft, factoring/accounts receivable purchase, trade financing, commercial/industrial property financing, hire purchase and government financing and assistance schemes), deposit, payment and collection services.
The increase in net profit after taxation (S$69 million, 46.6%) was attributable to lower provisions in Year 2002, in addition to the full year impact of the acquisition of DHG.
• Investment Banking
Investment Banking caters to the business needs of large corporate customers and financial institutions. The products and services offered to customers include direct lending, advisory banking services, bond issuance, equity financing, syndicated financing, mergers and acquisitions advisory services, debt restructuring advisory services, nominee and trustee services and cash management services.
The increase in net profit after taxation (S$121 million, 47.3%) was mainly attributable to lower provisions in Year 2002.
• Treasury and Markets
Treasury and Markets is primarily involved in market making and trading of financial products including foreign exchange, securities, interest rate, credit, equity and foreign exchange derivatives. Income from treasury products and services relating to customers of other segments is reflected in the respective customer segments.
The increase in net profit after taxation (S$32 million, 21.8%) was mainly attributable to Hong Kong Branch, in addition to the full year impact of the acquisition of DHG.
The other segments of the analysis are:
• Funding Portfolio
The increase in net profit after taxation (S$73 million, 38.8%) was mainly attributable to higher net interest income from interest rate trading activities in Singapore and Hong Kong, in addition to the full year impact of the acquisition of DHG.
• Central Operations
Central Operations encompasses a range of activities, with corporate decisions made at the centre and the related income and expenses not attributed to business segments. These include central treasury unit, funding costs of DBSH Group’s associated and subsidiary companies and gains/ losses on properties held centrally.
Comparatives
Where necessary, comparative figures have been restated to conform to current presentation.
The following tables analyse the results, total assets and total liabilities by business segments:
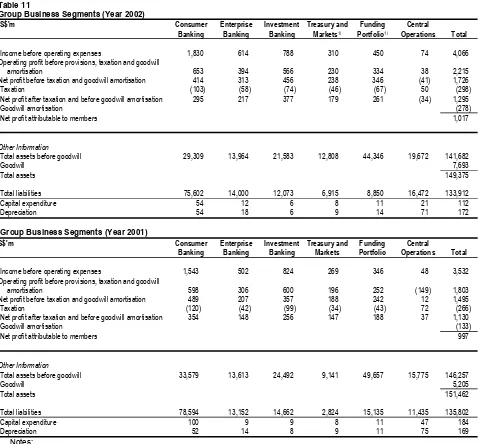
Table 11
Group Business Segments (Year 2002)
S$'m Consumer
Income before operating expenses 1,830 614 788 310 450 74 4,066
Operating profit before provisions, taxation and goodwill
amortisation 653 394 566 230 334 38 2,215
Net profit before taxation and goodwill amortisation 414 313 456 238 346 (41) 1,726
Taxation (103) (58) (74) (46) (67) 50 (298)
Net profit after taxation and before goodwill amortisation 295 217 377 179 261 (34) 1,295
Goodwill amortisation (278)
Net profit attributable to members 1,017
Other Information
Total assets before goodwill 29,309 13,964 21,583 12,808 44,346 19,672 141,682
Goodwill 7,693
Total assets 149,375
Total liabilities 75,602 14,000 12,073 6,915 8,850 16,472 133,912
Capital expenditure 54 12 6 8 11 21 112
Depreciation 54 18 6 9 14 71 172
Group Business Segments (Year 2001)
S$'m Consumer
Income before operating expenses 1,543 502 824 269 346 48 3,532
Operating profit before provisions, taxation and goodwill
amortisation 598 306 600 196 252 (149) 1,803
Net profit before taxation and goodwill amortisation 489 207 357 188 242 12 1,495
Taxation (120) (42) (99) (34) (43) 72 (266)
Net profit after taxation and before goodwill amortisation 354 148 256 147 188 37 1,130
Goodwill amortisation (133)
Net profit attributable to members 997