materials
ArticleImpact of Layer Thickness and Storage Time on the Properties
of 3D-Printed Dental Dies
Aya Sabbah1 , Georgios Romanos2and Rafael Delgado-Ruiz3,*
Citation: Sabbah, A.; Romanos, G.; Delgado-Ruiz, R. Impact of Layer Thickness and Storage Time on the Properties of 3D-Printed Dental Dies.
Materials2021,14, 509. https:// doi.org/10.3390/ma14030509
Academic Editor: Ana Paula Serro Received: 5 December 2020 Accepted: 12 January 2021 Published: 21 January 2021
Publisher’s Note:MDPI stays neutral with regard to jurisdictional claims in published maps and institutional affil-iations.
Copyright: © 2021 by the authors. Licensee MDPI, Basel, Switzerland. This article is an open access article distributed under the terms and conditions of the Creative Commons Attribution (CC BY) license (https:// creativecommons.org/licenses/by/ 4.0/).
1 Department of Oral Biology and Pathology, School of Dental Medicine, Stony Brook University, Stony Brook, NY 11794, USA; [email protected]
2 Department of Periodontology, School of Dental Medicine, Stony Brook University, Stony Brook, NY 11794, USA; [email protected]
3 Department of Prosthodontics and Digital Technology, School of Dental Medicine, Stony Brook University, Stony Brook, NY 11794, USA
* Correspondence: [email protected]
Abstract: The purpose of this study was to evaluate the effect of printing layer thickness on the repeatability and surface roughness of 3D-printed dies and detect the effect of layer thickness and storage time on the dimensional stability of 3D-printed dies. One stereolithography (STL) file of an upper molar prepared for a full ceramic crown was used to print three groups of dies: 25µm, 50µm, and 100µm. Repeatability was evaluated by linear and area measurements with a digital caliper and a digital metrology microscope. Dimensional stability was analyzed at 3 weeks, 6 months, and 1 year of storage time. Surface roughness parameters were measured with a 3D confocal laser scanning microscope. Statistics were completed using one-way analysis of variance and Tukey’s post hoc tests,
p< 0.05. Printing time decreased as layer thickness increased. All groups showed high repeatability and comparable surface roughness while showing differences in their linear dimensions and surface areas. At the 3 week storage interval, dimensional changes were observed in all groups. Within this experimental study’s constraints, it can be concluded that changing the 3D-printing layer thickness does not affect the repeatability or the surface roughness of the product; meanwhile, changes to the layer thickness and storage time influence the dimensional stability of 3D-printed dies.
Keywords: dentistry; 3D-printing; printed dies; dimensional stability; surface roughness; stere-olithography
1. Introduction
A well-fitted dental prosthesis relies on reducing errors during each step of its fabri-cation [1]. Traditionally, the fabrication process goes through a sequence of manual steps, starting with the impression and ending with the insertion of an accurate, functional, and esthetic restoration. Errors can be introduced at any point in the conventional work-flow [2]. The digitalization of the conventional processes using digital dentistry techniques can contribute to reducing errors, steps, and effort, as well as the reduction of wasted materials [3].
In digital dentistry, additive (3D-printing) and subtractive manufacturing techniques are used to fabricate a wide range of objects [4]. The American Society for Testing and Ma-terials (ASTM) has defined additive manufacturing (AM) as a method of uniting maMa-terials to produce objects originated from 3D model data, layer superimposed over layer. [5]. The ASTM international committee on AM technologies has determined seven AM categories: stereolithography (SLA), material jetting (MJP), material extrusion or fused deposition modelling (FDM), binder jetting, powder bed fusion (PBF), sheet lamination, and direct energy deposition [5].
Products of AM in dentistry include surgical guides, orthodontic aligners, temporary restorations, denture bases and teeth, dental models, dental implants, and dental dies [6,7].
The dental die is a positive reproduction of a tooth inside a working or studying model [8]. Maintaining the integrity and the volumetric stability of the die throughout its storage time is crucial in confirming the adaptation of any final restoration over the tooth that the dental die represents [8]. Furthermore, having a dimensionally stable die allows for the achievement of precise occlusal and interproximal contacts [9].
At present, a completely digital workflow is possible in clinical dentistry, from digital impression through manufacturing production to final framework. Additionally, a digital workflow shows good clinical reliability and excellent patient feedback [10,11].
If the die dimensions change, the marginal gap can increase, the cement space can be altered, and the final crown could not fit adequately. This may result, clinically, in food trapping, caries, crown loosening, and crown failure [12]. Traditionally, dies are fabricated in type IV/V die stone, epoxy resins, or metals. From these material options, type IV die stone has been the gold standard due to its detail reproducibility and dimensional stability [13]. However, its strength can be compromised if the water–powder ratio is altered [14,15].
Dental dies can also be fabricated by 3D-printing. The 3D-printing of dental dies involves scanning a prepared tooth with an intraoral scanner (the direct technique) or by scanning an impression or a cast with a laboratory scanner (the indirect technique) [16–18]. The data are converted into a standard tessellation language (STL) file that is edited using the appropriate software to create a digital model sent for manufacturing by additive (3D-printing) or subtractive (milling) methods. The additive technique builds up an object layer-by-layer and allows for the fabrication of more complex structures than subtractive methods [19,20].
Among the several additive manufacturing techniques is stereolithography (SLA), a well-known technique in the AM industry that has been used in medical devices like hearing aids It is a widely preferred method in dentistry due to its precision and small part accuracy [21,22]. The SLA technique uses a unique curing source, a compatible resin, and a typical polymerization reaction. Additionally, SLA offers the option of printing with different layer thicknesses, which may impact the final surface characteristics [23,24].
The printed dies should keep stable dimensions and maintain a reliable reference to allow for laboratory work, the clinician’s evaluation, and ample storage time [25]. There are no studies elaborating on the effect of changing layer thickness on the repeatability, surface roughness, and dimensional stability of 3D-printed structures (dies) after different amounts of storage time.
The purpose of this study was to evaluate the effect of printing layer thickness on repeatability and surface roughness and to detect the effect of layer thickness and storage time on the dimensional stability of 3D-printed dies.
2. Materials and Methods
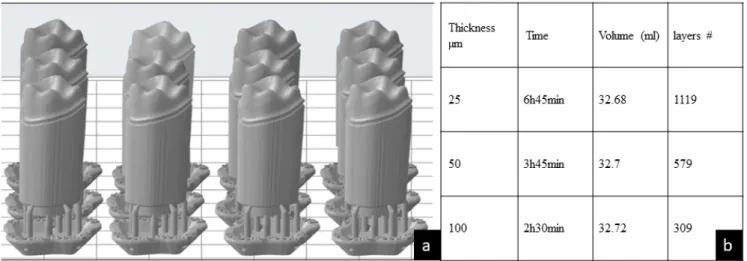
A typodont (ModuPRO Pros, Acadental Inc., Lenexa, KS, USA) was selected to prepare a first upper left molar. The preparation characteristic for a full ceramic crown was completed as follows: 360-degree shoulder, 1 mm margin width, 6◦-degrees tapered walls, an occlusal reduction of 2 mm, and round line angles [26]. The preparation was scanned in a Dental Wings®7 Series laboratory scanner (Dental Wings®, Montreal, QC, Canada) following the protocol described by Alexandru et al. [7]. The file was saved as an STL file, the margin limits were confirmed and marked, the emergence profile was maintained, and an 18 mm die stand was digitally created to allow for printing of the die without affecting the margin characteristics. The file was exported to Preform® software Version 3.0.1. (Formlabs, Inc., Somerville, MA, USA), which controls the printing settings (e.g., orientation, layer thickness, and printing material) in the Form2 3D-printer (Formlabs, Inc., Somerville, MA, USA). The settings included supports of 0.6 mm point size, 0.85 density, a 3.5 mm height above the supporting raft, and 1 mm raft thickness. Using this Preform®software, three test groups were oriented at a 90-degree angle, differing only in layer thickness as follows: Group 25µm (n = 12), Group 50µm (n = 12), and Group 100µm (n = 12), as seen in Figure1a.
Materials2021,14, 509 3 of 10
Materials 2021, 14, x FOR PEER REVIEW 3 of 10
sity, a 3.5 mm height above the supporting raft, and 1 mm raft thickness. Using this
Pre-form® software, three test groups were oriented at a 90-degree angle, differing only in
layer thickness as follows: Group 25 µm (n = 12), Group 50 µm (n = 12), and Group 100 µm (n = 12), as seen in Figure 1a.
Each group was printed independently in the Form2 printer. The printing was set by photopolymerization at 405 nm UV light (Formlabs Inc., Somerville, MA, USA) using the V3 (FLGPR03) grey resin (Formlabs Inc., Somerville, MA, USA).
After printing, the dies were immersed and washed by agitation in the Form Wash®
(Formlabs Inc., Somerville, MA, USA), using 75% Isopropyl Alcohol (IPA) for 30 min. Af-terward, the attached supports were removed and the dies were air-dried at room
tem-perature. Finally, the dies were placed in a Form Cure® (Formlabs Inc., Somerville, MA,
USA) postcuring UV chamber for 60 min at 60 °C and 405 nm UV light [27].
The total printing time, volume of resin required, and number of layers for each
group of 12 dies were obtained with the Preform® Software, as seen in Figure 1b.
Figure 1. (a) Lateral view of the standard tessellation language (STL) file of 12 dental dies presented in the Preform soft-ware program. (b) The printing time of the 12 dental dies decreases as the printed layer thickness increases. The volume of the print remains relatively the same. The number of layers decreased gradually by increasing the thickness from group 25, to 50, to 100 µm.
To evaluate the repeatability, the linear and surface area dimensions were evaluated. Linear dimensions: Each die was marked with a permanent marker (Sharpie®,
Shel-byville, TN, USA) with a 1 mm diameter tip at the maximum contour of the margin at all the surfaces. The mesial–distal (M–D) distances between the mesial and distal points ex-pressed in millimeters (mm) were measured with a digital caliper (Keyence VHX-6000 digital microscope, KEYENCE, Itasca, IL, USA) by the same calibrated operator and rec-orded for each die in the three groups. The procedure was completed as follows: a digital mark was created from one point to the other for each die, the point recognition software of the microscope was used to detect the marks, and the measurement from each die was recorded (Figure 2a).
Surface area dimensions: The surface area was measured using the same digital me-trology microscope (Keyence VHX-6000, KEYENCE, Itasca, IL, USA) at a magnification of 50x. An axial view of the occlusal surface was recorded. A digital algorithm was used to
outline the margin, and the surface area (expressed in mm2) contained within the margin
outline was calculated (Figure 2b).
Dimensional stability: The dimensional stability of the dies over time was evaluated by repeated measurements of the linear and the surface area dimensions immediately af-ter printing (T0), afaf-ter three weeks (T1), six months (T2), and at one year (T3). The storage Figure 1.(a) Lateral view of the standard tessellation language (STL) file of 12 dental dies presented in the Preform software program. (b) The printing time of the 12 dental dies decreases as the printed layer thickness increases. The volume of the print remains relatively the same. The number of layers decreased gradually by increasing the thickness from group 25, to 50, to 100µm.
Each group was printed independently in the Form2 printer. The printing was set by photopolymerization at 405 nm UV light (Formlabs Inc., Somerville, MA, USA) using the V3 (FLGPR03) grey resin (Formlabs Inc., Somerville, MA, USA).
After printing, the dies were immersed and washed by agitation in the Form Wash® (Formlabs Inc., Somerville, MA, USA), using 75% Isopropyl Alcohol (IPA) for 30 min. Afterward, the attached supports were removed and the dies were air-dried at room temperature. Finally, the dies were placed in a Form Cure®(Formlabs Inc., Somerville, MA, USA) postcuring UV chamber for 60 min at 60◦C and 405 nm UV light [27].
The total printing time, volume of resin required, and number of layers for each group of 12 dies were obtained with the Preform®Software, as seen in Figure1b.
To evaluate the repeatability, the linear and surface area dimensions were evaluated.
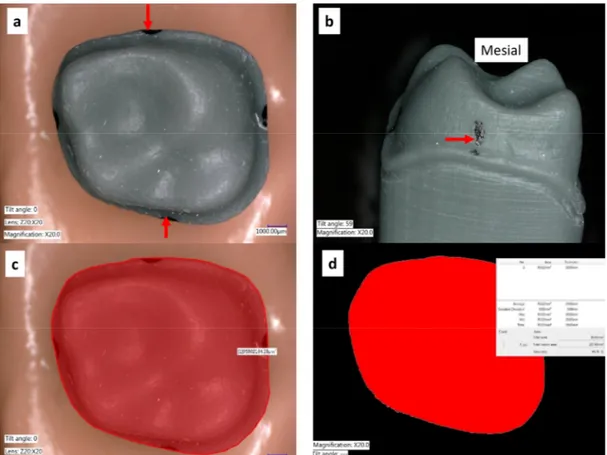
Linear dimensions:Each die was marked with a permanent marker (Sharpie®, Shel-byville, TN, USA) with a 1 mm diameter tip at the maximum contour of the margin at all the surfaces. The mesial–distal (M–D) distances between the mesial and distal points expressed in millimeters (mm) were measured with a digital caliper (Keyence VHX-6000 digital microscope, KEYENCE, Itasca, IL, USA) by the same calibrated operator and recorded for each die in the three groups. The procedure was completed as follows: a digital mark was created from one point to the other for each die, the point recognition software of the microscope was used to detect the marks, and the measurement from each die was recorded (Figure2a).
Surface area dimensions: The surface area was measured using the same digital metrology microscope (Keyence VHX-6000, KEYENCE, Itasca, IL, USA) at a magnification of 50x. An axial view of the occlusal surface was recorded. A digital algorithm was used to outline the margin, and the surface area (expressed in mm2) contained within the margin outline was calculated (Figure2b).
Dimensional stability:The dimensional stability of the dies over time was evaluated by repeated measurements of the linear and the surface area dimensions immediately after printing (T0), after three weeks (T1), six months (T2), and at one year (T3). The storage conditions were: a room temperature between 24–27◦C, a relative humidity of 50%, and the samples were maintained in enclosed dark containers.
Materials2021,14, 509 4 of 10 conditions were: a room temperature between 24–27 °C, a relative humidity of 50%, and
the samples were maintained in enclosed dark containers.
Figure 2. (a) Most prominent points of the die contours were marked. (b) A direct view of the me-sial view showing the most prominent point. (c) The outline of the margin contour observed from an occlusal (top) view was traced (d) The area inside the margin was obtained and the surface area was calculated automatically by using the color difference detection function of the VHX-6000 microscope software.
Surface roughness: Two height parameters (Sa, Sz), one spatial parameter (Str), one feature parameter (Spc), and one hybrid parameter (Sdr) were evaluated using a laser digital
microscope (Keyence 3D Laser Confocal digital VK-X100, KEYENCE, IL, USA) at magni-fication 50X. The definitions of the selected surface parameters are as follows:
Sa (µm) Arithmetical Mean Height: This represents the arithmetic mean of the peaks
and valleys of the surface evaluated in different regions of interest.
Sz (µm) Maximum Height: The maximum peak height and maximum pit depth values
within the designated areas of interest.
Str Texture Aspect Ratio: This parameter quantifies texture strength. Values near 1
demonstrate isotropy (directionality) of the surface. Meanwhile, values near 0 demon-strate anisotropy.
Spc (1/mm) Arithmetic Mean Peak Curvature: This parameter represents the arithmetic
mean of the main curvature of the peaks on the surface.
Sdr Developed Interfacial Area Ratio: The surface area contributed by the texture as
com-pared to the planar definition area. The Sdr of a completely flat surface is 0.
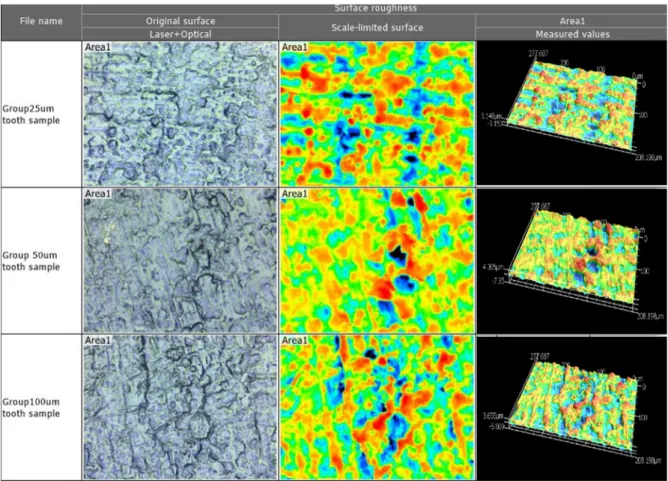
Four areas of 100 µm × 100 µm were randomly located on the proximal surfaces of the dies (buccal, lingual, mesial, or distal) at a 50× magnification (n = 4 × 12 × 3 groups = 144 measures), as seen in Figure 3. Next, using the MultiFile Analyzer® software Version 2.5.0. (KEYENCE, Itasca, IL, USA), the following filtering processes were applied: Missing and weak data were removed using a signal filter, and upper and lower height thresholds were determined by manually selecting the highest and the lowest intensity peaks. To
Figure 2.(a) Most prominent points of the die contours were marked. (b) A direct view of the mesial view showing the most prominent point. (c) The outline of the margin contour observed from an occlusal (top) view was traced (d) The area inside the margin was obtained and the surface area was calculated automatically by using the color difference detection function of the VHX-6000 microscope software.
Surface roughness:Two height parameters (Sa, Sz),one spatial parameter (Str), one
feature parameter (Spc), and one hybrid parameter (Sdr) were evaluated using a laser
digital microscope (Keyence 3D Laser Confocal digital VK-X100, KEYENCE, IL, USA) at magnification 50X. The definitions of the selected surface parameters are as follows:
Sa(µm) Arithmetical Mean Height: This represents the arithmetic mean of the peaks and valleys of the surface evaluated in different regions of interest.
Sz(µm) Maximum Height: The maximum peak height and maximum pit depth values within the designated areas of interest.
StrTexture Aspect Ratio:This parameter quantifies texture strength. Values near 1
demon-strate isotropy (directionality) of the surface. Meanwhile, values near 0 demondemon-strate anisotropy. Spc(1/mm) Arithmetic Mean Peak Curvature:This parameter represents the arithmetic
mean of the main curvature of the peaks on the surface.
Sdr Developed Interfacial Area Ratio: The surface area contributed by the texture as
compared to the planar definition area. TheSdrof a completely flat surface is 0.
Four areas of 100µm×100µm were randomly located on the proximal surfaces of the dies (buccal, lingual, mesial, or distal) at a 50×magnification (n = 4×12×3 groups = 144 measures), as seen in Figure3. Next, using the MultiFile Analyzer®software Version 2.5.0. (KEYENCE, Itasca, IL, USA), the following filtering processes were applied: Missing and weak data were removed using a signal filter, and upper and lower height thresholds were determined by manually selecting the highest and the lowest intensity peaks. To eliminate the effect of the surface curvature, the automatic selection of a flat reference plane was selected. The same filters were applied to all samples using the batch analysis criteria. Mean and standard deviation values were calculated for all parameters for all dies.
Materials2021,14, 509 5 of 10
Materials 2021, 14, x FOR PEER REVIEW 5 of 10
eliminate the effect of the surface curvature, the automatic selection of a flat reference plane was selected. The same filters were applied to all samples using the batch analysis criteria. Mean and standard deviation values were calculated for all parameters for all dies.
Figure 3. The surface roughness of the tooth die surface for each of the three groups in magnified 3D. Taken by Profile-analyzing Laser Microscope VK-X100 series, Keyence@.
Statistical analysis: Sample size was determined to be 12 for each group according to Java Applet Software of Indiana University [28], considering a power of 85% and an alpha error of 5%. Each group’s repeatability was evaluated by using dispersion measures around the means, including standard deviation (STDEV), variance, and interquartile range (IQR).
Dimensional changes and surface roughness were evaluated using the GraphPad Prism 8.2 software (GraphPad Software® San Diego, CA, USA). The Kolmogorov– Smirnov test was used to confirm the normality of the data and a one-way ANOVA single factor test (α = 0.05) was used to evaluate the differences between the means, followed by multiple Tukey test post hoc comparisons. Statistical significance was considered to be met when the p-value was < 0.05.
3. Results
Intragroup comparisons (repeatability): At time zero (T0), each group’s linear di-mensions showed minimal within-group variances (0.01 mm2) and standard deviations (0.1 mm) (12 dies per group). In terms of surface area, the variances in the measurements were 0.26–0.46 mm4, while their standard deviations were 0.5–0.7 mm2, indicating suffi-cient repeatability (Table 1).
Figure 3.The surface roughness of the tooth die surface for each of the three groups in magnified 3D. Taken by Profile-analyzing Laser Microscope VK-X100 series, Keyence@.
Statistical analysis:Sample size was determined to be 12 for each group according to Java Applet Software of Indiana University [28], considering a power of 85% and an alpha error of 5%. Each group’s repeatability was evaluated by using dispersion measures around the means, including standard deviation (STDEV), variance, and interquartile range (IQR). Dimensional changes and surface roughness were evaluated using the GraphPad Prism 8.2 software (GraphPad Software®San Diego, CA, USA). The Kolmogorov–Smirnov test was used to confirm the normality of the data and a one-way ANOVA single factor test (α= 0.05) was used to evaluate the differences between the means, followed by multiple Tukey test post hoc comparisons. Statistical significance was considered to be met when thep-value was <0.05.
3. Results
Intragroup comparisons (repeatability): At time zero (T0), each group’s linear di-mensions showed minimal within-group variances (0.01 mm2) and standard deviations (0.1 mm) (12 dies per group). In terms of surface area, the variances in the measurements were 0.26–0.46 mm4, while their standard deviations were 0.5–0.7 mm2, indicating sufficient repeatability (Table1).
Table 1.The intragroup repeatability of the linear dimensions and surface area. Standard deviation: STDEV; interquartile range: IQR; mesial–distal width: M–D; time 0: T0; variance: V.
Layer Thickness
Linear Dimension Surface Area
Mean±STDEV (mm) V
(mm2) (mm)IQR Mean±STDEV (mm2) (mmV4) (mmIQR2)
25µm 9.63±0.12 0.02 0.15 95.76±0.51 0.28 0.78
50µm 9.53±0.09 0.01 0.16 95.67±0.65 0.46 0.61
100µm 9.48±0.081 0.01 0.11 94.99±0.49 0.26 0.63
Intergroup comparisons:At printing time 0, there was a statistically significant dif-ference noted in the linear dimensions (0.15 mm) and surface area (0.77 mm2), specifically between the 25µm and 100µm groups. The dimensional means were distinctively smaller in the 100µm group when compared to the 25µm and 50µm groups right after printing (p< 0.05), as seen in Table2.
Table 2. The intergroup comparisons of the linear dimensions and surface area, with the 25µm, 50µm, and 100µm groups at printing time zero (T0), using one-way ANOVA and Tukey’s post hoc.
Layer Thickness of Groups at T0 Surface Area Mean Difference (mm) Adjusted p-Value Mean Diff. (mm2) Adjustedp-Value 25 vs. 50µm 0.10 0.054 0.10 0.913 25 vs. 100µm 0.15 0.002 0.78 0.007 50 vs. 100µm 0.05 0.427 0.68 0.019
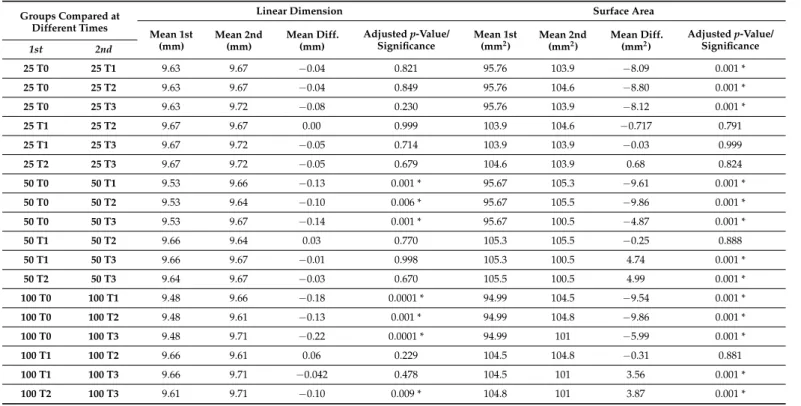
Dimensional stability over time:The mean linear dimension and surface area showed expansion over the period of 1 year for all three groups, mainly in the first 6 months, and more precisely in the first 3 weeks, as seen in the surface areas (significantly in the 50µm and 100µm groups). See Table3.
Table 3. The dimensional stability of linear and surface area over time in the 25µm, 50µm, and 100µm groups, using one-way ANOVA and Tukey’s post hoc. *p< 0.05.
Groups Compared at Different Times
Linear Dimension Surface Area
Mean 1st (mm) Mean 2nd (mm) Mean Diff. (mm) Adjustedp-Value/ Significance Mean 1st
(mm2) Mean 2nd(mm2) Mean Diff.(mm2)
Adjustedp-Value/ Significance 1st 2nd 25 T0 25 T1 9.63 9.67 −0.04 0.821 95.76 103.9 −8.09 0.001 * 25 T0 25 T2 9.63 9.67 −0.04 0.849 95.76 104.6 −8.80 0.001 * 25 T0 25 T3 9.63 9.72 −0.08 0.230 95.76 103.9 −8.12 0.001 * 25 T1 25 T2 9.67 9.67 0.00 0.999 103.9 104.6 −0.717 0.791 25 T1 25 T3 9.67 9.72 −0.05 0.714 103.9 103.9 −0.03 0.999 25 T2 25 T3 9.67 9.72 −0.05 0.679 104.6 103.9 0.68 0.824 50 T0 50 T1 9.53 9.66 −0.13 0.001 * 95.67 105.3 −9.61 0.001 * 50 T0 50 T2 9.53 9.64 −0.10 0.006 * 95.67 105.5 −9.86 0.001 * 50 T0 50 T3 9.53 9.67 −0.14 0.001 * 95.67 100.5 −4.87 0.001 * 50 T1 50 T2 9.66 9.64 0.03 0.770 105.3 105.5 −0.25 0.888 50 T1 50 T3 9.66 9.67 −0.01 0.998 105.3 100.5 4.74 0.001 * 50 T2 50 T3 9.64 9.67 −0.03 0.670 105.5 100.5 4.99 0.001 * 100 T0 100 T1 9.48 9.66 −0.18 0.0001 * 94.99 104.5 −9.54 0.001 * 100 T0 100 T2 9.48 9.61 −0.13 0.001 * 94.99 104.8 −9.86 0.001 * 100 T0 100 T3 9.48 9.71 −0.22 0.0001 * 94.99 101 −5.99 0.001 * 100 T1 100 T2 9.66 9.61 0.06 0.229 104.5 104.8 −0.31 0.881 100 T1 100 T3 9.66 9.71 −0.042 0.478 104.5 101 3.56 0.001 * 100 T2 100 T3 9.61 9.71 −0.10 0.009 * 104.8 101 3.87 0.001 *
Materials2021,14, 509 7 of 10
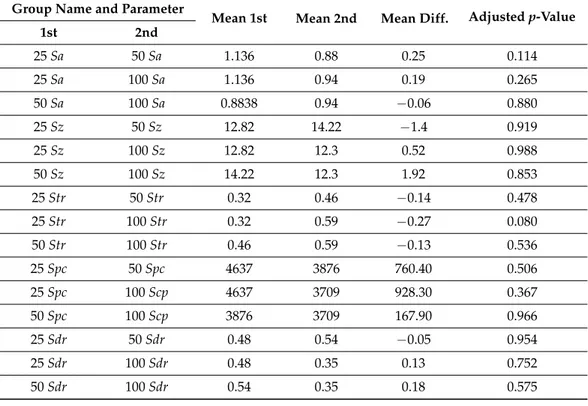
Surface roughness: The roughness parametersSa,Sz,Str,Spc, andSdrwere similar
among the groups (p= 0.11–0.98), as seen in Table4.
Table 4. Surface roughness comparison among the three groups (25, 50, 100µm) using one-way ANOVA and Tukey’s post hoc.
Group Name and Parameter
Mean 1st Mean 2nd Mean Diff. Adjustedp-Value
1st 2nd 25Sa 50Sa 1.136 0.88 0.25 0.114 25Sa 100Sa 1.136 0.94 0.19 0.265 50Sa 100Sa 0.8838 0.94 −0.06 0.880 25Sz 50Sz 12.82 14.22 −1.4 0.919 25Sz 100Sz 12.82 12.3 0.52 0.988 50Sz 100Sz 14.22 12.3 1.92 0.853 25Str 50Str 0.32 0.46 −0.14 0.478 25Str 100Str 0.32 0.59 −0.27 0.080 50Str 100Str 0.46 0.59 −0.13 0.536 25Spc 50Spc 4637 3876 760.40 0.506 25Spc 100Scp 4637 3709 928.30 0.367 50Spc 100Scp 3876 3709 167.90 0.966 25Sdr 50Sdr 0.48 0.54 −0.05 0.954 25Sdr 100Sdr 0.48 0.35 0.13 0.752 50Sdr 100Sdr 0.54 0.35 0.18 0.575 4. Discussion
The purpose of this study was to evaluate the effect of printing layer thickness on the repeatability and surface roughness of 3D-printed dies and the effect of layer thickness and storage time on the dimensional stability of 3D-printed dies. In the present work, the printed dies showed minor differences in their initial dimensions independent of layer thickness. This finding represents excellent repeatability (minimal intragroup variabil-ity) [29]. These findings can be explained by the standardization of the printing parameters, including sample orientation, support number, support locations, the resin used for print-ing, and postprocessing methods, which were the same for all groups. Arnold et al. [30] found that 3D-printing produced a roughness between 0.87 and 4.44µm, which is higher than casted or milled structures. The differences between the results of Arnold et al. [30] and the results of the present work can be explained by the sample orientation during printing used in the present study (being the same for all samples) and the standardization of microscopy analysis at a high magnification that evaluated the surface of the most external layer but not the layer’s interfaces. Meanwhile, the Arnold et al. study used different printing angles and a single roughness parameter.
The findings of the present work are in agreement with the study by Shim et al. [31]; in their study, the samples were printed at different angles, and the authors observed that a 90-degree angle provided the lowest dimensional errors (length and thickness), the best surface (lower roughness), and better mechanical properties compared to 0-degree and 45-degree printing angles.
The dimensional changes suffered by resin 3D-printed structures might be explained by free monomers and oligomers, the spacing between printing layers, and microstructural defects induced during printing (with UV light/laser light printing) [6,32,33]. On the other hand, post-printing dimensional changes can also affect a 3D-printed object in many ways, including dissolution, disintegration, delamination, and swelling, not to mention that all of
these are time-dependent [34]. In the case of photopolymers, although they are resistant to solvents, they can suffer swelling, characterized by an increase in volume [34,35].
Gojzewski et al. found that a variable interfacial space of around 11µm thickness can persist between each 3D-printed layer, resulting in a nonhomogeneous photopoly-merization produced by oxygen molecules present in the air and their diffusion over time through the interphases of the printed material [36]. Their results agree with those of the present study, which show that the samples suffered expansion when the follow-up period was increased. Accuracy is essential when working with a dental die where a crown will be designed, fabricated, and evaluated. Any change in the measured area or dimensions should not exceed a range between 40 and 120µm of discrepancy depending on the restora-tion’s material [37]. Jang et al. evaluated the fit (marginal and internal) of single crowns fabricated on 3D-printed models. Their results showed that the crowns manufactured on 3D-printed models possessed an inferior fit compared to the crowns fabricated on conventional casts. This can be explained by the potential dimensional changes suffered by 3D-printed structures over time, as presented in the results of the present work [38].
This experimental study has some drawbacks. First, a single resin was used for printing. Therefore, these results could not be generalized to other resins; however, the composition of the grey resin used in this study is comparable to other resin types produced by the same manufacturer. Thus, the results might be extrapolated to more resins from the same manufacturer [39]. Alongside this, a single printer was used, and the printer’s perfor-mance may have influenced printing quality. However, the differences between printers, their calibrations, and other limitations in layer thickness (Z-resolution) capabilities could introduce more variability in the results. The potential changes in the mechanical prop-erties of 3D-printed resins over long periods of storage are not well understood. Finally, the influences of room temperature and humidity are variable factors in laboratory and clinical settings; therefore, the results of the present work must be considered applicable to similar storage conditions. The strengths of the present work are the standardization of the printing parameters, the use of a single calibrated printer, the use of a material which is similar to other materials from the same manufacturer, the use of hybrid parameters for the evaluation of the surface roughness, and the use of homogeneous and well-reported storage conditions that allow for the reproduction of the experimental conditions. There-fore, based on the results of the present study, a dental die should be printed with layers of 25µm thickness, and any precision work needing to be completed or verified on a resin 3D-printed die should be accomplished during the T0 (immediately after printing and processing) and the T1 (three weeks after printing and processing) periods, where the lowest dimensional changes were observed in the 3D-printed dies.
5. Conclusions
Within this experimental study’s constraints, it can be concluded that changing the 3D-printing layer thickness does not affect the repeatability or the surface roughness of the product. Meanwhile, changing the layer thickness as well as the storage time influences the dimensional stability of 3D-printed dies.
Author Contributions:Conceptualization, R.D.-R., A.S., and G.R.; methodology, R.D.-R. and A.S.; software, R.D.-R. and A.S.; validation, G.R. and R.D.-R. and A.S.; formal analysis, R.D.-R., A.S., and G.R.; investigation, A.S. and R.D.-R.; resources, R.D.-R.; data curation, A.S. and R.D.-R.; writing— original draft preparation, A.S. and R.D.-R.; writing—review and editing, A.S., R.D.-R., and G.R.; visualization, G.R.; supervision, R.D.-R.; project administration, R.D.-R.; funding acquisition, R.D.-R. All authors have read and agreed to the published version of the manuscript.
Funding:This research was funded by research funds of the Department of Prosthodontics and Digital Technology at the School of Dental Medicine of Stony Brook University.
Institutional Review Board Statement:Not applicable.
Materials2021,14, 509 9 of 10
Data Availability Statement: The data presented in this study are available on request from the corresponding author.
Conflicts of Interest:The authors declare that there are no conflict of interest in this study. References
1. Annual Report: The Additive Manufacturing Center of Excellence. 2019. Available online:www.amcoe.org(accessed on 17 July 2020). 2. Bonsor, S.J.; Pearson, G.A Clinical Guide to Applied Dental Materials E-Book; Elsevier Health Sciences: Amsterdam, The
Nether-lands, 2012.
3. Tahayeri, A.; Morgan, M.; Fugolin, A.P.; Bompolaki, D.; Athirasala, A.; Pfeifer, C.S.; Ferracane, J.L.; Bertassoni, L.E. 3D printed versus conventionally cured provisional crown and bridge dental materials.Dent. Mater.2018,34, 192–200. [CrossRef]
4. Bhargav, A.; Sanjairaj, V.; Rosa, V.; Feng, L.; Fuh, Y. Applications of additive manufacturing in dentistry: A review.J. Biomed. Mater. Res. B Appl. Biomater.2018,106, 2058–2064. [CrossRef]
5. Chua, C.K.; Leong, K.F.3D Printing and Additive Manufacturing: Principles and Applications (with Companion Media Pack) Fourth Edition of Rapid Prototyping Fourth Edition; World Scientific Publishing Company: Singapore, 2014.
6. Oberoi, G.; Nitsch, S.; Edelmayer, M.; Janji´c, K.; Müller, A.; Agis, H. 3D Printing-Encompassing the Facets of Dentistry.Front. Bioeng. Biotechnol.2018,6, 172. [CrossRef]
7. Alexandru, B.; Gasparik, C.; Baciu, S.; Manole, M.; Dudea, D.; Campian, R. Three-Dimensional Accuracy Evaluation of Two Additive Manufacturing Processes in the Production of Dental Models.Key Eng. Mater.2017,752, 119–125.
8. Padilla, M.T.; Bailey, J.H. Margin configuration, die spacers, fitting of retainers/crowns, and soldering.Dent. Clin. N. Am.1992,
36, 743–764.
9. Nejatidanesh, F.; Lotfi, H.R.; Savabi, O. Marginal accuracy of interim restorations fabricated from four interim autopolymerizing resins.J. Prosthet Dent.2006,95, 364–367. [CrossRef] [PubMed]
10. Ahmed, K.E. We’re Going Digital: The Current State of CAD/CAM Dentistry in Prosthodontics. Prim. Dent J.2018,7, 30–35. [CrossRef] [PubMed]
11. Guichet, D.L. Digital Workflows in the Management of the Esthetically Discriminating Patient. Dent. Clin. N. Am. 2019,63, 331–344. [CrossRef]
12. Rossetti, P.; Valle, A.; Carvalho, R.; Goes, M.; Pegoraro, L. Correlation between margin fit and microleakage in complete crowns cemented with three luting agents.J. Appl. Oral Sci. Rev. FOB2008,16, 64–69. [CrossRef] [PubMed]
13. Niekawa, C.T.; Kreve, S.; A’Vila, G.B.; Godoy, G.G.; Eduardo Vieira da Silva, J.R.; Dias, S.C. Analysis of the Mechanical Behavior and Surface Rugosity of Different Dental Die Materials.J. Int. Soc. Prev. Community Dent.2017,7, 34–40. [PubMed]
14. Queiroz, D.; Cunha, L.; Duarte, J.; Neves, A.; Silva-Concilio, L. Influence of the casting material on the dimensional accuracy of dental dies.Braz. Oral Res.2011,25, 357–361. [CrossRef]
15. Prisco, R.; Cozzolino, G.; Vigolo, P. Dimensional accuracy of an epoxy die material using different polymerization methods.J. Prosthodont.2009,18, 156–161. [CrossRef] [PubMed]
16. Bukhari, S.; Goodacre, B.J.; AlHelal, A.; Kattadiyil, M.T.; Richardson, P.M. Three-dimensional printing in contemporary fixed prosthodontics: A technique article.J. Prosthet. Dent.2018,119, 530–534. [CrossRef] [PubMed]
17. Piedra Cascón, W.; Revilla-León, M. Digital workflow for the design and additively manufacture of a splinted framework and custom tray for the impression of multiple implants: A dental technique.J. Prosthet. Dent.2018,120, 805–811. [CrossRef] 18. Serag, M.; Nassar, T.A.; Avondoglio, D.; Weiner, S. A Comparative Study of the Accuracy of Dies Made from Digital Intraoral
Scanning vs. Elastic Impressions: An In Vitro Study.J. Prosthod. Off. J. Am. Coll. Prosthodont.2018,27, 88–93. [CrossRef] 19. Kim, D.-Y.; Kim, J.-H.; Kim, H.-Y.; Kim, W.-C. Comparison and evaluation of marginal and internal gaps in cobalt–chromium
alloy copings fabricated using subtractive and additive manufacturing.J. Prosthodont. Res.2018,62, 56–64. [CrossRef]
20. Grant, G.T.; Campbell, S.D.; Masri, R.M.; Andersen, M.R. Glossary of Digital Dental Terms: American College of Prosthodontists.
J. Prosthodont.2016,25(Suppl. 2), S2–S9. [CrossRef]
21. Javaid, M.; Haleem, A. Current status and applications of additive manufacturing in dentistry: A literature-based review.J. Oral Biol. Craniofac. Res.2019,9, 179–185. [CrossRef]
22. Ngo, T.D.; Kashani, A.; Imbalzano, G.; Nguyen, K.T.Q.; Hui, D. Additive manufacturing (3D printing): A review of materials, methods, applications and challenges.Compos. Part B Eng.2018,143, 172–196. [CrossRef]
23. Zhang, Z.C.; Li, P.L.; Chu, F.T.; Shen, G. Influence of the three-dimensional printing technique and printing layer thickness on model accuracy.J. Orofac. Orthop.2019,80, 194–204. [CrossRef]
24. The Ultimate Guide to Stereolithography (SLA) 3D Printing. Available online: https://formlabs.com/blog/ultimate-guide-to-stereolithography-sla-3d-printing/(accessed on 15 April 2020).
25. Kim, S.Y.; Shin, Y.S.; Jung, H.D.; Hwang, C.J.; Baik, H.S.; Cha, J.Y. Precision and trueness of dental models manufactured with different 3-dimensional printing techniques.Am. J. Orthod. Dentofac. Orthop.2018,153, 144–153. [CrossRef] [PubMed]
26. Nallaswamy, D.Textbook of Prosthodontics; Jaypee Brothers, Medical Publishers Pvt. Limited: New Delhi, India, 2017.
27. Formlabs, A Guide to Post-Curing Formlabs Resins. Available online: https://www.dynamism.com/download/2016/Post-Cure-Guide-by-Resin.pdf(accessed on 25 February 2020).
28. Lenth, R.V. Java Applets for Power and Sample Size [Computer Software]. Retrieved 01/29/2006. Available online: http: //www.stat.uiowa.edu/~{}rlenth/Power(accessed on 29 January 2020).
29. Sherman, S.L.; Kadioglu, O.; Currier, G.F.; Kierl, J.; Li, J. Accuracy of digital light processing printing of 3-dimensional dental models.Am. J. Orthod. Dentofac. Orthop.2020,157, 422–428. [CrossRef] [PubMed]
30. Arnold, C.; Monsees, D.; Hey, J.; Schweyen, R. Surface Quality of 3D-Printed Models as a Function of Various Printing Parameters.
Materials2019,12, 1970. [CrossRef] [PubMed]
31. Shim, J.S.; Kim, J.E.; Jeong, S.H.; Choi, Y.J.; Ryu, J.J. Printing accuracy, mechanical properties, surface characteristics, and microbial adhesion of 3D-printed resins with various printing orientations.J. Prosthet. Dent.2020,124, 468–475. [CrossRef]
32. Zhao, Z.; Qi, H.J.; Fang, D. A finite deformation theory of desolvation and swelling in partially photo-cross-linked polymer networks for 3D/4D printing applications.Soft. Matter.2019,15, 1005–1016. [CrossRef] [PubMed]
33. Bandyopadhyay, A.; Bose, S.Additive Manufacturing, Second Edition; CRC Press: Boca Raton, FL, USA, 2019.
34. Erokhin, K.S.; Gordeev, E.G.; Ananikov, P.V. Revealing interactions of layered polymeric materials at solid-liquid interface for building solvent compatibility charts for 3D printing applications.Sci. Rep.2019,9, 20177. [CrossRef] [PubMed]
35. ISO (Ed.)ISO 5725-3, Accuracy (Trueness and Precision) of Measurement Methods and Results—Part 3: Intermediate Measures of the Precision of a Standard Measurement Method; ISO: London, UK, 2019.
36. Gojzewski, H.; Guo, Z.; Grzelachowska, W.; Ridwan, M.G.; Hempenius, M.A.; Grijpma, D.W.; Vancso, G.J. Layer-by-Layer Printing of Photopolymers in 3D: How Weak is the Interface?ACS Appl. Mater. Interfaces2020,12, 8908–8914. [CrossRef] 37. Riccitiello, F.; Amato, M.; Leone, R.; Spagnuolo, G.; Sorrentino, R. In vitro Evaluation of the Marginal Fit and Internal Adaptation
of Zirconia and Lithium Disilicate Single Crowns: Micro-CT Comparison Between Different Manufacturing Procedures.Open Dent. J.2018,12, 160–172. [CrossRef]
38. Jang, Y.; Sim, J.Y.; Park, J.K.; Kim, W.C.; Kim, H.Y.; Kim, J.H. Evaluation of the marginal and internal fit of a single crown fabricated based on a three-dimensional printed model.J. Adv. Prosthodont.2018,10, 367–373. [CrossRef]
39. Material Data Sheet Standard. Available online:https://formlabs.com/3d-printers/form-3/tech-specs/#data-sheets(accessed on 20 June 2020).