Abstract—The present paper proposes the energy storage system on the batteries with PWM method with the objective regulating the SEIG output voltage during load variation. This method uses the configuration uncontrolled rectifier with a PWM chopper-controlled battery charging. In this study, the SEIG is of 1.5 kW, 380-420 V, 3.5 A, Wye connected. The proposed system shows that the terminal voltage of SEIG can be regulated at a constant value of 406 volts for resistive load variations of 720 watts to 1386 watts. Beside, the frequency of generator can also be maintain at a constant value of 50 Hz. While keeping the generator output voltage constant the power flow from generator to the battery varies from 0 to 444.8 watts.
Keywords—Battery, Pulse Charging, PWM DC Chopper, Self-Excited Induction Generator.
I. INTRODUCTION
He research on use of Self Excited Induction Generator (SEIG) and its peformance improvement has been carried out extensively in the last decade [1]. The successfull of SEIG performance has been supported to some extent by advances of power electronics, especially in the field of static power converter. Compare SEIG to synchronous generators (conventional generators) has several advantages, such as: cheap, easily available, less maintenance, robust construction, simple protection and operation. Owing to advantages and improved performance, SEIG has been being in small scale electricity generation driven by renewable energy sources, such as micro-hydro and wind power.
Micro Hydro Power Plant (MHPP) is a electric power generation driven by micro hydro power with capacity less than 100 kW. Currently, the use of induction generators in the MHPP system grows rapidly. Generally, the MHPP operates turbine power input (mechanical power) relatively constant, with generator power capacity in accordance with the peak load or maximum power [2,3,4]. Since, the MHPP load always fluctuates, so that the output voltage and frequency will also fluctuate following the load variations.
Refdinal Nazir is with the Electrical Engineering Departement, Andalas University, Padang 25163, Indonesia (phone: 062-751-7891208; e-mail: refdinalnazir@ yahoo.co.id).
Andi Pawawoi is with the Electrical Engineering Departement, Andalas University, Padang 25163, Indonesia (phone: 062-751-72566; e-mail: [email protected]).
Farah Rahmadhani is with the Electrical Engineering Departement, Andalas University, Padang 25163, Indonesia (phone: 062-751-72566; e-mail:[email protected]).
A Widely used method to maintain the generator voltage constant during load variation is the method of electronic load control (ELC). In case of SEIG this method is also called the method Induction Generator Control (IGC). In this method, the balance between input and output power is maintained with the installation of ballasts that serves as a dump load. If there is variation of the load then the ELC/IGC would regulate a ballast power so that the power of generator can be maintained constant. Some technique to regulate the output voltage of induction generator using ELC/IGC has been presented elsewhere [2,3]. The technique include binary-weighted switched resistors, phase-controlled thyristor-based load controllers, controlled rectifiers feeding dump loads, and uncontrolled rectifier with a chopper-controlled dump load. The last technique has several advantages, in that the scheme is simple, cheap and reliable, the operation does not require reactive power, and only need a ballast. However, the use of ballasts will be dissipated heat represent energy loss.
In case where, the power demand (load) is less than the power output generator, there will be excess energy production of the SEIG. This excess energy may be storied in batteries.Simulation and analysis to utilize excess energy of the SEIG with a method of energy storage in batteries has been conducted by several researchers previously [5-7]. The performance of SEIG equiped Static VAR Compensator (STATCOM) and a battery has been analyzed using the simulation program SIMULINK/MATLAB [5]. VF controller model for SEIG using Voltage Source Converter (VSC) and battery have been simulated using MATLAB with Simulink and SimPower System (SPS) toolboxes [6]. The development ELC/IGC with the batteries to increase the ability of SEIG on household electrical energy supply with energy storage method on the battery has been analyzed [7].
In the present paper, the energy storage system on the batteries with PWM method used to regulate the SEIG output voltage during load variation is proposed and discussed. The proposed system is analyzed, designed and tested in the laboratory. The results for testing of system performance are presented and evaluated.
Refdinal Nazir, Andi Pawawoi & Farah Rahmadhani
The Energy Storage System on the Batteries with
PWM Method to Regulate the Output Voltage of SEIG
T
World Academy of Science, Engineering and Technology 78 2011
II.CONFIGURATIONOFPROPOSEDSYSTEM
Fig. 1 SEIG with proposed system
The configuration of the proposed system is shown in Fig. 1. The system consists mainly of a step-down transformer, uncontrolled 3-phase rectifier, filters, a step-down DC chopper, a power diode and ten batteries. In this system, the step-down transformer is introduced to lower the generator voltage such to comply with the total voltage of 10 batteries connected in series. Uncontrolled rectifier converts AC voltage generated by SEIG into DC system. Filter capacitors are used to reduce the ripple of the DC output voltage of the uncontrolled rectifier. DC Chopper works as a regulator of the power flow from the generator to the batteries. DC Chopper is built by using IGBT switching components. The switching of IGBT is performed by the driver circuit which is controlled by PWM method. By adjusting the duty cycle of PWM Chopper
, power flow from the generator into batteries can be regulated.
SEIG uses excitation capacitor 3x13.5F in the delta connections to get the nominal voltage at maximum load. The mechanical input power of SEIG supplied from the prime mover at relatively constant value. The SEIG is burdened by the fluctuating resistive load, with relatively small load factors. At peak load conditions, all active power generated by the generator (PG) is used to supply the load (PL). Then if the load declines, the proposed system will absorb the excess power generators (PC). Active power balance equation at the branching point of the load and the proposed system (PCC) is given by the following equation:
PG = PL + PC (1)
III. MODELLING OF THE SYSTEM
A. Modelling of The Steady State SEIG
SEIG equivalent circuit model with resistive load, as shown in Fig. 2 have been used steadily during three decade to analyze the steady state performance of SEIG [3,13].
jXs jXr'
jXm ir'
im is iL
iC
a RL a
t V
a
g E
a Rs
2 C a X j
b a
Rr
'
Is
+
-Ir
+
-IL
Fig. 2 SEIG equivalent circuit with resistive load In this equivalent circuit, the notation a and b are defined as the per-unit frequency generated by the SEIG and the per-unit rotor frequency, expressed by the following equation:
s g
f f a ;
s r
f f
b (2)
where fg is the frequency generated by the SEIG, fs is the synchronous frequency of SEIG equal to 50 Hz, while fr is the frequency of the rotor.
The parameters of SEIG equivalent circuit include the resistance of the stator and rotor per-phase (Rs & Rr'), reactance stator and rotor per-phase (Xs and Xr'), and the magnetization reactance Xm. Rs obtained from the DC test results for the stator resistances, whereas Rr', Xs and Xr' determined from no-load test and locked-rotor test. The test result from parameter SEIG (1.5 kW, 380-420 V, 50 Hz, 3-phase, squirrel cage rotor) is shown in Table 1.
Table 1
Testing results of SEIG equivalent circuit parameters Rs( Xs( Rr’( Xr’( Xm(
4.38 3.61 5.87 3.61 106.16
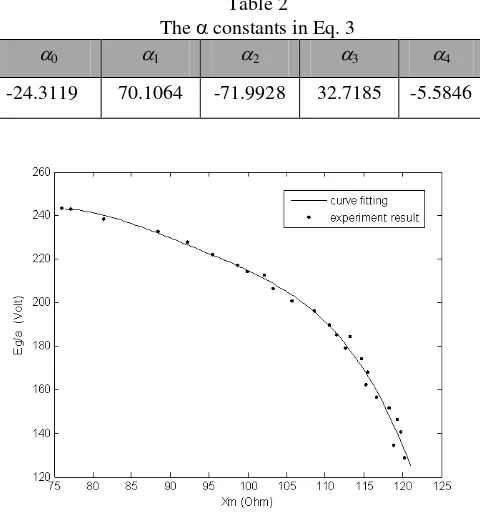
Xm values in Table 1 is the value of the reactance unsaturated magnetization, which is determined at no-load condition. Because of saturation effects, the value of Xm is not constant but varies with the magnetization currents Im or air gap voltages Eg. Determination of Xm as function of Im or Eg can be derived from the magnetization curve [13]. Value of magnetization reactance, Xm, for each of the magnetization current Im is calculated from the ratio between the air gap voltage and current magnetization, Xm=Eg /Im, The calculation result is plotted as a curve that shows variation between Xm with Eg/a, as shown by Fig. 3. This curve is limited on stable regions of the voltage generated by the SEIG. To determine the relation between Xm and Eg/a, a 4th order polynomial is selected:
Eg/a = 4*Xm4+3*Xm3+2*Xm2+1*Xm +0 (3) The constants are determined least square method. Table 2 shows the constants in Equation 3.
World Academy of Science, Engineering and Technology 78 2011
0 0 1 m g f a X J m m 11 ) , ( X a X f J a a X f J ( m, ) 12 m m 21 ) , ( X a X g J
a
a
X
g
J
(
m,
)
22 c L 2 c s s g s ) ( jaX R a R jX jX a R a E L I c L s c L
jX
aR
jX
I
I
L 2 L 3 RPout I
L L
t I R
V
Table 2
The constants in Eq. 3
0 1 2 3 4
-24.3119 70.1064 -71.9928 32.7185 -5.5846
Fig. 3 Variation between Xm with Eg/a
Circuit equation for loop currents Is for equivalent circuit presented by Fig. 2 can be expressed as follows [13]:
ZsIs = 0 (4)
Where: ) ' ( ) ( ' ' ) ( ' ) ( / / / r m m 2 c L 3 c X X j b a R jX b a R jX jX a R a jX a R a jX r r r s s s Z (5)
In the steady state conditions, the stator currents of SEIG must exist or Is ≠ 0. According to equation (4), this condition is only achieved if Zs = 0, which means that the real and imaginary parts of equation (5) equals to zero. This will generate two simultaneous polynomial equations, with Xm and a as unknown variables. The equations are:
i 30 i m i,2 i,1 i m
)
,
(
a
X
a
C
C
X
f
(6)
i 20 i m i,2 i,1 i m
)
,
(
a
X
a
D
D
X
g
(7)where:
Ci,1, Ci,2, Di,1, and Di,2 are constants that depend on machine parameters, load resistance RL, the excitationreactance Xc and per-unit rotor frequency b (detail constants can be seen in Appendix).
To solve equations (6) and (7), Newton Raphson method is used expressed by the following equation [13]:
(8)
where the elements of Jacobian matrix [J] are: ;
; (9) To initiate the iteration, a0 is assigned to be ”1” and Xm0=Xm. For the next iteration, Xm and a are calculated as follows :
Xm = Xm0 + Xm (10)
a = a0 + a (11) Once Xm and a are obtained, then f(Xm, a) and g(Xm, a) can
determined. If the value of the function f(Xm,a) and/or g(Xm,a)> ε, then the iteration process is continued by using the new values of (Xm,a). Meanwhile, if the value of the function f (Xm,a) and g(Xm,a)≤ε, then the iteration process is stopped. ε is the smallest value permitted limit of error during calculation. In this study, ε = 10-5.
After calculating the values (Xm, a) from Eqs. (6) and (7), the next step is to determine the air gap voltage (Eg/a) of the curve Fig. 3. Based on an equivalent circuit of Fig. 2, the equations of SEIG output variables can be determined through the following equation [13]:
- Current stator:
(12)
- Load Current:
(13) - Terminal voltage:
(14) - Output Power
(15)
B.Modelling of Battery Charging With Pulse Method
Referring to Eq. 1, the excess generator power absorbed by the system (PC) can be expressed as:
PC = PLoss + Pbat (16)
where Ploss is the losses in the transformer & rectifier and Pbat is the power delivered to the batteries. Pbat can be expressed by the following equation:
World Academy of Science, Engineering and Technology 78 2011
AHC/20 AHC/10
AHC/40 VOC
00
P
P
dt
E
E
t bat
Lbat
d I AHC
t
t bat
0 0
1
)
SOC(t SOC(t)
t C R DCRe
I
V 2
1
2 exp
Pbat = VDCIbat (17)
where Ibat is the average charging current and VDC is the voltage of the battery terminals. The average charging current Ibat can be resolved using the following equation:
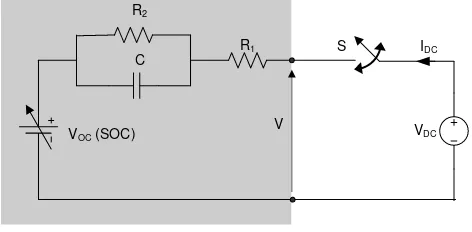
Ibat = IDC (18) where is the duty cycle of PWM DC Chopper and the IDC is the maximum DC current that flows into the battery. The equivalent circuit the battery charging can be developed from an equivalent circuit of lead acid batteries [9-12]. The equivalent circuit the battery charging is shown Fig. 4. R1 is an internal resistance of battery in rapid response, while R2, C are the transient resistance and capacitance battery. Switch S is the replacement of DC Chopper circuit, while the source of the VDC is the equivalent of the rectified voltage of SEIG. During the battery charging with PWM Chopper, the response of terminal voltage V and battery charging current IDC is shown by Fig. 5. The resulting voltage response can be broken down into three components, namely momentary voltage drop (VR1), a transient voltage drop (Vexp) and open circuit voltage (VOC).
VDC VOC (SOC)
R1 R2
C IDC
V S
Fig. 4 Equivalent circuit charging lead acid batteries with DC chopper
VOC voltage is a function of the State of Charge (SOC) battery. In case of 12-volt lead acid battery, the relationship between VOC and SOC can be illustrated by Fig. 6 [8]. This curve shows the magnitude of the variation of battery voltage during charging the battery for 10 hours (AHC/10), 20 hours (AHC/20), 40 hours (AHC/40) and the battery voltage in open circuit condition (rest). For the battery capacity (AHC) 50 AH, this curve will be correlated to the battery charging current 5A, 2.5A, 1.25A and 0 A. Battery SOC at t can be solved by the following equation [9]:
(19) where SOC(t0) and SOC(t) are the battery SOC at the beginning of each charge and after t hours of charging respectively and the AHC is the battery capacity in Ampere Hour (AH).
Fig. 5 Equivalent circuit charging lead acid batteries
Fig. 6 Battery voltage in SOC variation for 12 Volt lead acid battery [8]
IV. DESIGN METHOD
A. Battery
In the proposed system, battery serves as a counterweight of the power output of the generator and the load power. The difference between the power output of the generator and load power is the compensation power, PC, which represents the
amount of energy that must be stored into the batteries and power losses. The amount of energy stored in the batteries after charging t hours can be resolved using the following equation:
(20) where E0 is the energy stored at the beginning of charging the battery, Pbat is the compensation power which stored to the batteries and PLbat is a battery load. Energy stored in batteries can be used directly as a source of DC or energy used to increase the load capacity through an inverter.
Utilization of stored energy on the batteries to extend load capacity of SEIG has been analyzed in previous papers [7]. In
t
VOC VR1
VR2
VR1 = IDCR1
VR2 = IDCR2 IDC
V
World Academy of Science, Engineering and Technology 78 2011
3 , 147 400 3 220
3 60 35 , 1 35 ,
1 LL
DC
V x
V
this analysis, the load of 1200 watts at power factor of 0.42 can be expanded to 2700 watt with a battery capacity required of 6000 Wh or 10 pieces of batteries with a capacity of 50 Ah, 12V. The 10 batteries are connected in series, so the total battery voltage reaches 120V. The maximum charging current is 5 ampere. The batteries used are of lead acid automotive battery. This analysis is used to determine the necessary battery capacity on the current proposed system
B. Transformer and Rectifier
To adjust the output voltage of 400 volt AC generator with batteries total voltage of 120 volts DC, the proposed system is equipped with 3 phase step-down transformer, which has a voltage ratio of 220 3/60 3 and a capacity of 1500VA. Primary and secondary windings of the transformer are connected in Wye. Output terminal of the transformer is connected with a 3-phase full bridge diode rectifier. DC output voltage of 3-phase rectifier can be calculated through the following equation:
Volt (20) The output voltage of 3-phase rectifier contains a ripple, which may reduce the quality of dc voltage in the batteries charging process. The size of the ripples shows the amount of AC components contained in the output DC voltage rectifier. AC components will negatively affect the health or life of the battery. To reduce the ripple content in the output voltage rectifier, 4x330F capacitor connected in parallel with the rectifier output terminal.
C. DC Chopper
To regulate the battery charging current, a step-down DC chopper is used. The selection of step-down DC chopper is intended to get the pulse shape current during battery charging. According to previous studies, charging in a pulse shape is very good for the health of the battery [14]. DC chopper is built using IGBT switching components 1MBI50L-060. Switching on DC Chopper is controlled by PWM method using the SG3524 IC. DC Chopper switching frequency is set to 2 kHz. With the input DC voltage between 0.8 - 3.6 volt to IC SG3524, the pulse of PWM will be raised with the duty cycle between 0-100%. The signal of PWM signal transmitted to the IGBT base through optocoupler TLP621. DC Chopper is also equipped with snubber circuit, which is used for overvoltage protection at the time of switching. Snubber used are the RC snubber, with 10 Ohm resistor and 22 F capacitor.
V.TESTING OF THE PROPOSED SYSTEM
Experiment is conducted to evaluate the system performance. In this scheme (cf. Fig.1), the induction motor that controlled by frequency regulators are used as prime movers. The load of SEIG for each phase is simulated using 5 pieces of incandescent lamps (200 watt, 100 watt, 40 watt, 25 watt, 15 watt) are arranged as shown by Fig.7. The load variations are performed by adjusting the incandescent lamps combination e.g. to produce a load of 315 watts per-phase, the
lamps combination are 200 Watt, 100 watt and 15 watt. The setting of PWM pulse is conducted by the Personal Computer via the DAC.
200 Watt
100 Watt
40 Watt
25 Watt
15 Watt
Fig. 7 The load of SEIG for each phase using 5 pieces of incandescent lamps combination
VI. RESULTS AND DISCUSSIONS
A. Effect of Load Variations on SEIG Performance
Loading of SEIG has great influence on the voltage and frequency output of the generator. Fig. 8 shows the results of simulation and testing of the SEIG output voltage and frequency for various load powers at a speed of 1543 rpm and
13.5 μF capacitor excitation. As shown in Fig. 8, the output voltage (measured) of generator increases from 396.8 volt to 438.3 volts during the load power variations from 1346 watts till 473.1 watts. Meanwhile, the generator frequency (measured) increases from 50.02 Hz to 50.86 Hz for the same load power variation. During the variation of the load, SEIG voltage increase reached 10.46%, while increasing the frequency of SEIG is only 1.68%. The increase of terminal voltage during occur the reduction of load power caused by 2 things. Decrease in load current will cause a decrease in terminal voltage, which means an increase of the SEIG terminal voltage. In the meantime, the increase in frequency of SEIG will cause a decrease in excitation reactance (Xc), which means an increase in excitation current and result in increased SEIG terminal voltage.
B. Effect of DC Chopper Duty Cycle
B.1 Duty Cycle Effect on Battery Charging Current
Fig. 9 shows the influence of duty cycles on the average battery charging current. Testing is done sequentially, starting from until and during the interval of testing, the battery is kept connected to the DC chopper. From Fig. 8 it can be seen that the increase in duty cycle will increase the average battery charging relatively large, but after a while of charging, the slope will be reduced. This is due to the fact that the charging of battery will increase the SOC value of battery (Eq. 18) and the VOC value of battery (Fig. 6) and, on the other hand, will decrease the maximum charging current (Fig. 4) and the average current charging (Eq. 17).
World Academy of Science, Engineering and Technology 78 2011
400 500 600 700 800 900 1000 1100 1200 1300 1400 0
50 100 150 200 250 300 350 400 450 500
PL (Watt)
V
t
(V
o
lt
)
simulated measured
a.voltage output
400 500 600 700 800 900 1000 1100 1200 1300 1400 0
10 20 30 40 50 60
PL (Watt)
fg
(
H
z
)
Simulated Measured
b.frequency generated
Fig. 8 Effect of load on output voltage and frequency of SEIG
0 0,5 1 1,5 2 2,5 3
0 20 40 60 80 100
Ibat(Ampere)
(
Fig. 9 The influence of on Ibat based on laboratory test Fig. 10 shows the current and voltage waveform for battery charging for = 70. As shown in this figure, the current waveform for battery charging is pulse shape. The pulse shape of charging current provides a positive impact for the health of the battery [14]. Because the battery has a cooling period during the off time of DC Chooper, then it will not happen heating continuously during charging.
a.Current Waveform
b.Voltage Waveform
Fig. 10 The Current and voltage waveform of battery charging for = 70 .
B.2 Duty Cycle Effect on Power Flow to Battery
Fig. 11 shows the influence of duty cycle on the power flowing to the battery for load of 600 watt generator, rotor speed of 1526 rpm and baterry VOC of 119.1 volt. The power of load compensation (PC) is the total power absorbed by the system from the generator, which consists of the power value flowing to the battery (Pbat) and power loss in the proposed system (Ploss). As shown by Fig. 11, the compensation power will increase with the increase in duty cycle of the DC Chopper. Similarly to the charging current, the ratio of PC increased is relatively large at the beginning of charging and the ratio will decline after some time of charging. Fig. 12 shows the effect of variations Voc at the beginning of the charging against the variation of compensation power. As shown Fig. 12, the increase in Voc at the beginning of charging will reduce the compensation power.
World Academy of Science, Engineering and Technology 78 2011
0 100 200 300 400 500 600
0 20 40 60 80 100
Pbat
PC
Power (Watt)
(
Fig. 11The effect of variation of on the power compensation
0 100 200 300 400 500 600
0 20 40 60 80 100
Voc = 119,1 V
Voc=122,6V
Power (Watt)
(
Fig. 12 The effect of variation VOC on the power compensation
C. Variation of the Duty Cycle and Power Compensation during Load Variation
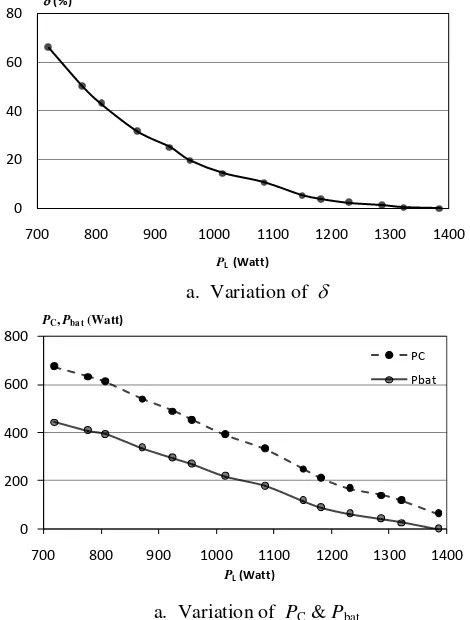
The variation of and the PC required to maintain the generator terminal voltage at a constant value of 406 volts for load variation of 720 watt to 1386 watt shown in Figure 13. As shown by Figure 13a. & 13b, duty cycle of the chopper and the power compensation Pc will be reduced with the increasing power load. This is particularly true that in order to maintain the balance of power on the generator, the compensation power should be reduced to offset increasing of power load. Fig. 14 shows values of voltage and frequency of the SEIG, which are kept constant by the proposed system, during load variations. As shown in Fig. 14a & 14b, the terminal voltage of SEIG can be maintained constant at 406 volts during variations of load, while the SEIG frequency can also be kept constant at 50 Hz.
0 20 40 60 80
700 800 900 1000 1100 1200 1300 1400
(%)
PL(Watt)
a. Variation of
0 200 400 600 800
700 800 900 1000 1100 1200 1300 1400 PC, Pbat(Watt)
PL(Watt)
PC
Pbat
a. Variation of PC & Pbat
Fig. 13 The Variation of and PC required to maintain the SEIG output voltage during load change
0 100 200 300 400 500
700 800 900 1000 1100 1200 1300 1400
Vt(Volt)
PL(Watt) a. Voltage Output
30 35 40 45 50 55 60
700 800 900 1000 1100 1200 1300 1400 fg (Hz)
PL(Watt)
b. Frequency
Fig. 14 Voltage and frequency of the SEIG during the process of compensation
World Academy of Science, Engineering and Technology 78 2011
D.Harmonic Effects on The Proposed System
D.1 Harmonics On The Proposed System Side
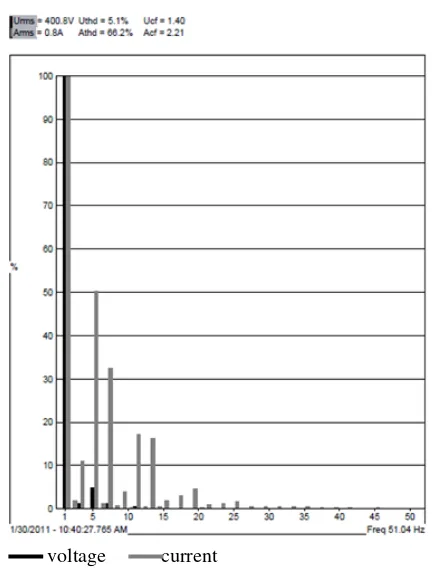
The proposed system generates harmonics on the overall system during regulating the SEIG output voltage. This is due to the use of PWM method that is constructed from non-linear power electronics components. In other words, the proposed system is a source of harmonics for the SEIG with load. Fig. 15 shows the current and voltage waveforms recorded on the proposed system side. While, the harmonic spectrum for current and voltage on the input side of the proposed system for load power of 766 watts and the battery initial voltage of 110 volts is demostrated by Fig. 16.
Fig. 15 The current and voltage waveform through the proposed system
As shown by Fig. 15, the current waveform that flows from the PCC to the proposed system far enough to deviate from a sine wave form. Current THD on the input side of proposed system reaches 66.9%, while its voltage THD is only 6.1% (Fig. 16). The dominant components of current are the odd components with a small order. Current THD value on the input side of the proposed system is quite high, but the focus of attention on the overall system, is the current THD on the load side and generator side. Effect of harmonics on the generator can increase the heating and the power losses, while on the load side it can decrease the quality of power consumed.
voltage current
Fig. 16 Harmonic spectrum on the proposed system side D.2 Harmonics On Load Side
Fig. 17 shows the current and the voltage harmonics on the load side for load of 1065 watts and 766 watts, and the initial battery voltage of 110 volts. Current and voltage THD are relatively small (2.3% and 3.2%) at load of 1065 watts, but the THD value of current and voltage increases to 5.2% and 4.0% at the time of loading the generator was reduced to 766 watts. At heavy load, the component currents flowing to the proposed system is relatively small, so the levels of harmonic currents in overall systems is relatively small. Conversely, the decrease in generator load will increase the current flowing to the proposed system. This will cause an increase in the harmonic currents contained in the system.
D.3 Harmonics On Generator Side
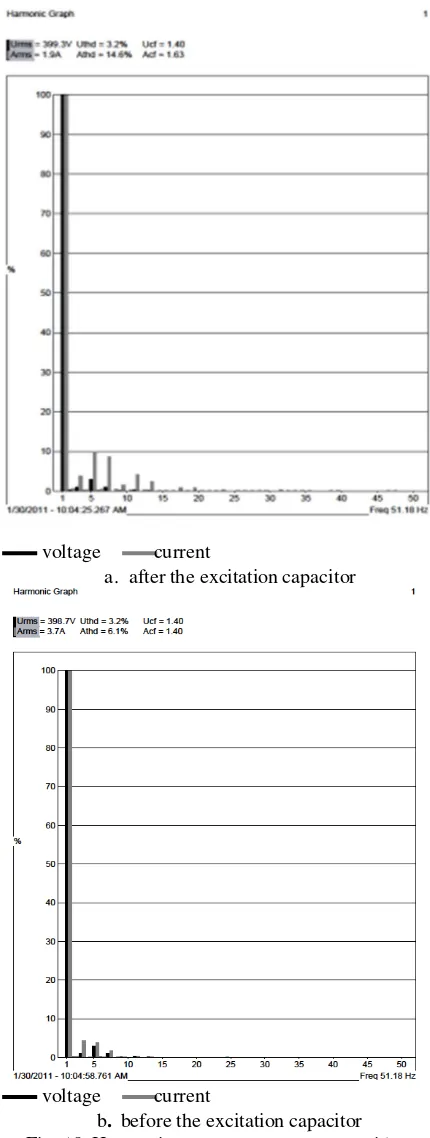
The harmonic current and voltage spectrums on the generator side are shown in Fig. 18. The THD of the current flows from the excitation point toward the PCC (see Fig. 1) is relatively large, reaching 14.6%. However, the THD of the current flows in the windings of the generator is relatively small, only 6.1%.
Current Voltage
World Academy of Science, Engineering and Technology 78 2011
World Academy of Science, Engineering and Technology 78 2011
91
voltage current
a.for 766 watt
voltage current
b. for 1065 watt Fig. 17 Harmonics spectrum on load side
voltage current
a. after the excitation capacitor
voltage current
b. before the excitation capacitor
VII. CONCLUSIONS
The system of energy storage on the battery to regulate the SEIG output voltage during load variation using PWM method has been successfully designed in this study. The proposed system constructed by the Uncontrolled Rectifier with PWM DC Chopper-Controlled Battery Charging. The experiments show that the output voltage of generator can be maintained constant at value of 406 volts for a variation of the resistive load of 720 watts to 1386 watts. Besides, the frequency of the generator is also relatively constant at 50 Hz. To cope with load variation, the proposed system must absorb active power of the SEIG ranging from 674.3 watts until 62.2 watts at the corresponding resistive load from 720 watts to 1386 watts. For such load variation, the power flowing to the battery varies from 0 to 444.8 watts and duty cycle of DC Chopper varies from 0 to 66.07%.
The use of this proposed system on the SEIG would generate voltage and current harmonics on the load and generator. For load of 766 watt, the current THD on the load side is 5.2%, while THD on the generator windings side is 6.1%. Current THD on the load side and the generator will decrease with the increasing load.
APPENDIX
Constant Value of function f(a,Xm)
i Ci,1 Ci,2
0 -XcXr’(RL+Rs)b -Xc(RL+Rs)b 1 Xc(Xr’RL+RsXr’+R2’Xs)+R1RLR2’ Xc(RL+Rs+Rr’) 2 XsXr’RLb (Xs+ Xr’)RLb 3 -XsXr’RL -(Xs+ Xr’)RL
Constant Value of function g(a,Xm)
i Di,1 Di,2
0 -XcRr’(RL+Rs)b 0
1 -Xr’b(RLRs+XsXc) -Xcb(Xs+ Xr’)-RLR1b 2 RL(XsRr’+ Xr’Rs)+XsXc Xr’ Xc(Xs+Xr’)+RL(Rs+Rr’)
ACKNOWLEDGMENT
The authors would like to thank the Director of Research and Public Services, the Directorate General of Higher Education, Ministry of Education of Indonesia for the financial support through Hibah Bersaing scheme competitive grant in 2009.
REFERENCES
[1] Bansal, R.C., “Three-Phase Self-Excited Induction Generator: An
Overview”, IEEE Transactions on Energy Conversion, Vol. 20, No. 2, pp. 292-299, June 2005.
[2] B. Singh, S.S. Murthy and S. Gupta,”Analysis and implementation of an electronic load controller for a self-excited induction generator”, IEE Proc.- Gener. Transm. Distrib., Vol. 151, No. 1, pp. 51-60, January 2004.
[3] Bhim Singh, S.S. Murthy & Sushma Gupta, “Analysis and Design Electronic Load Controller for Self-Excited Induction Generators”, IEEE
Transactions on Energy Conversion, Vol. 21, No. 1, pp. 285-293, March 2006.
[4] Bhim Singh, S.S. Murthy & Sushma Gupta, ”Transient Analysis of Self-Excited Induction Generator With Electronic Load Controller (ELC) Supplying Static and Dynamic Loads”, IEEE Transactions on Industry Applications, Vol. 41, No. 5, pp. 1194-1204, September/October 2005. [5] B.Venkatesa Perumal, and J.K.Chatterjee, “Analysis of a Self Excited
Induction Generator with STATCOM/Battery Energy Storage System”,
[6] Bhim Singh*and V. Rajagopal, “ Battery Energy Storage Based Voltage
and Frequency Controller for Isolated Pico Hydro Systems”, Journal of Power Electronics, Vol. 9, No. 6, pp. 874-882, November 2009. [7] Refdinal Nazir, “Pengembangan Teknologi PLTPH Dalam Meningkatkan
Daya Gunanya Sebagai Sumber Energi Listrik Rumah Tangga”,
Proceeding of National Seminar on Applied Technology, Science, and Arts (1st APTECS), pp. 1114-1118, Surabaya 2009.
[8] Richard Perez, “Lead-Acid Battery State of Charge vs.Voltage”, Home Power #36, August /September 1993.
[9] Robyn A. Jackey, “A Simple, Effective Lead-Acid Battery Modeling Process for Electrical System Component Selection”, 2007.
[10] Martin C., William G. H. & Chin K. L., “An Improved Battery
Characterization Method Using a Two-Pulse Load Test”, IEEE
Transactions On Energy Conversion”, Vol. 23, No. 2, pp. 708-713, June 2008.
[11] Atsushi T. & Masayuki M., “On-line Estimation of SOH for Lead-Acid
Battery”, PED2009, pp. 1552-1555.
[12] Min Chen & Gabriel A. Rinc´on-Mora, “Accurate Electrical Battery Model Capable of Predicting Runtime and I–V Performance”, IEEE Transaction on Eenergy Conversion, Vol. 21, No. 2, pp. 504-511, June
2006.
[13] S.S. Murthy, O.P. Malik & A.K. Tandon, “Analysis of Self-Excited Induction Generators”, IEE Proc. Volt. 129, Pt. C, No. 6, pp. 260-265, Nopember 1982.
[14] Tho Nguyen, Linda Bushnel, ”Advanced Battery Charging Techniques: Pulse-Charging in Large-Scale Applications – Design of Divide and
Conquer Technique for High-Capacity Batteries” Summer, 2003. World Academy of Science, Engineering and Technology 78 2011