ANALYZING STUDENTS’ UNDERSTANDING ON URINARY SYSTEM THROUGH PAPER AND PENCIL TEST AND CONCEPT MAP
Research Paper
Submitted as Requirement to Obtain Degree of Sarjana Pendidikan in
International Program on Science Education Study Program
Arranged by:
Berliany Nuragnia
1100095
INTERNATIONAL PROGRAM ON SCIENCE EDUCATION
FACULTY OF MATHEMATICS AND SCIENCE EDUCATION
UNIVERSITAS PENDIDIKAN INDONESIA
BANDUNG
Berliany Nuragnia, 2015
SHEET OF LEGITIMATION
ANALYZING STUDENTS’ COGNITIVE ON URINARY SYSTEM THROUGH PAPER PENCIL TEST AND CONCEPT MAP
By:
Berliany Nuragnia
Approved and Authorized by,
Supervisor I
Prof. Dr. Hj. Nuryani Rustaman, M.Pd. NIP.195012311979032029
Supervisor II
Rika Rafikah Agustin, M.Pd. NIP. 198308032012122001
Perceive,
Head of International Program on Science Education Study Program
ANALYZING STUDENTS’ UNDERSTANDING ON URINARY SYSTEM THROUGH PAPER AND PENCIL TEST AND CONCEPT MAP
Oleh Berliany Nuragnia
Sebuah skripsi yang diajukan sebgai syarat untuk memperoleh gelr sarjana pendidikan pada Fakultas Pendidikan Matematika dan Ilmu Pengetahuan Alam.
©Berliany Nuragnia 2015 Universits Pendidikan Indonesia
Juli 2015
Hak Cipta dilindungi undng undang
Berliany Nuragnia
International Program on Science Education (IPSE)
ABSTRACT
A descriptive study with correlation design about student’s cognitive is carried out to investigate the profile of student’s paper pencil test and concept map in
learning urinary system and the correlation between student’s paper pencil test and concept map as well. A number of eight grade students (n=26) in International school in Bandung was involved as research participants. International school has
been known for their students’ cognitive ability and their curriculum that support
students to be able to integrate their knowledge which related to daily life. The
data of student’s paper pencil test was obtained using objective and subjective test
instrument while student’s concept maps were assessed based on Mueller’s Classroom Concept Map Rubrics. Research findings shows that most of student’s can not solve the problem of applying (C3) question test (42.8%) and the concept of urination process. Generally students were not able to determine the concept and make proportion in making concept map. Student found it difficult to explain the concept of disease in urinary system with their concept map. While there is no
significant correlation between student’s concept map and paper pencil test (Spearman correlation is 0.252). The low relationship between score test and score of concept map is due to the type of knowledge been assessed through paper pencil test was mostly factual and students’ low ability in explaining the concept by making concept map. Thus, type of conept map tasking should be adjust with
students’ ability.
Berliany Nuragnia, 2015
Analysing Student’s Understanding on Urinary System through Paper Pencil Test and Concept Map
Berliany Nuragnia
International Program on Science Education (IPSE)
ABSTRAK
Berliany Nuragnia, 2015
CHAPTER I INTRODUCTION A. Background
Science teaching has changed from a text-based to an activity based
(hands-on) approximation. Since the methodologies used to teach science
have changed, the way we assess what students are learning also needs to
be modified. . “Authentic” assessments are intended to provide evidence
about what students know and can do in a subject matter (Shavelson Lang
and Lewin, 1994). There is should be techniques that provide more or less direct measures of students‟ knowledge structures. Techniques, namely, concept maps, probe perceived concept relatedness more directly by
having students build graphs or trees and make explicit the nature of the
links between concept pairs (Shavelson Lang and Lewin, 1994). Stoddart
(2000) selected concept map as assessment tools because the technique
could be used with a wide range of content and with students at all grade
levels.
Objective test as assessment has its limitation as it mostly only cover
lower level of cognitive and high possibility of student to make
speculation of answer. In subjective test the limitation is because of its low
reliability and validity (Arikunto, 2003). Other than that the quality of responses may be influenced by a variety of factors that have nothing to do with knowledge that being assessed (McClure, Sonak and Suen, 1999). As
assessments using objective and subjective test have some limitation,
McClure, Sonak and Suen (1999) suggest that assessments based on
concept mapping tasks may strike a balance between desired objectivity
and sensitivity to the structure of students‟ knowledge.
Remembering the concept is most common way of learning done by
students these days. Generally, pupils memorize the content and reproduce
the same to pass the examination. In such an environment creative
thinking, interest in inquiry activities and other skills for example problem
help student develop skills like mentioned above Concept Mapping is the
right technique to choose (Dahaka, 2012). Ahuja (2013) stated that the
process of finding science is more important than the product itself,
because the way of exploring the truth and knowledge always given more
preference than memorization or gaining knowledge of the accumulated
facts. One potential of finding is “concept mapping”. Concept map
constructed by a student is interpreted as representing important aspects of
the organization of concepts in that student‟s memory or cognitive
structure (Shavelson Lang and Lewin, 1994).
Concept mapping method was developed by Joseph Novak‟s research team in early 1970s. As concept map is about finding relation between
every concept, meaningful learning is occurred while constructing concept
map. Pie, Tamarit and Portero (2011) stated that method of concept map is
based on the meaningful learning theory of Ausubel and it assumes that
learners construct knowledge, being already influenced by previous
knowledge. Because concept map is hierarchical this will help student in
processing meaningful learning. When meaningful learning take place
there is some change in our cognitive structure, it modify the previous
concept and relate it with the new one so the learning remain more time
and it can be applied by the student in daily life.
Concept map as have various potential function. According to Novak‟s
remarks, we may organize the potential of concept mapping to improve
science education into four categories; as a learning strategy, as an
instructional strategy, as a strategy for planning curriculum, and as a
means of assessing students „understanding of science concepts (McClure,
Sonak and Suen, 1999). As concept maps can be used as a knowledge
representation tool to reflect relationships that exist between concepts that reside within an individual‟s long-term memory (Lawson and Hershey, 2002). Concept mapping can detect the extent of understanding of
3
Berliany Nuragnia, 2015
measures are able to reflect differences in the concept and propositional
knowledge of students (Ahuja, 2013).
Table1.1 Correlations between Concept Map Scores and Measures of Achievement and Ability
Achievement/Ability Correlation
Essay test on unit 0.69
Stanford Science Achievement
Test
0.66
School science grades 0.49
Otis Lennon School Ability Test 0.74
(Anderson & Huang: 1989)
As shown in Table 1.1 Several studies show that concept map has
strong relation with students‟ cognitive. The use of concept map as
potential assessment tools is in line with concept map function as
knowledge representation tool (Lawson and Hershey, 2002). In this
research correlation between concept map and paper pencil test in learning
urinary system is being investigated. Investigation including whether there
is significant correlation or not between concept map and students‟ paper
pencil test as paper and pencil test is commonly use to assess student
understanding. While, according to Arikunto (2013) paper and pencil test
that used to assess student mostly limit in lower cognitive level (C1-C3).
In this research paper and pencil test that consist of essay (subjective test)
and multiple choice (objective test) will be involve higher level of
cognitive. As McClure, Sonak and Suen (1999) stated that concept map
can balance the objective and subjective test assessment, the profile of
student concept map and paper pencil test is also investigated.
Urinary system is one concept that shows how science is integrated
and work together to make a system work. In urinary system there is a lot
of concept involve that would make student difficult to memorize all
concept. Making concept map can help student in organizing the concept
tools (Pie, Tamarit and Portero, 2011). Student should be able to identify
the relation between every concept in order to know how this concept can
work together to function a system.
In learning urinary system there is some integration of concept.
Biology is not the only concept that involve in learning urinary system.
Some concepts about diffusion and transport active is involving physic
concepts. According to Dahaka (2012) concept map shows the
relationships among concepts that would help student to find
inter-relationships among concepts. Concept map also expected to be able to
help student to explore more about this topic using their previous
knowledge as concept map underlined theory of meaningful learning.
B. Research Problem
The research problem of this study is “How is The Profile of Student‟s
Understnding on Urinary System through Paper Pencil Test and Concept Map?”
C. Research Question
Elaborating the research problem, the research attempts to explore b
following questions:
a. How is the profile of students‟ understnding on learning urinary system
through paper and pencil test based on its cognitive process and
concept?
b. How is the profile of students‟ understnding on learning urinary system
through concept map sored based on its leglibility, accuracy,
completeness and sophistication?
c. Is there any correlation between student paper pencil test and concept
map on learning urinary system?
d. What factor explains the correlation between students‟ pencil paper test
and concept map in learning urinary system?
5
Berliany Nuragnia, 2015
D. Limitation of Problem
In order to make the research become more focused, the problem is
limited as follow:
a. Students understanding is analyzed through the profile of concept map
includes its leglibility, accuracy, completeness and sophistication that scored based on Mullers‟ Classroom Concept Map Rubric. Profiling also include concept of urinary system that used by students in
constructing their concept map. Profiling of paper and pencil test was
based on its level of cognitive and concept in urinary system.
b. Correlation of paper and pencil test and concept map is analyzed by
Spearman Correlation Coeficeient.
E. Research Objective
This research objective is specified as follow:
a. To investigate the profile of student‟s understnding on urinary
system through paper and pencil test.
b. To investigate the profile of student‟s understndings on learning
urinary system through concept map.
c. To investigate whether there is correlation between student concept
map and paper pencil test in learning urinary system.
d. To investigate factors in correlation between student concept map
and paper pencil test in learning urinary system.
F. Research Benefit
The result of this study is expected to provide the following benefits:
a. For teacher, this research is expected to be a reference for teacher in
using concept map in learning to improve students‟ cognitive and
motivation.
b. For students, helping the students to construct the concept of urinary
c. For another researcher, hope this research can be material of study in
using concept map for different variable and problem.
G. Organization Structure of Research Paper
In order to get organized structure of paper, this research paper is
arranged based on the following organization structure:
1. Chapter I : Introduction
This chapter describes about the background of the research and
continue to the problem proposed as well as its limitation. This
chapter also explains the aim of the research and also the significance
of the research in the same field of study.
2. Chapter II: Literature Review
This chapter explains some literatures and supportive theories of the
research. The basic explanation of concept map, the use of concept
map in assessment and the concept that is being investigate; urinary
system.
3. Chapter III : Methodology
This chapter explains about research procedures, research object, the
type of research, how the data are being collected, the instruments
used, and the research plot.
4. Chapter IV : Result and Discussion
In this chapter, the interpretation of all of the research data is served.
Then the discussion are followed after, it analyses the result of
research and its correlation between the result and the theories.
5. Chapter V : Conclusion and Recommendation
This is the last chapter of this research, all of research questions are
concluded based on the result. The suggestion that derived from
difficulties and obstacles found in this research are shared in
Berliany Nuragnia, 2015
CHAPTER III METHODOLOGY A. Research Method and Research Design
1. Research Method
The study applied descriptive research method to the use of
concept map as assessment tool on urinary system. According to Best,
descriptive research is concerned with how or what is exists related to
some preceding event that has affected a present condition or event
(Cohen et al., 2007). In this research, data was gathered by conducting
paper and pencil test and concept map scoring. The score of students’
paper and pencil test and concept map were analysed and used to find
the correlation between two variables.
2. Research Design
In this research correlation design is used. According to Gay, Mills
and Airasian (2009) correlation research involves collecting data to
determine whether, and to what degree a relation exist between two or
more quantifiable variable.
B. Population and Sample
1. Research Location and Period
The location of this research is International Junior High School in
Bandung in the School period of 2014/2015. This school uses English
as the formal language of instruction and applies Cambridge
Curriculum in combined with National Curriculum and their own
curriculum. This school mostly combines Cambridge and National
Curriculum for science subject.
2. Population and Sample
The population of this research was all 8th grade students. The
samples are 26 students in from 8th grade. The sampling technique that
implemented is convenience sampling or accidental sampling. Gay,
Mills and Airasian (2009) stated that convenience sampling is the
In order to avoid misconception about this research, some operational
definition is explained. Those terminologies are explained as follow:
1. Definition of concept map is a visual representation of the
relationships between concepts held by an individual, materials of a
lecture, textbook, or laboratory exercise. In conducting learning
process, concept map is constructed manually by student in a piece of
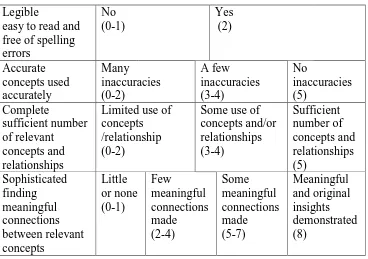
paper. The score of student’s concept map was gathered as data. Concept map would be scored by Mueller’s Classroom Concept Map Rubric that has four aspect of assessment: legibility, accuracy,
completeness and sophistication.
2. Paper and pencil test was constructed by 20 multiple choice question
and four essay questions. Multiple choice questions were constructed
by cognitive domain C1 until C5 while essay question construct by C3
until C6 cognitive process. Paper and pencil instrument will be testing
its validity by expert judgement and ANATES. Essay item test was
scored based on the indicator. The score of multiple choice and essay
objective test were then combined and use as the data.
3. Cognitive that is being measured in this research involves level of
cognitive remembering (C1), understanding (C2), applying (C3),
analysing (C4), evaluating (C5) and creating (C6) based on Taxonomy
Bloom from Anderson (2001). This competence is measured by using
multiple choice and essay question of paper and pencil test.
D. Research Instrument
In this research, instrument is necessary to be used for gaining
data. There are two type of instrument that is used in this research. Those
instruments are described below.
1. Objective and subjective test is used as an evaluation to measure the students’ cognitive after learning urinary system.
2. Concept map rubric is proposed to determine the score of students’
29
Berliany Nuragnia, 2015
3. Guidance of interview is purpose to guide in collecting data through
interview.
1. Design of Research Instrument
a. Objective and Subjetive Test Instrument
Objective test is in a form of multiple-choice questions. This
objective test is used to see student cognitive after learning urinary
system concept. There are six cognitive process that used in
multiple-choice and essay questions; there are remembering (C1),
understanding (C2), applying (C3), analysing (C4), evaluating (C5)
and creating (C6). Multiple choice questions consist of five cognitive
domains remembering (C1), understanding (C2), applying (C3),
analysing (C4), and evaluating (C5). While essay question consist of
four cognitive domains applying (C3), analysing (C4), evaluating (C5),
and creating (C6).
All of the test item has been judged by experts and then analysed
using ANATES statistical software after tested to 9th grade students.
The result of the test items after tried out was used, revised or deleted.
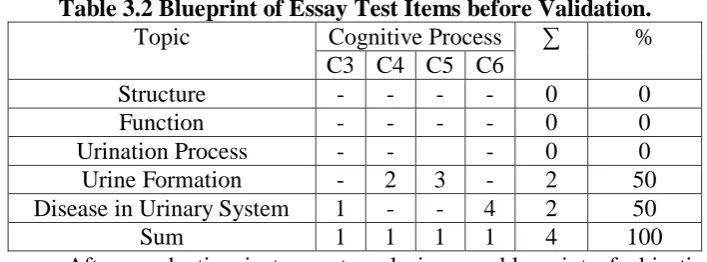
The blueprint of objective question before conducting instrument
analysis is shown in Table 3.1 and 3.2.
Topic Cognitive Process ∑ %
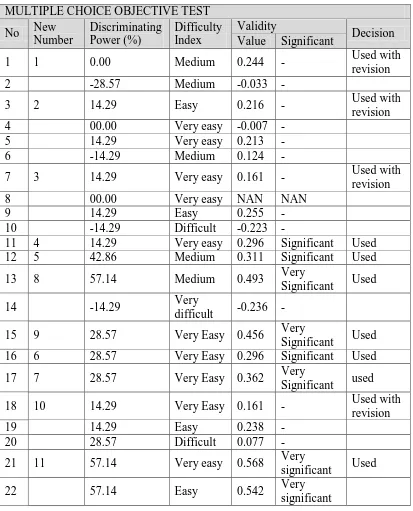
After conducting instrument analysis, new blueprint of objective
test is gained and used as research instrument. The result of research
analysis is attached in appendix. From 41 questions that have been judged
and revised 20 questions are used. While for essay item test from four
questions, all of them are used and revised. The blue prints of test items
after instrument analyses are shown in the Table 3.3 and 3.4.
Table 3.3 Blueprint of Multiple Choice Test Items after Validation.
Topic Cognitive Process ∑ %
Table 3.4 Blueprint of Essay Objectives Test Items after Validation.
31
Berliany Nuragnia, 2015
Table 3.5 Table of Mueller’s Classroom Concept Map Rubric. Legible
regarding about students impression in constructing concept map
and doing paper and pencil test.
2. Instrument Analysis
The objective test instrument is used to measure student’s
cognitive. The analysis of instrument will be covers validity,
discriminating power, level of difficulty, and reliability.
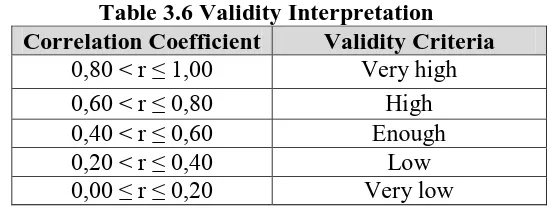
a. Validity
Validity is defined as the extent to which the instrument
measures what it is designed to measure that emphasize on not
on the test itself, but on the result (Arikunto, 2003). According
to Arikunto (2003) to get valid result of the activity, the
instrument that will be used must be valid. The validity that
cognitive based on learning objective. To determine the number
rxy = items correlation coefficient.
∑ = sum of total score of all student for each question’s item. ∑ =sum of total scoreof all students for whole test.
Y = total score of each student.
X = items scores.
N = amount of subject.
(Arikunto, 2003)
Table 3.6 Validity Interpretation Correlation Coefficient Validity Criteria
0,80 < r ≤ 1,00 Very high
defined as the extent to which an instrument produce the same
result on repeated trials. Reliability tends to a definition about
trust instrument that is used as collecting data tools. To define
the reliability of objective test, alpha formula will be used as a
formula because the question using multiple question
33
Berliany Nuragnia, 2015
Where,
r11 : Instrument reliability
n : Amount of question
because it can make student depressed and do not motivated to
solve the problem. The good question is the question that has
easy, medium and difficult item on it.
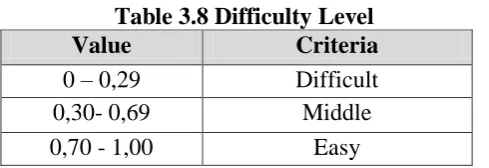
To show the difficulty level of the question, difficulty index
can be used to show the difficulty level of question. The range
of level of difficulty is from 0,00 to 1,00. The lower the index
then the question is more difficult and vice versa. To find out
the difficulty index the formula that is used is shown below:
JS B P
Where,
P =Difficulty index
B =Number of students who answer the question correctly
JS = Number of all students who join the test
Value Criteria 0 – 0,29 Difficult
0,30- 0,69 Middle
0,70 - 1,00 Easy
(Arikunto, 2003) d. Discriminating power
Decimating power is define as ability of particular question
to distinguish student who classified as higher achiever and
lower achiever the amount of higher achievement student
compared to lower achievement student means that those
question have positive discriminating power index (Arikunto,
2003). Discriminating power index show the scale from minus
one until positive one, with the negative one represent the
lower discriminating power index. The formula is represented
below.
Where:
DP= discriminating power
Ba= the number of upper group that answer correctly
Ja= total of student in upper group
Bb= the number of upper group that answer incorrectly
Jb= total of student in lower group
(Arikunto, 2003)
Table 3.9 Classification of Discriminating Power
D Classification
0,00 – 0,20 Poor
0,21 – 0,40 Satisfactory
0,41 – 0,70 Good
0,71 – 1,00 Excellent
(Arikunto, 2003) e. Distractor
In multiple choice item tests, there is one right answer and
35
Berliany Nuragnia, 2015
to make student attract to that option. In determining whether
the distractor is good or no, we use this formula.
(Arikunto, 2003)
The summary of all instrument data analysis is displayed in Table 3.10.
Table 3.10 Summary of Instrument Data Analysis Result
37
Berliany Nuragnia, 2015
E. Data Analysis
In this research the data is processed in quantitatively and
supported by qualitative data. Quantitative data processing is used for
measuring both students’ paper pencil and concept map.
1. Quantitative Data Analysis
Quantitative data analysis is done by Microsoft excel and SPSS
calculation, in order to determine the score of pre-test and post-test. Then
the result of the data will be processes as the following explanation.
a. Scoring test items
The first step to process data is scoring the test items. The test
items are provided in the 20 number of multiple choice questions and
four essay questions. The result will be scored, and the scores were
processed using Microsoft excel. . Full score of multiple choice will be
20 while essay 30. To determine the final score of objective test as
follow.
b. Scoring Concept Map
The second step is to process the scoring of student’s concept map. Student’s concept map is cored based on Mueller’s Classroom Concept Map Rubric. The scoring aspect is about the legibility, accuracy of concept
used, the completeness of concept and the relation between every concept.
The scores are processed using SPSS statistic 19.
c. Normality Test
Normality test is use to know whether the sample comes from
population that has normal distribution or not (Ghasemi and Zahediasl,
Determining the correlation coefficient is needed to analyse
whether or not there is correlation between students’ paper pencil test and
concept map. The analysing process is using non parametric statistic
Spearman rank correlation. According to Simon and Goes (2011)
Spearman rank correlation can be use to analyse the data that has less
than 30 samples. Spearman rank correlation is used if the data at least
one variable is an ordinal data (Gay, Mills and Airasian: 2009).
According to Simon and Goes (2011) the formula of Spearman rank
correlation is:
∑
Where,
rs = spearman coeficient
di =difference in the ranks given to the two variable values
n = amount of data
(Simon and Goes, 2011)
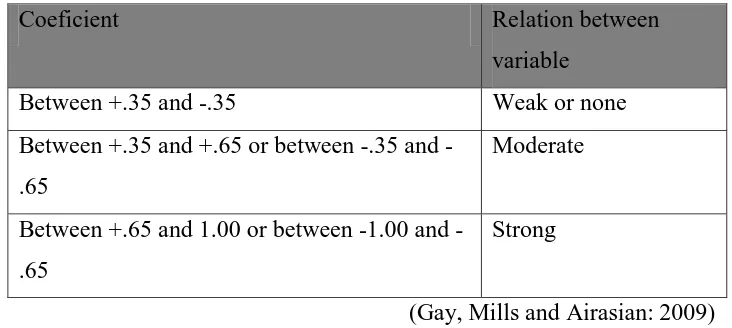
The spearman coefficient then will be interpreted to identify
whether or not there is correlation between two variables. One way to
interpret the correlation coeficient is shown in Table 3.11.
Table 3.11 Interpreting Correlation Coefficient Chart.
Coeficient Relation between
variable
Between +.35 and -.35 Weak or none
Between +.35 and +.65 or between .35 and
-.65
Moderate
Between +.65 and 1.00 or between 1.00 and
-.65
Strong
(Gay, Mills and Airasian: 2009)
Based on figure below, there are three types of association pattern;
39
Berliany Nuragnia, 2015
relationship of score where the low (or high) the score on one variable
relate to how low (or high) score on the other variable (Creswell, 2007).
Figure 3.1 Pattern of Association Between Two Variables. (Source: aqq.auburn.edu)
Creswell (2007) stated that a curvilinear distribution shows
increase, plateau, and decline in Y- axis variable with increasing in
x– axis variable or increase, plateau, and decline in Y- axis
variable with increasing in – axis variable decrease, plateau, and
increase in Y- axis variable with increasing in X– axis variable.
While no correlation relationship shows the distribution of
variables that independent each other. A particular score in one
variable does not predict or tells us any information about the
possible score on the other variable.
F. Research Procedure
There are three stages of procedure consist of preparation stage,
implementation stage and completion stage. Those three stages will be
In this stage researcher prepare everything that will be needed for
the implementation of this research. In this stage, the researcher
conduct several stages that support the research, the steps will be
explained as follow:
a. Conducting literature study.
This part is an initial step that conducted to gain actual
information related to the theories and research problem. These
data can be taking from compatible resources, such as the latest
book, journal, articles, etc.
b. Choose the topic for implementing research.
c. Analysing the concept.
d. Conducting prior study.
It can be done by examining schools’ archived file about students achievement in science subject and observe how the
lesson conducts in the classroom.
e. Determine the research sample.
f. Construct and justify the instrument.
2. Implementation Stage
a. Administration the instrument.
b. Take data of student concept map.
c. Conducting objective test.
d. Scoring the data of student’s paper pencil test and concept map.
3. Completion stage a. Data analysis.
b. Draw conclusion.
c. Give suggestion for further research.
41
Berliany Nuragnia, 2015
REFERENCES
Ahuja, A. (2013). Concept Mapping as an Effective Teaching Practice in Science in Education. An International Journal of Educational Technology. 3 (1), 27-32. [Online]. Retrieved from http://jiw.indianjournals.com/. [Accessed on September 18, 2013].
Alonso, J., & Araya, C. (2008). Concept Mapping as an Assessment Tool in Higher Education Activities. [Online]. Retrieved from http://cmc.ihmc.us/. [ Accessed on June 29, 2015].
Anderson, L. W., et al. (2001). A Taxonomy for Learning, Teaching and Assessing. United States: Addison Wesley longman.
Anderson, T.H., & Huang, S-C.C. (1989). On Using Concept Maps To Assess The Comprehension Effects of Reading Expository Text. [Online]. Retrieved from www.ideals.illinois.edu. [Accessed on June 29, 2015].
Arikunto, S. (2003). Dasar- Dasar Evaluating Pendelikon. Bandung: Bumi Aksara.
Asan, A. (2007). Concept Mapping in Science Class: A Case Study of fifth grade students. Educational Technology & Society, 10 (1), 186-195. [Online]. Retrieve from http://ifets.info/journals/10_1/17.pdf. [Accessed on September 8, 2014].
Chiou, C.C. (2008). The Effect of Concept Mapping on Students’ Learning
Achievements and Interests. Innovations in Education and Teaching International. 45 (4), 375-387. [Online]. Retrieved from http://eric.ed.gov/?id=EJ813831. [Accessed on September 8, 2014].
Cohen et al. 2007. Research Methods in Education. New York: Routledge Taylor
and Francis Group. [Online]. Retrieved from
http://knowledgeportal.pakteachers.org [Accessed on October 17, 2014].
Creswell, J. W. (2012). Educational Research. Boston: Pearson Education.
Dahaka, A. (2012). Concept Mapping : Effective Tool in Biology Teaching. Technical and Non- Technical International Journal. 3 (6), 225-230. [Online]. Retrieved from http://www.vsrdjournals.com [Accessed on September 8, 2014].
78
Berliany Nuragnia, 2015
Douquia A. and Narod F. B. (2009). Study on the Use of Concept Map in Teaching of ‘Chemical Periodicity’ at Upper Secondary Level. Chemistry Education in ICT Age.161-184. [Online]. Retrieved from http://books.google.co.id. [Accessed on June 28, 2015].
Gay L. R., Mills G. E., & Airasian P. (2009). Educational Research Competencies for Analysis and Application. New Jersey: Perason Education.
Ghasemi A. and Zahediasl S. (2012). Normality Tests for Statistical Analysis: A Guide for Non-Statisticians. Int J Endocrinol Metab. 10(2), 486-289. [Online]. Retrieved endometabol.com . [Accessed on June 30, 2015].
Hauke J. and Kossowski T, (2011). Comparison of Values of Pearson’s and
Spearman’s Correlation Coefficients on The Same Sets of Data. [Online]. Retrieved geoinfo.uma.edu.pl. [Accessed on May 31, 2015].
Jacobsen D. A. and Eggen P. (2009). Methods for Teaching. Boston: Pearson Education.
Jacobs-Lawson, J.M., & Hershey, D.A. (2002). Concept maps as an assessment tool in psychology courses. Methods & Techniques, 29(1), 25–29. [Online]. Retrieved from http://top.sagepub.com/content/29/1/25.short. [Accessed on November 22, 2013].
Jennings D. (2012). The Use of Concept Maps for Assessment. [Online]. Retrieved from http://www.ucd.ie/t4cms/UCDTLA0040.pdf. [Accessed on May 31, 2015].
Keller, J. (2000). How to Integrate Learner Motivation Planning Into Lesson Planning: The ARCS Model Approach. [Online]. Retrieved from http://apps.fischlerschool.nova.edu. [Accessed on October 18, 2014].
Kementerian Pendidikan dan Kebudayaan. (2013). Kurikulum 2013: Kompetensi Dasar Sekolah Menengah Pertama (Smp)/ Madrasah Tsanawiyah (Mts). Jakarta: Kemdikbud.
Kiliç, M. And Çakmak, M. (2013). Concept Maps as a Tool for Meaningful Learning and Teaching in Chemistry Education. International Journal on New Trends in Education and Their Implications. 4 (4), 152-164. [Online]. Retrieved from http://www.ijonte.org/. [Accessed on September 8, 2014].
McClure J. R., Sonak B. and Suen H.K. (1999). Concept Map Assessment of Classroom Learning: Reliability, Validity, and Logistical Practicality. Journal of Research in Science Teaching. 36 (4), 475–492. [Online]. Retrieved from http://suen.educ.psu.edu/~hsuen/pubs/conceptmap99.pdf [Accessed on June 09, 2014].
Minium, E., King, B. M., & Bear, G. (1993). Statistical Reasoning in Psychology and Education. Canada: John Wiley & Son.
Neville V., Bennett S. & Lockyer L. (2009). Teacher Education Students' Use of Concept Maps As Cognitive Tools Within Assessment. [Online]. HERDSA 2009 Conference. 6-9 July 2009. Retrieved from http://www.ipsepress.org/.
Novak, J. D. (2008). Concept Map. [Online]. Retrieved from: http://cmap.ihmc.us/Publications/ResearchPapers/TheoryCmaps/TheoryUnd erlyingConceptMaps.htm. [Accessed on September 04, 2014].
Novak, J. D. and Cañas, A. J. (2008). The Theory Underlying Concept Maps and How to Construct and Use Them. [Online]. Retrieved from http://cmap.ihmc.us/. [Accessed on September 4, 2013].
Piá, A.B., Blasco-Tamarit, E., & Muñoz-Portero, M.J. (2011). Different applications of concept maps in Higher Education. Journal of Industrial Engineering and Management, 4(1), 81-102. [Online]. Retrieved from http://www.jiem.org/ . [Accessed on September 18, 2013].
Pickard, M. J. (2007). The New Bloom’s Taxonomy: An Overview for Family
and Consumer Sciences. Journal of Family and Consumer Sciences Education. 25(1), 45-55. [Online]. Retrieved from http://uncw.edu/cas/documents/PickardNewBloomsTaxonomy.pdf.
[Accessed on October 18, 2014].
Poulsen, A., et al. (2008). ARCS Model of Motivational Design. [Online]. Retrieved from http://torreytrust.com/images/ITH_Trust.pdf. [Accessed on October 18, 2014].
Priadi A. (2009). Biology 2 for Senior High School. Jakarta: Yudistira.
Reece, J. B., et al. (2012). Campbell Biology. San Francisco: Pearson Benjamin Cummings.
80
Berliany Nuragnia, 2015
Schunk D. H. (2012). Learning Theory an education perspective. Boston: Pearson Education.
Shavelson R. J., Lang H. and Lewin B. (1994). On Concept Maps as Potential
“Authentic” Assessments in Science. .[Online]. Retrieved from
http://www.cse.ucla.edu/products/Reports/TECH388.pdf. [Accessed on June 09, 2014].
Simon M. K. and Goes J. (2011). Correlational Research. [Online]. Retrieved from www.dissertationrecipes.com. [Accessed on June 06, 2015].
Stoddart T. et al. (2000). Concept Maps as Assessment in Science Inquiry Learning - A Report of Methodology. The International Journal of Science Education. 22 (12), 1221-1246. [Online]. Retrieved from http://www.researchgate.net. [Accessed on June 9, 2015].
Sumarwan, et al. (2010). Science for Junior High School. Jakarta: Erlangga.
Tavares R. (2010). Concept Map Under Modified Bloom Taxonomy Analysis. Concept Maps: Making Learning Meaningful. 34-39. [Online]. Retrieved from http://cmc.ihmc.us/.[Accessed on May 31, 2015].
Taylor-Powell E. and Steele S. (1996). Collecting Evaluation Data: Direct Observation. [Online]. Retrieved from learningstore.uwex.edu. [Accessed on May 31, 2015].