Applied Mathematical Sciences, Vol. 7, 2013, no. 104, 5185 - 5191 HIKARI Ltd, www.m-hikari.com
http://dx.doi.org/10.12988/ams.2013.212669
Conversion of Images into Numerical Models
to Determine the Condition of Breast Health
on Contralateral
Anak Agung Ngurah Gunawan1, Suhariningsih2,
K.S.P. Triyono 3 and Yasin2
1
Department of Physics, University of Udayana at Bali, [email protected]
2
Department of Physics, University of Airlangga at Surabaya, [email protected] , [email protected]
3
Department of Medical, University of Airlangga at Surabaya, [email protected]
Copyright © 2013 Anak Agung Ngurah Gunawan et al. This is an open access article distributed under the Creative Commons Attribution License, which permits unrestricted use, distribution, and reproduction in any medium, provided the original work is properly cited.
Abstract
5186 Anak Agung Ngurah Gunawan et al.
many advantages and benefits in determining the condition of breast health, such as in determining the breast health percentage. Detection of micro-calcification has been developed by scientists using different methods of digital image processing. In this study, mathematical equations have been developed to determine the breast health by converting images to numerical models based on pixels intensity values that exist on a mammogram. The method uses the gray level image structure characteristics which are referred to as the physical quantity of the film. Linear regression analysis was used for the model analysis and physician collaboration was used to develop the phase suspicious maker. The results show that the conversion of images into numerical models is capable in determining the health condition of the contralateral breasts with a sensitivity of 93.75%.
Keywords: mammographic, breast cancer, numerical based
1. INTRODUCTION
Conversion of images into numerical models 5187
2. MATERIALS AND METHODS
A. Acquitions of Data
Mammograms were taken as 345 pieces consisting of 200 pieces of healthy and 145 pieces of sick pixels by mammography equipment from a Kodak brand, dryview 6900 laser imager. The mammogram was sampled with a size of 2x2 cm, and stored in bmp format with α = 1%.
B. Pixel Intensity
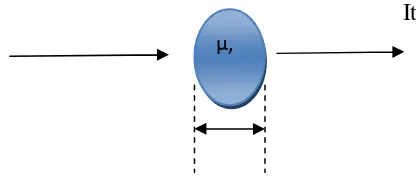
The pixels’ intensity values of the diseased and healthy breast are different. The relationship between the intensity of the rays on a material can be written as [3], [9].
Io It
L
Figure 1. Radiation Intensity Regarding Material
It = I0 e – L (1)
where It, I0, , and L are the intensity of beam that is passed, the initial beam
intensity of light, absorption coefficient, and the thickness of material respectively. When equation (1) is taken into the logarithmic function then the following is obtained
ln It = ln I0 - L (2)
So the thicker the tumor, the smaller the intensity of the light that is being transmitted and the pixel intensity values (gray level) becomes higher and nearly white. For example, black and white image with 256 levels means having a gray scale from 0 to 255, whereby the value of 0 indicates the intensity of black, and the value of 255 indicates the intensity of white, whereas the values between 0 to 255 indicate gray levels between black and white.
C. The Physical Quantity of Film
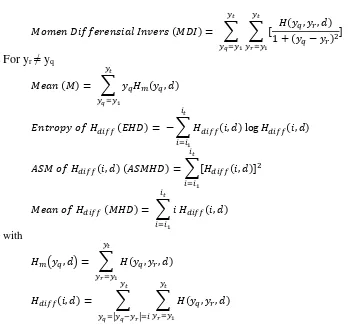
There are 6 physical quantities of film that can determine the health condition of the breast, such as [1], [2]:
Anguler Second Moment ASM , , 2
1 1
5188 Anak Agung Ngurah Gunawan et al.
where H (yq, yr, d), yq, yr, d are the second-order histogram that describes the distribution of probability of occurrence of a pair of gray-level, the gray-level value of the first pixel, the gray-level value of the second pixel, and the distance between the first pixel and the second pixel, respectively.
D. Logistic Regression
A logistic regression equation which was derived by A.A.N. Gunawan, et al. [1] has been used to determine the condition of the breast health as follows:
Z = constan + B1*E[1] + B2*E[2] +...+ Bn.*MHD[10].
Probability of sick breast =CDECF G
Probability of healthy breast = 1 - probability of sick breast.
3. RESULTS AND DISCUSSION
Conversion of images into numerical models 5189
patients need to be closely supervised due to the higher risk of their contralateral breasts being exposed to Breast cancer.
(a) (b) (c)
Figure 2. (a) Mammogram With Health Conditions of 42.35%, (b) Mammogram With Health Conditions of 68.69%, (c) Mammogram With Health Conditions of 69.43%.
The images above were used to obtain the following mathematical equations in order to determine the condition of breast health in contralateral:
Z = 108.964 + 88765.681*ASM[9]99556.645*ASM[10]+330.379*MDI[4] -533.728*MDI[8]
+ 475.168*MDI[10]-6.533*M[1]+ 6.621*M[2] + 51.669*EHD[1] +338.769*EHD[4] -431.625*EHD[5] + 400.142*EHD[9]-298.500*EHD[10]+1355.055*ASMHD[3]-
1419.594*ASMHD[6] +2678.572* ASMHD[9] 2353.201* ASMHD[10] -3.073*MHD[2]+2.138*MHD[4];
The Range Value of Healthy and Sick Breast
Variable Physical Film Healthy Sick
ASM[9] 0.00019 – 0.00364 0.00014 – 0.00079
ASM[10] 0.00020 – 0.00367 0.00014 – 0.00078
MDI[4] 0.03378 – 0.11397 0.02125 – 0.08507
MDI[8] 0.02511 – 0.10759 0.01747 – 0.07595
MDI[10] 0.02298 – 0.10736 0.01697 – 0.06716
M[1] 51.74554 – 143.60709 49.99053 – 212.90518
M[2] 51.73841 – 143.38166 50.13379 – 213.02914
EHD[1] 1.07534 – 1.55538 1.15998 – 1.70576
EHD[4] 1.17921 – 1.74298 1.27110 – 1.95262
EHD[5] 1.18965 – 1.77575 1.28627 – 1.99489
EHD[9] 1.20002 – 1.85869 1.34996 – 2.10303
EHD[10] 1.20175 – 1.87342 1.36641 – 2.12346
ASMHD[3] 0.02169 – 0.08100 0.01628 – 0.06553
ASMHD[6] 0.01884 – 0.07881 0.01266 – 0.05781
ASMHD[9] 0.01634 – 0.07672 0.01049 – 0.08840
ASMHD[10] 0.01576 – 0.07700 0.00983 – 0.04920
MHD[2] 4.92724 – 16.30138 6.54708 – 24.59870
5190 Anak Agung Ngurah Gunawan et al.
Probability of sick breast = C
CDEF G
Probability of healthy breast = 1 - probability of sick breast.
4. CONCLUSION
The following conclusions can be made from the results of the conversion of the image to numerical model in determining the breast health condition:
1) Conversion of images into numerical models were capable in determining the health condition of the contralateral breasts with a sensitivity of 93.75%.
2) There are 18 factors of the physical quantities which were used to determine the contralateral breast health, such as ASM [9], ASM [10], MDI [4], MDI [8], MDI [10], M [1], M [2], EHD [1], EHD [4], EHD [5], EHD [9], EHD [10], ASMHD [3], ASMHD [6], ASMHD [9], ASMHD [10], MHD [2], and MHD [4].
3) Patients with contralateral health below 70% need to be closely monitored due to the higher possibility of Breast cancer being contracted.
REFERENCES
[1] A.A.N. Gunawan, Suhariningsih, K.S.P. Triyono, and B. Widodo, Determination of physical parameter model for the photo film mammographic X-ray results on the breast cancer histology classification, International Journal Of Contemporary Mathematical Sciences, ISSN 1312-7586, vol. 45, no. 7, pp. 2235-2244, 2012.
[2] Atam P. Dhawan, Yateen Chitre, Christine Kaiser-Bonasso, and Myron Moskowitz, “Analysis of mammographic microcalcifications using gray-level image structure features,” ieee transactions on medical imaging, vol. 15, no 3, pp. 246-259, june 1996.
[3] Atkin Peter and de Paule Julio, 2011, eBooks, Elements Of Physical Chemistry Fifth Edition, Oxford University Press.
[4] Bhagwati Charan Patel and G.R.Sinha,” An adaptive k-means clustering algorithm for breast image segmentation,” International Journal of Computer Applications (0975 – 8887), Vol. 10– N.4, pp. 35-38, November 2010.
Conversion of images into numerical models 5191
[6] B. Senthilkumar, G. Umamaheswari,” A novel edge detection algorithm for the detection of breast cancer,” European Journal of Scientific Research, ISSN 1450-216X, Vol.53, No.1, pp. 51-55, 2011.
[7] Fatima Eddaoudi, Fakhita Regragui,” Microcalcifications detection in mammographic images using texture coding,” Applied Mathematical Sciences, Vol. 5, no. 8, pp. 381 – 393, 2011.
[8] Fatima Eddaoudi, Fakhita Regragui, Abdelhak Mahmoudi, Najib Lamouri,” Masses detection using SVM classifier based on textures analysis,” Applied Mathematical Sciences, Vol. 5, No. 5, pp. 367-379, 2011
[9] H.B. Kekre, Tanuja K. Sarode, Saylee M. Gharge,” Tumor detection in mammography images using vektor quantization technique,” International Journal of Intelligent Information Technology Application, Vol.2(5), pp237-242, 2009.
[10] Hinna Hamid, 2007, Pharmaceutical Analysis, Infrared Spectrometry, New Delhi-110062, pp. 1 – 26.
[11] L.S.S.Reddy, Ramaswamy Reddy, CH.Madhu & C. Nagaraju, “A novel image segmentation technique for detection of breast cancer,” International Journal of Information Technology and Knowledge Management, Volume 2, No. 2, pp. 201-204, July-December 2010.
[12] R. Krishnamoorthy, N Amudhavalli, M.K. Sivakolundu, Identification of Microcalcifications with Orthogonal Polynomials Model, International Journal of Engineering Science and Technology Vol. 2(5),pp. 1204-1210, 2010.
[13] Rabi Narayana Panda, Dr. Bijay Ketan Panigrahi, Dr.Manas Rajan Patro,” Feature extraction for classification of microcalcifications and mass lesions in mammograms,”
IJCSNS International Journal of Computer Science and Network Security, Vol. 9, No. 5, pp. 255-265, Mey 2009.