The Global Partnership
for Development: Making
Rhetoric a Reality
MDG Gap Task Force
Report
2012
The present report was prepared by the MDG Gap Task Force which was created by the Secretary-General of the United Nations to improve the monitoring of MDG 8 by leveraging inter-agency coordination. More than 20 United Nations agencies are represented on the Task Force, including the World Bank and the International Monetary Fund, as well as the Organization for Economic Cooperation and Development and the World Trade Organization. The United Nations Development Programme and the Department of Economic and Social Affairs of the United Nations Secretariat acted as lead agencies in coordinating the work of the Task Force. The Task Force was co-chaired by Olav Kjørven, Assistant Secretary-General and Director of the Bureau for Development Policy of the United Nations Development Programme, and Jomo Kwame Sundaram, Assistant Secretary-General for Economic Development, and coordinated by Rob Vos, Director in the Department of Economic and Social Affairs of the United Nations Secretariat.
List of bodies and agencies represented on the MDG Gap Task Force
Department of Economic and Social Affairs of the United Nations Secretariat (UN/DESA)
D e p a r t m e n t o f P u b l i c I n f o r m a t i o n o f t h e
The Global Partnership
for Development:
Making Rhetoric a Reality
asdf
United Nations
New York, 2012
United Nations publication Sales No. E.12.I.5
ISBN 978-92-1-101259-0
Preface
The protracted global economic crisis has begun to take its toll on international development cooperation. Last year, official development assistance (ODA) fell for the first time in many years, while trade protectionist measures increased. There has also been too little progress in fulfilling other key aspects of the global partnership for development. While the poorest nations have received gener-ous debt relief over the past decade, many still face unsustainable obligations. Essential medicines remain too expensive and difficult to obtain in many devel-oping countries. And despite recent progress, the vast digital divide between developed and developing countries persists, in part because access to the Inter-net and mobile phones remains far too costly for low-income households.
Trade is another source of concern highlighted in this report. Negotiat-ing parties have yet to complete the Doha Round that was meant to usher in a fairer multilateral trading system. I urge negotiators to find a way out of the impasse through pragmatic approaches that seek agreement first on specific areas, such as ensuring duty-free and quota-free market access for exports from least developed countries.
At the just-concluded Rio+20 Conference, commitments were made on an ambitious sustainable development agenda. But to keep those pledges cred-ible, we must deliver on previous commitments. As a world community, we must make rhetoric a reality and keep our promises to achieve the Millennium Development Goals (MDGs).
I am convinced this can be done. Notwithstanding considerable fiscal constraints, a number of donor countries continue to meet the globally agreed target of devoting 0.7 per cent of national income to ODA or have managed to protect aid budgets. These efforts can and should be emulated. With that in mind, and given that greater transparency can help accountability, I launched the Integrated Implementation Framework in June to better track international and national support towards achieving the MDGs. The Framework is available and accessible to anyone in the world—a one-stop shop to monitor all commit-ments made by Member States to help meet the MDGs.
iv The Global Partnership for Development: Making Rhetoric a Reality
These glimmers of what can be achieved should provide encouragement and inspiration. Our challenge is to scale up these success stories and add to them so that we can achieve the promise of the MDGs to improve the well-being of the world’s poorest and most vulnerable people.
Ban Ki-moon
Contents
Page
Executive summary
Official development assistance . . . xii
Market access (trade) . . . xiii
Debt sustainability . . . xiv
Access to affordable essential medicines . . . xvi
Access to new technologies . . . xvii
Introduction
Continuing impact of the global financial and economic crisis . . . 1Is political support for the global partnership weakening? . . . 3
The case for rebuilding the global partnership . . . 4
Official development assistance
ODA commitments made in 2011 . . . 7ODA delivery in 2011 and prospects . . . 8
Allocation of ODA by countries . . . 12
Aid modalities . . . 16
ODA allocated for specific purposes . . . 18
Aid effectiveness . . . 18
ODA needs of developing countries . . . 21
Multiple modalities of development cooperation . . . 23
Figures 1. Trends in main components of ODA from DAC members, 2000-2011 . . . 9
2. ODA of DAC members in 2000, 2009, 2010 and 2011 . . . 10
3. Fiscal retrenchment and change in ODA disbursement in 2011 compared with 2010 . . . 12
4. ODA of DAC donors provided to least developed countries, 2000, 2009 and 2010 . . . 14
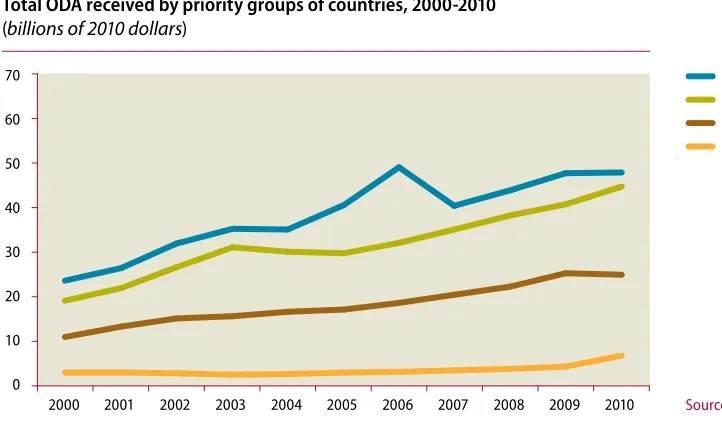
5. Total ODA received by priority groups of countries, 2000-2010 . . 15
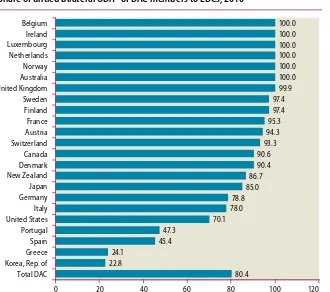
6. Share of untied bilateral ODA of DAC members, 2010 . . . 17
7. Share of untied bilateral ODA of DAC members to LDCs, 2010 . . 17
vi The Global Partnership for Development: Making Rhetoric a Reality
Page
Tables
1. Delivery gaps towards aid commitments by DAC donors, 2010
and 2011 . . . 9
2. Top aid recipients in 2010 . . . 15
Market access (trade)
Unproductive global trade negotiations . . . 27The Doha Round in deadlock . . . 27
Other international trade policy discussions . . . 29
Developing-country trade performance . . . 30
Impact of the global economic crisis . . . 30
Trade-restrictive measures . . . 30
Trade finance . . . 31
Labour movement and remittances . . . 32
Market access . . . 33
Preferential access to developed-country markets . . . 33
Preferential access to Southern markets . . . 34
Tariff barriers . . . 35
Tariff peaks and tariff escalation . . . 36
Agricultural subsidies in OECD countries . . . 37
Non-tariff measures . . . 38
Aid for Trade . . . 40
Results on the ground . . . 41
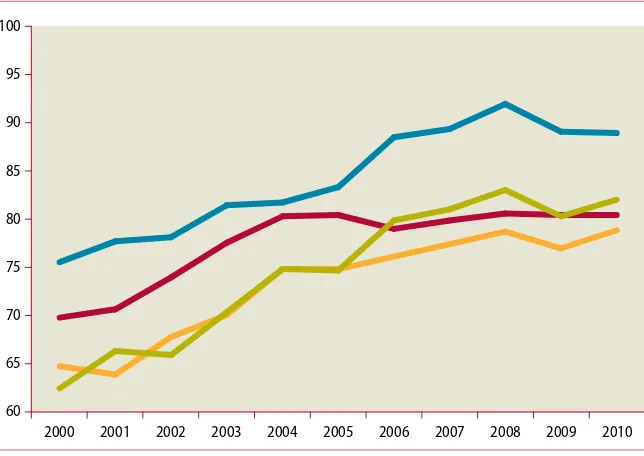
Figures 1. Proportion of developed-country imports from developing countries and least developed countries admitted free of duty, by value, 2000-2010 . . . 33
2. Proportion of developed-country imports from developing countries admitted free of duty under MFN and true preferences, by region, 2000 and 2010 . . . 34
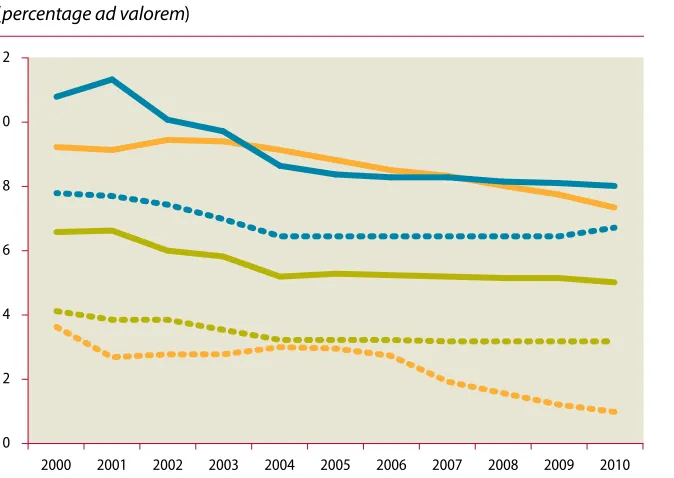
3. Average tariffs imposed by developed countries on key products from developing countries and least developed countries, 2000-2010 . . . 35
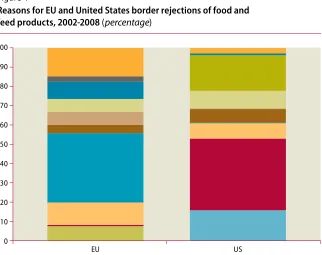
4. Reasons for EU and United States border rejections of food and feed products, 2002-2008 . . . 40
5. Aid for Trade commitments by category, 2002-2005 average and 2006-2010 . . . 41
6. Aid for Trade commitments by region, 2002-2005, 2009 and 2010 . . . 42
Tables 1. LDC market access policies of selected developing economies . . . . 35
2. Tariff peaks and escalation in high-income OECD countries, 1996, 2000 and 2006-2011. . . 37
Debt sustainability
The debt situation in developing countries . . . 46
How vulnerable are developing countries to new debt crises? . . . 48
Improving debt sustainability assessments . . . 52
Debt Sustainability Framework for low-income countries . . . 53
Debt Sustainability Analysis for market-access countries . . . 53
Progress in debt relief . . . 53
Completing the HIPC Initiative . . . 54
Future engagement of the Paris Club . . . 56
Towards an international debt workout mechanism . . . 56
Figures 1. External public debt-to-GDP ratios of developing countries, 2005-2011 . . . 47
2. External debt service-to-exports ratios, developing-country income groups, 2005-2011 . . . 48
3. External debt service-to-exports ratios, developing-country regions, 2005, 2007 and 2009-2011 . . . 49
4. Share of short-term debt in external debt, developing-country groupings, 2005-2011 . . . 49
5. Fiscal balances of low- and middle-income countries, 2005-2011 . . 51
6. Current account balances of developing countries, 2005-2011 . . . . 52
Tables 1. Debt distress risk ratings in low-income and vulnerable economies, 2009-2012 . . . 50
2. Share of developing-country external debt owed to private creditors, 2005-2011 . . . 57
Access to affordable essential medicines
New commitments made in 2011 . . . 59Availability and prices of essential medicines . . . 61
Availability and prices of antiretroviral medicine . . . 63
Affordability of essential medicines . . . 64
Other developments regarding access to essential medicines . . . 65
Local production of generic medicines . . . 65
Intellectual property . . . 67
Quality of medicines . . . 69
Research and development . . . 71
Figures 1. Median availability of selected generic medicines in public and private health facilities during the period 2007-2011 . . . 62
2. Ratio of consumer prices to international reference prices for selected lowest-priced generic medicines in public and private facilities during the period 2007-2011 . . . 63
viii The Global Partnership for Development: Making Rhetoric a Reality
3. Number of days of wage income needed by the lowest-paid government worker to pay for 30 days of drug treatment for an adult with hypertension and a child with asthma during the
period 2007-2011 . . . 65
4. Cost of generic and originator brand lopinavir/ritonavir in Eastern Europe and Central Asia . . . 68
Access to new technologies
Access to ICT services . . . 73Rapidly expanding mobile telephone and Internet services . . . 73
Wide gaps in affordability persist . . . 77
Enabling the development impact of ICT . . . 78
Trends in regulation of the ICT sector . . . 78
Increasing competition in ICT . . . 80
The role of e-government . . . 81
Increasing access to climate change technology . . . 81
Access to ICT to address climate change . . . 82
Access to information for disaster risk management . . . 83
Figures 1. Global trends in access to ICT, 2001-2011 . . . 74
2. Mobile cellular subscriptions and Internet users in developed and developing countries, 2001-2011 . . . 74
3. Number of mobile cellular subscriptions per 100 inhabitants, 2000, 2009 and 2010 . . . 75
4. Number of fixed telephone lines per 100 inhabitants, 2000, 2005 and 2010 . . . 76
5. Internet users per 100 inhabitants, 2010 . . . 77
6. Fixed (wired) broadband and mobile broadband subscriptions in developed and developing countries, 2001-2011 . . . 77
7. Mandate of regulatory authorities worldwide, 2011 . . . 79
8. Share of countries allowing competition for selected ICT services, by region, 2011 . . . 80
List of Millennium Development
Goals and Goal 8 targets and indicators
Goals 1 to 7
Goal 1: Eradicate extreme poverty and hunger Goal 2: Achieve universal primary education
Goal 3: Promote gender equality and empower women Goal 4: Reduce child mortality
Goal 5: Improve maternal health
Goal 6: Combat HIV/AIDS, malaria and other diseases Goal 7: Ensure environmental sustainability
Goal 8: Develop a global partnership for development
Targets Indicators
Some of the indicators listed below are monitored separately for the least developed countries (LDCs), Africa, landlocked developing countries and small island developing States.
Target 8.A: Develop further an open, rule-based, predictable, non-discriminatory trading and financial system
Includes a commitment to good governance, development and poverty reduction—both nationally and internationally
Target 8.B: Address the special needs of the least developed countries
Includes tariff and quota free access for the least developed countries’ exports; enhanced programme of debt relief for heavily indebted poor countries (HIPC) and cancellation of official bilateral debt; and more generous ODA for countries committed to poverty reduction
Target 8.C: Address the special needs of landlocked developing countries and small island developing States (through the Programme of Action for the Sustainable Development of Small Island Developing States and the outcome of the twenty-second special session of the General Assembly)
Official development assistance (ODA)
8.1 Net ODA, total and to the least developed countries, as percentage of OECD/DAC donors’ gross national incomes
8.2 Proportion of total bilateral, sector-allocable ODA of OECD/DAC donors to basic social services (basic education, primary health care, nutrition, safe water and sanitation)
8.3 Proportion of bilateral official development assistance of OECD/ DAC donors that is untied
8.4 ODA received in landlocked developing countries as a proportion of their gross national incomes
8.5 ODA received in small island developing States as a proportion of their gross national incomes
Market access
8.6 Proportion of total developed country imports (by value and excluding arms) from developing countries and least developed countries admitted free of duty
8.7 Average tariffs imposed by developed countries on agricultural products and textiles and clothing from developing countries
8.8 Agricultural support estimate for OECD countries as a percentage of their gross domestic product
x The Global Partnership for Development: Making Rhetoric a Reality
Goal 8: Develop a global partnership for development (continued)
Targets Indicators
Target 8.D: Deal comprehensively with the debt problems of developing countries through national and international measures in order to make debt sustainable in the long term
Debt sustainability
8.10 Total number of countries that have reached their HIPC decision points and number that have reached their HIPC completion points (cumulative)
8.11 Debt relief committed under HIPC and MDRI Initiatives 8.12 Debt service as a percentage of exports of goods and services
Target 8.E: In cooperation with pharmaceutical companies, provide access to affordable essential drugs in developing countries
8.13 Proportion of population with access to affordable essential drugs on a sustainable basis
Target 8.F: In cooperation with the private sector, make available the benefits of new technologies, especially information and communications
Executive summary
In 2007, the Secretary-General of the United Nations invited the organiza-tions of the multilateral system to form an inter-secretariat task force to better monitor implementation of the commitments commonly summarized as “Goal 8” of the Millennium Development Goals (MDGs). Since its formation, the MDG Gap Task Force has been measuring progress in implementing commit-ments to strengthen official development assistance (ODA), to improve access of developing-country exports to international markets, to enhance cooperation to achieve and maintain sustainable external debt situations in developing coun-tries, and to deepen developing-country access to affordable essential medicines and new technologies. In addition to reporting the progress in these areas, since its first report in 2008, the Task Force has identified the gaps between com-mitment and delivery and has called upon the international community to fill those gaps.
Each annual report has shown the additional progress and greater efforts needed if the world is to reach the MDGs on schedule. Even during the midst of the global financial and economic crisis, the MDG Gap Task Force reported additional progress and concluded that the international community was advanc-ing towards its goals. The message of the present report, however, is a more sober-ing one: the Task Force has had difficulty identifysober-ing areas of significant new progress and for the first time there are signs of backsliding. With less than three years until 2015, there is no apparent commitment by Governments to “reverse the reversal” in time. Fewer MDGs will be reached in fewer countries as a result.
xii The Global Partnership for Development: Making Rhetoric a Reality
Official development assistance
After peaking in 2010, the volume of ODA fell almost 3 per cent in 2011, owing mainly to fiscal restraints of donor countries. Member countries of the Development Assistance Committee of the Organization for Economic Coop-eration and Development (OECD/DAC) provided $133.5 billion in ODA in 2011, equivalent to 0.31 per cent of their aggregate GNI. Because of the decline, the gap between actual aid disbursements and committed amounts in accordance with the United Nations target of 0.7 per cent of donor country GNI widened to about $167 billion in 2011. Moreover, growth of core ODA is expected to stagnate between 2013 and 2015, reflecting the delayed impact of the global economic crisis on donor country budgets.
ODA flows to least developed countries (LDCs) from DAC members increased to $44 billion in 2010, or 0.11 per cent of their combined GNI. The shortfall in meeting the United Nations target of between 0.15 per cent and 0.2 per cent of GNI was between $17 billion and $38 billion. Preliminary estimates indicate that DAC donors reduced bilateral aid to LDCs by 2 per cent in real terms in 2011. Bilateral aid to sub-Saharan Africa fell by almost 1 per cent in 2011, though aid to North Africa increased, reflecting support for the political transitions arising from the Arab Spring. Aid to landlocked developing countries fell in 2010 for the first time in a decade, while aid to small island developing States increased substantially.
Although progress has been made towards meeting the thirteen targets of the Paris Declaration on Aid Effectiveness, only the target pertaining to coordinated technical cooperation was met at the global level. Some progress was realized in other individual indicators, especially by recipient countries. On the other hand, aid flows remain highly volatile and donors have made very little or no progress towards agreed targets for improving aid predictability and transparency and enhancing mutual accountability.
The Fourth High-level Forum on Aid Effectiveness, which took place in Busan, Republic of Korea, from 29 November to 1 December 2011, shifted the focus from pure aid effectiveness to a more holistic approach, looking at the contribution that effective development cooperation can make to over-all development effectiveness. An agreed framework for development coop-eration was established that, for the first time, embraced traditional donors, South-South donors, developing countries, and a number of civil society organizations and private funders. The United Nations Development Coop-eration Forum (DCF) can play a key role in providing opportunities for a broader dialogue in a continuing official forum on the implementation of agreements reached in Busan and on how development cooperation contrib-utes to financing for development.
Market access (trade)
After more than 11 years of protracted negotiations, the Doha Round of trade negotiations remains at an impasse and its successful conclusion remains at risk. Despite world leaders’ pledges to pursue fresh, credible negotiating approaches to conclude the Doha Round negotiations, no progress has been made. Conclud-ing a development-oriented Doha Round would be a significant way to redress structural imbalances in the trading system, and even a partial set of deliverables would send a positive message and restart negotiating momentum.
Trade of developing economies rebounded more strongly after the global economic crisis than that of developed economies. By 2011, the former had cap-tured 43 per cent of world trade. LDCs, however, continue to account for a miniscule share of world trade. Trade among developing countries expanded substantially in 2010, on account of fast growth in Asia’s trade.
The current economic situation has lured Governments back into using protectionist trade policies. The implementation of new trade restrictions by Group of Twenty (G20) countries has not slowed down and their increasing effect on global trade is now a cause for concern. Cumulatively, since the begin-ning of the crisis, nearly 3 per cent of world trade has been affected by these trade restrictions. Trade finance markets also seem to have deteriorated and concerns have been raised that the Basel III regulations might raise obstacles to financing trade of developing countries.
About 80 per cent of the value of exports from developing countries and LDCs is now imported free of duty in developed markets. For LDCs as a group, this share has remained more or less constant since 2004. Yet, most LDCs do enjoy true preferential access. Tariffs imposed by developed countries on prod-ucts from developing countries have also remained unchanged by and large since 2004, except for agricultural products from LDCs. Tariff levels and trade prefer-ences remain uneven across products and regions. Available evidence suggests that increasing efforts are being made by developing countries to open up their own markets to products from LDCs.
Policy recommendations
y
Donor Governments should honour their commitments to deliver increasing ODA, despite budgetary constraintsy
All donors and multilateral organizations are strongly recommended to develop multi-year spending plans for country programmable assistance pub-licly available to increase transparency and reduce volatility in aidy
The United Nations DCF should be used by Member States to discuss measures to improve the effectiveness of development cooperation according to needs, to strengthen mutual accountability for development results by building on existing commitments and accountability processes, and to have a broader dialogue on financing for developmentxiv The Global Partnership for Development: Making Rhetoric a Reality
Agricultural subsidies in advanced economies adversely affect developing-country agricultural trade and production. Total support to the agricultural sec-tor in OECD countries reached a high of $407 billion in 2011. As a share of gross domestic product (GDP) of OECD countries, support increased to 0.95 per cent, reversing the decline observed in 2010.
Non-tariff measures (NTMs), which include technical requirements that imported goods must satisfy (such as sanitary and phytosanitary standards) and non-technical measures (such as rules of origin) are another class of trade impedi-ments. NTMs are more restrictive than tariffs. Although it is unintentional in many cases, trade of developing countries in general, and low-income countries in particular, tends to be disproportionately hurt by NTMs. Additional and more effective technical assistance will be essential to enable developing countries to meet international standards and regulations, and to allow them to overcome compliance challenges while staying competitive in international markets.
Total donor commitments to the Aid for Trade initiative reached $45.3 billion in 2010. While this represents a substantial increase over previous years, it is expected that allocations for Aid for Trade will also have been affected by tighter aid budgets of donor countries in 2011 and 2012.
Policy recommendations
Actions required at the national and international levels to ensure and further improve market access for developing countries include the following:
y
Continuing to explore different negotiating approaches in order to reach a balanced conclusion of the Doha Round of trade negotiations, including a meaningful package for LDCsy
Removing any trade-restrictive measures that have been adopted since the onset of the global crisis and avoiding the introduction of any new onesy
Significantly enhancing the availability of trade finance at affordable cost to all low-income countriesy
Fully implementing the commitment to provide duty-free quota-free market access to LDC products, along with simplified rules of originy
Increasing support for capacity development in developing countries, includ-ing compliance to international standards and non-tariff measures through predictable Aid for Trade and the Enhanced Integrated Framework for LDCsy
Eliminating all forms of agricultural export subsidies by 2013 and trade-distort-ing agricultural production subsidies in developed countriesy
Implementing the Rio+20 commitment to strengthen international coopera-tion for the transformacoopera-tion of developing countries into green economiesDebt sustainability
increased external debt overhang owing to the uncertain global economic envi-ronment and the expected deceleration of world output and trade growth in 2012.
The debt service-to-exports ratios of developing countries increased slightly in 2011, to 26.4 per cent, mainly on account of an increase in lower-middle income countries. In contrast, the ratio in low-income countries continued to decline. Although the situation varies across countries and regions, the debt-service burden is rising in Northern Africa, Eastern Asia, South-Eastern Asia and Oceania.
Currently, two separate frameworks are used to analyse debt sustainability. A recent review of the joint International Monetary Fund (IMF)-World Bank Debt Sustainability Framework for low-income countries focused on adapting the framework to changes in the debt profiles of low-income countries. The changes will give greater opportunity for debt sustainability analyses to take account of individual country-specific issues. The IMF framework for debt sustainability analysis in developed, middle-income developing and transition economies was also reviewed recently in the light of the recent debt crises in developed countries. By May 2012, 36 of the 39 heavily indebted poor countries (HIPCs) had reached the decision point in the HIPC process, when interim relief is accorded, and 32 had reached the completion point, thus benefiting from irrevocable debt relief complemented by further relief under the Multilateral Debt Relief Initiative (MDRI). Three of the four interim countries are expected to reach their comple-tion points within a year. The total cost of the HIPC Initiative to creditors has been estimated at $76 billion and that of the MDRI at $33.8 billion in end-2010 present value terms. By 2012, the large multilateral and Paris Club creditors pro-vided their full share of debt relief to all the completion point HIPCs, but full participation of all creditors remains to be secured. The activity of the Paris Club creditors has decreased in recent years, and 70 per cent of outstanding external debt of developing countries is now with private creditors.
Despite the success of debt relief initiatives in reducing the external debt of HIPCs and the number of restructurings in certain middle-income countries, 20 developing countries remain in or at high risk of debt distress, including 7 HIPC countries that have reached their completion point.
With the HIPC Initiative now largely completed, if any new countries require a sovereign debt workout they will have to rely on an ad hoc process. There are nascent signs of a renewed interest in exploring the development of an international sovereign debt workout mechanism.
Policy recommendations
To mitigate the impact of high debt burdens on the poor in developing countries, continued international efforts to prevent and manage debt crises are needed. Several policy options to strengthen these efforts should be considered:
y
Improving the timeliness and coverage of country debt data based on both creditor and debtor reporting systems so as to strengthen capacities for assess-ing debt sustainabilityy
Bolstering technical cooperation to strengthen debt management capacity in developing and transition economies and employing debt sustainability analysesxvi The Global Partnership for Development: Making Rhetoric a Reality
Access to affordable essential medicines
Increasing access to affordable essential medicines is important to achieving the health-related MDGs. Yet, there has been little improvement in recent years in improving availability and affordability of essential medicines in developing countries. Only 51.8 per cent of public and 68.5 per cent of private health facili-ties in those countries are able to provide patients with essential medicines. Prices of available essential medicines tend to be the multiple of international refer-ence prices. As a result, obtaining essential medicines, especially for treatment of chronic diseases, remains prohibitive for low-income families in developing countries. The problem is compounded when several family members suffer from illness at the same time. In such cases, treatment of common diseases with even the lowest-priced generics becomes impossible for many low-income households. Availability of originator brand medicines tends to be greater in private health facilities, but they are also priced substantially higher and therefore out of reach for the poor.
Despite the global economic downturn, resources available for the provi-sioning of essential medicines through some disease-specific global health funds increased in 2011. New funding was pledged to the Global Fund to Fight AIDS, Tuberculosis and Malaria and the Global Alliance for Vaccines and Immunisa-tion. Global initiatives such as these have been effective in the prevention and control of specific diseases. The challenges for these initiatives are to gener-ate new and additional resources, rather than merely intermediating already committed ODA and private charitable contributions, and to align the disease-specific interventions with broader national health programmes and policies of recipient countries.
Various initiatives to improve access to essential medicines are being explored. Some efforts aim to reduce production and distribution costs of generic medicines through manufacturing in developing countries. Several developing countries have managed to produce medicines locally with the support of phar-maceutical companies and initiatives from developed and developing countries. In recent years, an increasing number of developing countries have suc-cessfully used the flexibilities provided in the World Trade Organization (WTO) Agreement on Trade-related Aspects of Intellectual Property Rights (TRIPS) to lower costs and increase access to essential medicines by facilitating local pro-duction or the importation of generic medicines. However, many countries have yet to amend their national laws to incorporate TRIPS flexibilities fully. Fur-thermore, an increasing number of bilateral and regional free trade agreements include intellectual property protection that exceeds the minimum standards required by the TRIPS Agreement, which may hamper the use of flexibilities.
Policy recommendations (continued)
y
Fostering discussion of proposed principles on responsible borrowing and lending and guidelines on foreign debt and human rightsQuality is another key issue in access to essential medicines. Counterfeit as well as substandard pharmaceutical products can pose a very serious threat to health. However, resource constraints limit the capacity of regulatory authori-ties in developing countries to properly oversee the quality, safety and efficacy of medicines circulating in their markets.
Policy recommendations
y
Donor commitments to support global initiatives for the treatment and pre-vention of acute and chronic diseases should be truly additional to ODAy
The international community should assist developing-country Governments in increasing availability and use of medicines in the public sector and in pro-viding these medicines at little or no cost to the poor through the public health systemy
The international community, including new partners from the South, should further strengthen cooperation for supporting local production of generic medicines in developing countriesy
The international community should further encourage the pharmaceutical industry to use voluntary licensing agreements and join patent poolsy
Developing countries should carefully assess possible adverse impacts on access to medicines when adopting TRIPs plus provisionsy
The international community should continue to support efforts to strengthen developing-country regulatory capacity to oversee the quality of medicinesy
The international community should continue efforts to increase funding in research and development of new medicines, especially for neglected diseasesAccess to new technologies
The development impact of providing all people with access to the Internet and mobile phones is high. The access to such information and communication tech-nologies (ICT) continues to increase worldwide, but large inequalities persist. By the end of 2011, the number of mobile cellular subscriptions worldwide reached almost 6 billion. In developing countries, mobile phone subscriptions continue to expand at a very rapid pace, growing by 20 per cent in 2010 and narrowing the gap with developed countries. By the end of 2011, 79 per cent of the population in developing countries had a mobile cellular subscription. By contrast, only one third of the people living in LDCs had access to mobile phones in 2010.
Internet use has also continued to grow worldwide, but the digital divide between developed and developing countries remains large. Internet penetration in the developing countries stood at 26.3 per cent of the population in 2011 compared to 74 per cent in developed countries.
Even with the rapid spread of ICT, the challenge of making the technolo-gies easier, more accessible and more affordable continues. Although the costs of ICT services have been decreasing, they remain much higher in developing than in developed countries and are still prohibitive for the majority of people in some regions, especially Africa.
xviii The Global Partnership for Development: Making Rhetoric a Reality
efforts to foster competition in telecommunication/ICT markets during 2011. In more than 90 per cent of all countries, the provision of mobile cellular phone and Internet services takes place in markets where competition is allowed. At the same time, the fast growth of the use of ICT in many new areas has also increased the need for an expansion of regulation into such areas as electronic content, cyber security, data protection and environmental issues.
Affordable access to new technologies for climate change mitigation and adaptation and disaster risk management have also become pressing priorities. At the conference held in Durban from 28 November to 11 December 2011, Parties to the United Nations Framework Convention on Climate Change (UNFCCC) reaffirmed their commitment to support developing countries in their efforts to mitigate and adapt to the effects of climate change through a variety of mecha-nisms. Arrangements have been made to make sure the Green Climate Fund and the Technology Mechanism become operational in 2012.
The risk of natural disasters continues to increase in both developed and developing countries. Making further progress in reducing and managing risk will require, inter alia, better and more systematic recording of disaster losses and impacts, and the institutionalization of national disaster inventory systems. Most countries currently lack such systems.
Policy recommendations
y
In cooperation with the private sector, developed- and developing-country Governments should accelerate efforts to increase access to and affordability of Internet usage, especially broadbandy
Governments are encouraged to increase the use of ICT in the provision of their services in order to increase efficiency and support the achievement of the MDGsy
Governments are urged to abide by their commitments to the Green Climate Fund and the Technology Mechanism so as to increase access to technologies that address the impact of climate change in developing countriesIntroduction
Five years ago, the Secretary-General of the United Nations invited the organiza-tions of the multilateral system to form an inter-secretariat task force to better monitor implementation of the commitments commonly summarized as “Goal 8” of the Millennium Development Goals (MDGs). The resulting MDG Gap Task Force produced its first report in 2008, which measured progress in imple-menting commitments to strengthen official development assistance (ODA), to improve access of developing-country exports to international markets, to enhance cooperation to achieve and maintain sustainable external debt situations in developing countries, and to deepen developing-country access to affordable essential medicines and new technologies. In addition to giving an account of the progress in these areas, the first report identified the gaps between commitment and delivery and called upon the international community to fill those gaps.
That has also been the message of each of the subsequent reports: additional progress has been achieved, but much remains to be done and greater efforts are needed if the world is to reach the MDGs on schedule. Even during the depths of the global financial and economic crisis, the MDG Gap Task Force reported additional progress on enough dimensions of international cooperation to con-clude that the international community was advancing towards the Goals. The message of the present report is a more sobering one: the Task Force has had dif-ficulty identifying areas of significant new progress and, for the first time, there are signs of backsliding on certain key dimensions monitored. With less than three years until 2015, Governments do not appear committed to “reversing the reversal” in time. Fewer MDGs will be reached in fewer countries as a result.
Continuing impact of the global financial and
economic crisis
To be sure, the global financial and economic crisis that erupted in 2008 could have eroded international development cooperation efforts; fortunately, this did not happen. When the Group of Twenty (G20) upgraded itself from a finance ministers’ discussion forum to include Heads of State and Government, and made serious efforts to tackle the crisis jointly, it also reaffirmed donor develop-ment assistance commitdevelop-ments and promised to refrain from taking new protec-tionist or export-promoting measures that were inconsistent with World Trade Organization (WTO) regulations. A commitment was also made to conclude finally the cluster of negotiations it called the Doha Development Agenda. In all, in its communiqué of November 2008, the G20 was mindful of the impact of the crisis on developing countries and reaffirmed the global commitment to the MDGs.1 The international community as a whole reiterated these commitments
2 The Global Partnership for Development: Making Rhetoric a Reality
less than a month later at the Follow-up International Conference on Financing for Development held in Doha.2
The crisis had been generated by financial sector excesses in developed coun-tries. Although G20 Governments focused first on policy actions to counter the crisis in their own countries, they were also concerned about the negative impact on the developing world and the threat posed to the realization of the MDGs in all developing countries by 2015. Thus, in addition to the measures taken to restart their own economies and re-regulate developed countries’ financial sys-tems, the G20 promised to provide emergency financial support to developing countries impacted by the crisis and to monitor closely trade-related policies of G20 members in order to resist collectively protectionist pressures that would harm recovery efforts in developed as well as developing countries. These initia-tives were endorsed by the international institutions that were asked to carry them out or to monitor national efforts. They were also welcomed at the global level by the Conference on the World Financial and Economic Crisis and its Impact on Development held in July 2009 at United Nations Headquarters in New York, which additionally insisted on maintaining international focus on development priorities, including the MDGs, and “strengthening the foundation for a fair, inclusive and sustainable globalization supported by renewed multilateralism”.3
The emergency financial measures included the creation of new and reformed lending facilities and credit lines at the International Monetary Fund (IMF) and issuance for the first time since 1981 of a multilateral form of interna-tional liquidity, the Special Drawing Right (SDR). However, most of the $284 billion worth of SDRs that were created in 2009 ($250 billion as promised by the G20 and $34 billion that had been pending since 1997) were allocated to devel-oped countries. Developing and transition economies together received about $107 billion worth of SDRs.4 In addition, the World Bank and the regional devel-opment banks boosted their lending programmes, backed by increases in their capital and replenishment of their concessional lending facilities. Meanwhile, as the close monitoring of trade policy measures undertaken for the G20 revealed, there were relatively minor (though recently increasing) slippages in the pledge to avoid recurrence to trade protectionist measures.5
In fact, most developing and transition economies quickly bounced back from the crisis-induced output decline and total employment returned to pre-crisis levels. Yet, the pre-crisis left more workers in vulnerable employment, and unemployment rates in some regions, especially among youth, remained generally high.6 In addition, although most recent international attention on sovereign debt
2 Report of the Follow-up International Conference on Financing for Development to Review the Implementation of the Monterrey Consensus, Doha, Qatar, 29 November- 2 December 2008 (A/CONF.212/7), chap. 1, resolution 1, annex, paras. 3, 32 and 40.
3 General Assembly resolution 63/303 of 9 July 2009, para. 10.
4 Calculated from International Monetary Fund (IMF) data, employing the country clas-sification of World Economic Situation and Prospects 2012 (United Nations publication, Sales No. E.12.II.C.2).
5 World Trade Organization (WTO), Organization for Economic Cooperation and Development (OECD) and the United Nations Conference on Trade and Develop-ment (UNCTAD) have jointly monitored trade and investDevelop-ment restrictions by the G20 in semi-annual reports, which have cumulatively affected about 3 per cent of world imports (see chapter on market access below).
issues has focused on a number of developed countries, the IMF and the World Bank have continued to view a number of low-income and vulnerable developing economies as being at risk of debt distress (see the chapter on debt sustainability). The developing countries with the most difficult economic situations were also the countries about which there was most concern in terms of achieving the MDGs by 2015. In this context, in September 2010, the United Nations General Assembly hosted a global stocktaking on progress in realizing the MDGs, dur-ing which the Member States of the United Nations recommitted themselves to deepening the global partnership for development. Moreover, many individual Member States and international organizations promised to undertake specific additional contributions to the partnership.7
Unfortunately, 18 months later, the information being compiled on inter-national cooperation efforts for the present report can only be described as dis-appointing. As will be detailed in the subsequent chapters, the value of ODA measured in constant prices and exchange rates fell in 2011 and neither the Doha Round negotiations at the WTO nor the promised “early harvest” trade agree-ments for the least developed countries (LDCs) has been realized. Moreover, the global outlook—and thus the extent to which the international economic environment can be called “enabling”—has deteriorated notably from the second half of 2011. As seen in mid-2012, the outlook was, at best, uncertain and, at worst, a cause for concern.8
The developed economies have been slow to emerge from the crisis and several have already fallen back into recession with the future of the euro at stake, with severe fiscal austerity negatively impacting growth inside and outside the euro area, with continued financial sector fragility and with a faltering and largely jobless recovery in the United States of America. Nevertheless, implement-ing the international partnership commitments—in particular, ODA and the early harvest—did not require substantial, economy-wide sacrifices in developed economies. Budget allocations for ODA could have been preserved in fiscal con-solidation plans, as was indeed the case in some donor countries. Also, specific industries likely to face stronger competition could have been protected had bar-riers to competitive imports from LDCs been relaxed as proposed in the early harvest. The fact that this did not happen but could have goes completely against the spirit and aim of the global partnership. The priority accorded to development should and can be higher.
Is political support for the global partnership
weakening?
The global partnership for development has embodied both cooperative interna-tional deliberations to design strategies and assess their implementation, as well
7 Commitments made at the General Assembly session were summarized in the previous report of the Task Force (see MDG Gap Task Force Report 2011—The Global Partnership for Development: Time to Deliver (United Nations publication, Sales No. E.11.I.11), pp. 1-4). In addition, as discussed further on in the text, frequently updated information on partnership commitments and their implementation may be found at the website of the Integrated Implementation Framework, “Tracking Support for the Millennium Development Goals (MDGs)”, available from http://iif.un.org.
4 The Global Partnership for Development: Making Rhetoric a Reality
as the actual adoption of concrete policies in developing and developed countries. For much of the past decade, the partnership has been active at the discussion level, followed by substantial though insufficient policy delivery. However, the significant and growing disappointments at the policy-delivery level may now be souring the dialogue in international deliberations.
How many times and in how many forums can the member countries of WTO pledge to complete the Doha Round of multilateral trade negotiations without delivering on that pledge and still retain their credibility? How many times can the international community pledge to take major steps to address cli-mate change and environmentally sustainable development and produce minor progress, at best? How many times can Governments pledge to reach financial cooperation targets and not achieve them? How many times will multilateral conferences need to issue bland and non-committal outcome declarations to paper over deep divisions?
The waning support for the global partnership for development may be understandable in a context where much of the developed world is stuck in a pro-tracted economic and financial crisis. The same withdrawal from solidarity is also happening at national and regional levels. Taxpayers in donor countries want to shrink Governments and pay less taxes, not only because they feel economically insecure personally, but also because they seem no longer to trust government to deliver appropriate services effectively and efficiently—services for which their taxes pay—to the targeted recipients. Justified or not, ultimately, such perspective is not sustainable at either the national or international level. Voluntary private initiatives, even those of the wealthiest people in the world, cannot match the mobilization and financing capacity of Governments when addressing social and economic problems. Collective action through States remains essential nationally and internationally.
To regain the momentum and credibility of the global partnership, stronger mutual accountability is essential. The web-based platform “Tracking Support for the MDGs”,9 recently launched under the aegis of the MDG Gap Task Force, was designed to enhance accountability for the delivery on com-mitments in support of the MDGs and puts into practice the Integrated Imple-mentation Framework proposed by the United Nations Secretary-General as a follow-up to the High-level Plenary Meeting of the General Assembly on the MDGs held in September 2010. Making commitments and delivery gaps more transparent should help. However, it is up to all stakeholders to make sure that commitments do not remain mere rhetoric, but become reality.
The case for rebuilding the global partnership
International solidarity is the compelling, moral case for the global partnership for development. However, there is an even stronger political and economic case to be made: the ultimate security and well-being of people anywhere depend on the expectation of adequate living standards everywhere. Rich people may try to live behind fortress walls in their countries and rich countries may try to erect fortress protections against the foreign poor. They would all be fooling themselves
in our highly globalized world. Whether they realize it or not, they already rely on one another.
The global partnership for development should be seen as a “positive-sum game”. There is positive feedback when the economies of development partner countries achieve robust growth and become dynamic markets for world trade and investment. Citizens in rich countries also stand to gain when welfare in poor countries improves. Pressure on migratory flows will diminish when there are good jobs and improved living conditions at home. Unsustainable pressures on the Earth’s natural limits caused by increasing human activity are a further and primordial reason why the global partnership should be seen as an opportunity to yield positive-sum outcomes. Massive investments are needed for climate change mitigation and adaptation and other dimensions of environmental protection of global ramifications.10 Such investment will come about only through collec-tive action, both nationally and, foremost, internationally. The United Nations Conference on Sustainable Development (Rio+20) committed in this regard “to strengthen international cooperation to address the persistent challenges related to sustainable development for all, in particular in developing countries...[and] reaffirm[ed] the need to achieve economic stability, sustained economic growth, promotion of social equity and protection of the environment, while enhancing gender equality, the empowerment of women and equal opportunities for all, and the protection, survival and development of children to their full potential, including through education”.11
No one should presume that the global distribution of scientific and enterprise creativity matches the global distribution of income. Scientific break-throughs do not take place, inventions are not made and innovations are not commercialized when the global stock of capacity is not developed because some regions remain poor and opportunities are skewed in favour of the rich. The global partnership for development must work to overcome such constraints and inequalities.
The postulate advanced here is that, for pragmatic as well as ethical reasons, the world very much needs the benefits of international economic cooperation. It is essential to convince policymakers that this is where their national interests lie, to fight the myopia and to rebuild the case for the global partnership for development.
10 See, for example, World Economic and Social Survey 2011: The Great Green Technological Transformation (United Nations publication, Sales No. E.11.II.C.1); United Nations Environment Programme (UNEP), Towards a Green Economy: Pathways to Sustain-able Development and Poverty Eradication (Nairobi, 2011), available from www.unep. org/greeneconomy; and Rob Vos, Richard Kozul-Wright and Frank Ackerman, eds., Climate Protection and Development (London: Bloomsbury Academic).
Official development assistance
In 2011, as fiscal austerity took its toll on the economies of developed countries in general, its specific impact on official development assistance (ODA) was also felt. Excluding debt relief, the total volume of ODA fell in real terms for the first time in more than a decade, widening the delivery gap against outstanding commitments. At the same time, the international donor community reinforced previous commitments to increase ODA, and high-level international meetings led to new pledges to improve aid effectiveness. However, progress in meeting the targets previously set for making aid more effective has been disappointing. This is the context in which the international community finds itself in 2012: facing the clear and mounting challenge of how to turn ODA rhetoric into reality.
ODA commitments made in 2011
Development partners reiterated aid commitments as part of the Istanbul Pro-gramme of Action, which was agreed upon in May 2011 at the Fourth United Nations Conference on the Least Developed Countries (LDC-IV). To ensure the fulfilment of ODA commitments to LDCs, donor countries providing more than 0.2 per cent of their gross national income (GNI) as aid to LDCs promised not only to maintain their level of aid but to maximize efforts to raise it even further. Donor countries that had met the lower bound United Nations target (that is, to provide 0.15 per cent of GNI in development assistance to LDCs) promised to reach the 0.2 per cent target expeditiously. Countries that adopted the LDC aid targets but had not yet met the 0.15 aid target pledged to make their best efforts either to reach the target by 2015 or to accelerate their endeavours to increase assistance to LDCs. And finally, other donor countries agreed to exercise their best efforts to increase ODA for LDCs within the period of the Programme of Action, significantly increasing collective assistance to LDCs.1
In addition, the donor countries of the Group of Eight (G8), meeting in Deauville, France, in May 2011, reaffirmed their commitment to meeting their aid commitments, including those announced the previous September at the High-level Plenary Meeting of the General Assembly on the Millennium Devel-opment Goals (MDGs). The G8 also emphasized its commitment to health and food security through initiatives begun earlier.2
At the Deauville meeting, the G8 also promised to improve the transpar-ency and accountability of their aid information. In addition, development
1 Report of the Fourth United Nations Conference on the Least Developed Countries, Istanbul, Turkey, 9-13 May 2011, “Programme of Action for the Least Developed Countries for the Decade 2011-2020” (A/CONF.219/7), chap. II, para. 116.
2 See “G8 Declaration: Renewed Commitment for Freedom and Democracy”, Deauville, France, 27 May 2011, paras. 56-63.
8 The Global Partnership for Development: Making Rhetoric a Reality
ners promised in Istanbul to increase the alignment of their aid with the national priorities and national systems and procedures of recipient LDCs.
In a broader context, this was also a theme at the Fourth High-level Forum on Aid Effectiveness, which took place in Busan, Republic of Korea, from 29 November to 1 December 2011. The Forum brought together a wide group of international stakeholders to review progress in implementing the Paris Declara-tion principles of aid effectiveness and to discuss how to strengthen the develop-ment impact of aid further. The participants agreed to build the Busan Partnership for Effective Development Cooperation, which establishes an agreed framework for development cooperation that, for the first time, embraces traditional donors, South-South cooperators, emerging donors, developing countries, and a number of civil society organizations and private funders. The Busan Forum marked a turning point in international consideration of development cooperation as it moved from a focus that had been purely on aid effectiveness to a more holistic approach, looking at the contribution that effective development cooperation can make to overall development effectiveness. A New Deal for Engagement in Fragile States was also endorsed, aiming to create a new development architecture that would be better tailored to the situation and challenges of fragile States.
Apart from affirming existing promises on aid and aid effectiveness, the Group of Twenty (G20) at its Summit in Cannes in November 2011 acknow-ledged the need to tap new sources of funds for development and global public goods over time, including innovative mechanisms which some G20 countries are already implementing (such as the airline ticket levy) and those which they are prepared to explore (such as a financial transactions tax). They also agreed to mobilize their capacities to address agricultural challenges in the developing world by increasing agricultural production through investment and mitigating agricultural commodity price volatility.3
ODA delivery in 2011 and prospects
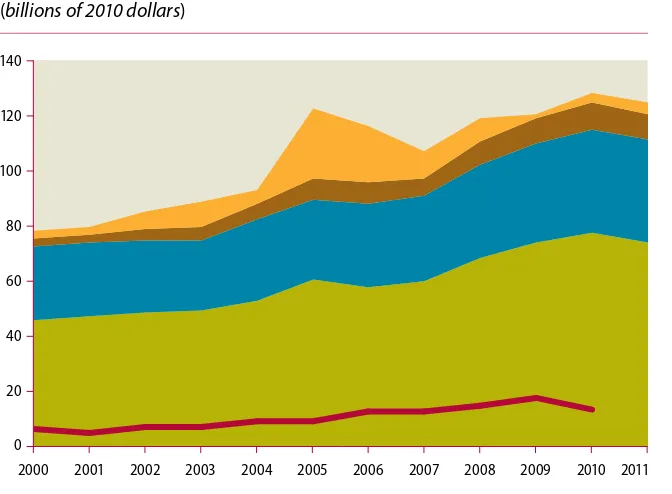
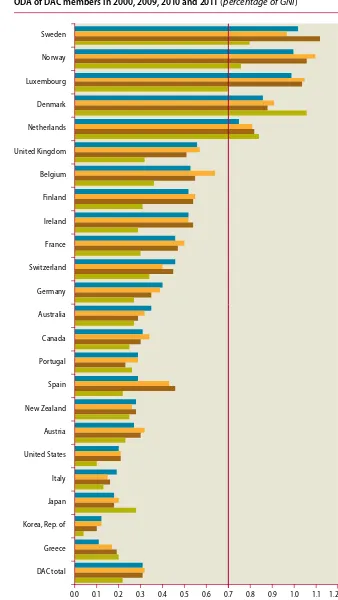
After reaching a peak in 2010, the volume of ODA fell almost 3 per cent in 2011, as measured in constant prices and exchange rates (see figure 1). Excluding the years following the granting of exceptional debt relief, which had boosted measured ODA flows, the 2011 decline represents the first significant fall since 1997, when aid fell by nearly 6 per cent. Aid for core bilateral projects and programmes, which excludes debt relief grants and humanitarian aid, fell by 4.5 per cent in real terms. ODA flows from the member countries of the Development Assistance Committee (DAC) of the Organization for Economic Cooperation and Develop-ment (OECD) reached $133.5 billion in 2011, equivalent to 0.31 per cent of their combined GNI. Out of the 23 DAC donors, 16 reduced their aid in 2011, mainly as a result of fiscal constraints related to the current economic crisis, which had negatively affected their ODA budgets. The largest falls were seen in Greece (39.3 per cent) and Spain (32.7 per cent) as a direct result of the crisis. These were fol-lowed by Austria (14.3 per cent) and Belgium (13.3 per cent), owing to reduced debt-forgiveness grants. Japanese ODA also suffered a large decrease (10.8 per
3 See “Cannes Summit Final Declaration—Building our Common Future: Renewed Collective Action for the Benefit of All”, Cannes, France, 4 November 2011, paras. 71-72 and 81-82.
A new framework for development cooperation is established
cent) after a significant rise in 2010. Only Sweden, Norway, Luxembourg, Den-mark and the Netherlands4 continue to exceed the United Nations target of 0.7 per cent of GNI (see figure 2).
The fall in ODA resulted in a slight widening of the gap between actual flows and the United Nations target of 0.7 per cent of donor GNI. The gap was equivalent to 0.39 per cent of GNI in 2011 (table 1) compared with 0.38 per cent in 2010. To meet the United Nations target, total ODA should more than double, to about $300 billion (in 2011 dollars), thus leaving a delivery gap against that commitment of $166.8. The gap widened by $4 billion in 2011 compared with the year before.
Table 1
Delivery gaps towards aid commitments by DAC donors, 2010 and 2011
Percentage of GNI
Billions of 2011 dollars
Total ODA United Nations target 0.7 300.3
Delivery in 2011 0.31 133.5
Gap in 2011 0.39 166.8
ODA to LDCs United Nations target 0.15-0.20 63.7-84.9
Delivery in 2010 0.11 46.5
Gap in 2010 0.04-0.09 17.2-38.4
4 In the case of the Netherlands, official development assistance (ODA) decreased 6.4 per cent in 2011 in real terms, reflecting the decision of the Government to reduce ODA to 0.75 per cent of GNI. The budget for 2012 sets out to reduce ODA further, to 0.7 per cent of GNI.
…and the gap to reach the United Nations target widened
Source: UN/DESA, based on OECD/DAC data.
Figure 1
Trends in main components of ODA from DAC members, 2000-2011 (billions of 2010 dollars)
0 20 40 60 80 100 120 140
2000 2001 2002 2003 2004 2005 2006 2007 2008 2009 2010 2011
Net debt-forgiveness grants
Humanitarian aid Multilateral ODA Bilateral development projects, programmes and technical cooperation Aid to basic social services
10 The Global Partnership for Development: Making Rhetoric a Reality
Figure 2
ODA of DAC members in 2000, 2009, 2010 and 2011 (percentage of GNI)
Source: OECD/DAC data. 0.0 0.1 0.2 0.3 0.4 0.5 0.6 0.7 0.8 0.9 1.0 1.1 1.2 Sweden
Norway
Luxembourg
Denmark
Netherlands
United Kingdom
Belgium
Finland
Ireland
France
Switzerland
Germany
Australia
Canada
Portugal
Spain
New Zealand
Austria
United States
Italy
Japan
Korea, Rep. of
Greece
DAC total 2011
The fall in aid flows in 2011 was not foreseen by the DAC. The 2011 OECD survey of donors’ forward spending plans had predicted a small increase in country programmable aid (CPA),5 which has typically been a good predictor of trends in total aid. Looking forward, preliminary results from the 2012 OECD survey of donors’ forward spending plans indicate that CPA is expected to increase by about 6 per cent in 2012, albeit mainly on account of expected increases in outflows of soft loans from multilateral agencies that had benefited from earlier fund replenishments (2009-2011).6 From 2013 to 2015, however, CPA is expected to stagnate, reflecting the delayed impact of the global economic crisis on donor country budgets.
In fact, if history is a guide, the impact of the economic crisis on aid may persist for several years. The fiscal austerity responses following the recessions of the early 1990s also pushed ODA flows into a steep and prolonged decline during much of the 1990s.7 It took Finland and Sweden more than six years to increase ODA back to the levels reached before the Nordic crisis of 1991.8
Under the current pressures for fiscal consolidation, the discretion-ary nature of ODA puts it at enhanced risk of budget cuts. Strong political commitment can offset this risk; indeed, seven countries—Australia, Ger-many, Italy, New Zealand, the Republic of Korea, Sweden and Switzerland— increased their aid in 2011. The increase in Italy’s aid came on account of more generous debt forgiveness and support to rising numbers of refugees from North Africa. In the case of the other countries, however, the increase resulted from their continued commitment to increase ODA. The Government of the United Kingdom of Great Britain and Northern Ireland has reiterated its intention to pledge to reach the target of 0.7 per cent of its GNI by 2013. In 2011, there was a setback in reaching that target as ODA provided by the United Kingdom fell slightly to 0.56 per cent of GNI, down from 0.57 per cent in 2010. Furthermore, as its economy entered into recession in the first quarter of 2012, reaching the United Nations target will imply much less of an increase in the actual aid volume than would have been the case without the economic downturn.
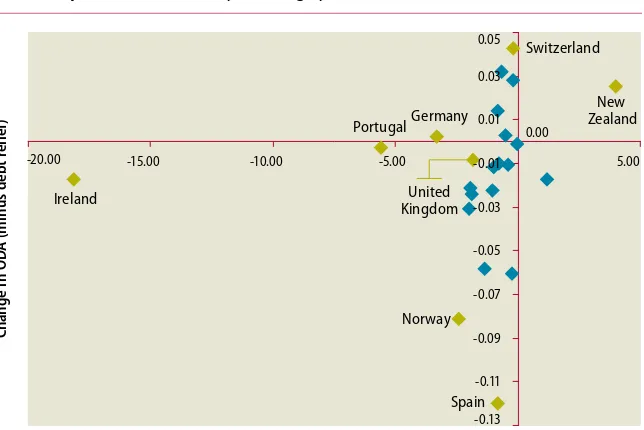
Most OECD/DAC countries that cut their budget deficits also reduced ODA (net of debt relief ). Norway and Spain recorded the largest drop in ODA as a percentage of GDP. Ireland, undergoing by far the strongest fiscal retrenchment, cut ODA only to a minor degree. ODA remained virtually the same in Germany and Portugal despite significant overall fiscal adjustment (see figure 3).
5 Country programmable aid (CPA) is a core subset of ODA that applies to programmes and projects and excludes non-programmable items such as humanitarian aid, debt relief and costs incurred in donor countries, as for administration and care of refugees.
6 Development Assistance Committee of the Organization for Economic Cooperation and Development (OECD/DAC), “Outlook on aid: preliminary findings from the OECD/DAC survey on donors’ forward spending plans 2012-2015”, available from
http://www.oecd.org/dataoecd/45/25/50056866.pdf.
7 OECD, Development Cooperation Report 1996: Efforts and Policies of the Members of the Development Assistance Committee (Paris), chap. IV.
8 The analysis is based on net aid transfers, rather than net ODA. See http://blogs.cgdev. org/globaldevelopment/2008/10/history-says-financial-crisis.php.
The global crisis will have an impact on aid in the next few years…
12 The Global Partnership for Development: Making Rhetoric a Reality
Allocation of ODA by countries
At the 2005 G8 summit in Gleneagles, Scotland, donor countries made com-mitments to increase aid to Africa by $25 billion a year by 2010. This target was not met, however. Nonetheless, sub-Saharan Africa remains the region that receives the most ODA, and existing commitments in general are still largely focused on Africa, including the Istanbul Programme of Action for the LDCs, the majority of which are in Africa; aid commitments made by the G8 at the 2009 L’Aquila and 2010 Muskoka Summits to support, respectively, agriculture and food security and maternal, newborn and child health; and aid flows com-mitted to the Joint African Union and EU Strategy Action Plan 2011-2013.9 Other pledges to advance the MDGs in Africa, such as the Global Strategy for Women and Children’s Health proposed by Secretary-General, were also contained in commitments made at the 2010 High-level Plenary Meeting of the General Assembly.10
Despite these commitments, preliminary data for 2011 show that bilateral aid to sub-Saharan Africa fell by 0.9 per cent in real terms, to $28 billion.11 By contrast, aid to North Africa increased, reflecting support for the political transitions arising from the Arab Spring. As a result, total bilateral aid to Africa increased by 0.9 per cent in real terms in 2011, to $31.4 billion.
As indicated, increased assistance to LDCs is another international prior-ity. ODA flows to LDCs from DAC members (including imputed multilateral aid) increased to $44 billion in 2010, the latest year for which detailed data
9 See http://www.africa-eu-partnership.org/sites/default/files/doc_jaes_action_plan_2011 _13_en.pdf.
10 See http://www.everywomaneverychild.org/.
11 Data on total aid, which includes imputed multilateral aid, was not available for Africa at the time of writing.
Fiscal retrenchment and change in ODA disbursement (minus debt relief) in
2011 compared with 2010 (in percentage points of GDP)
Sources: OECD, OECD Economic Outlook, vol. 2012/1 (May) for budget deficit data; OECD National Accounts Statistics for GDP data; and OECD/DAC for ODA data.
are available, up from $37.4 in the previous year. As a share of DAC GNI, aid to LDCs almost doubled from 0.06 per cent in 2000 to 0.11 per cent in 2010, getting closer to the lower bound of the United Nations target (table 1). This gap has narrowed to 0.04 per cent of donor GNI, or approximately $17 billion. Nevertheless, consistent with the trends in aid to sub-Saharan Africa, prelimi-nary estimates indicate that DAC donors appear to have reduced bilateral aid to LDCs by 2 per cent in real terms in 2011.
From a longer-term perspective, though, donors have given increasing priority to LDCs. The share of ODA provided to LDCs increased from 26.0 per cent in 2000 to 34.4 per cent in 2010. Recent increases, however, have largely consisted of increased debt relief to the Democratic Republic of the Congo and Liberia and emergency relief to Haiti. Liberia received $800 million in debt-forgiveness commitments in 2010 (compared with $100 million in 2009) and the Democratic Republic of the Congo received $1,300 million (compared with $144 million in 2009).
While the increase in ODA to LDCs observed in 2010 was encouraging, only 9 of the 23 DAC donors reached the lower bound United Nations target of 0.15 per cent of GNI. Canada has almost reached that target (see figure 4). Two additional groups of countries that are considered international pri-orities for assistance because of their geographical situations are landlocked developing countries (LLDCs) and small island developing States (SIDS). For the first time in a decade, aid to LLDCs fell in 2010, dropping by 1 per cent in real terms, to $25 billion (see figure 5). Aid receipts have fallen gradually to an average of 4 per cent of GNI of LLDCs, down on average from 7.4 per cent in the first half of the 2000s. Afghanistan continues to be by far the largest recipient of aid among not only LLDCs but all developing countries, receiving over $6 billion in 2010 (see table 2).
Aid to SIDS, by contrast, increased substantially to a volume of $6.8 billion in 2010, an increase of 57 per cent in real terms from the year before. ODA flows to SIDS increased as a share of their GNI from 2.4 per cent in 2000 to 5 per cent in 2010. This increase can be attributed mainly to aid provided to Haiti in the aftermath of the devastating earthquake of January 2010. The country received $3 billion, of which almost $2 billion was for emergency humanitarian assistance.
Aid continues to be concentrated in a small number of countries. The top 20 recipients in 2010 (out of 153 countries and territories) accounted for about 38 per cent of total ODA. This degree of concentration has not shifted nota-bly since 2000, although the country composition of the top 20 has changed somewhat. The group of recipient countries that made up the top 20 recipients in 2010 received only 25 per cent of ODA in 2000.
As noted earlier, the disappointing overall ODA prospects for the near future will not affect all aid-receiving countries to the same degree. Coun-tries in Central America and several large recipients in Eastern Asia, such as Indonesia and the Philippines, are expected to see the largest declines in country programmable aid (CPA). CPA is expected to continue decreasing in Latin America beyond 2013, but may increase in Southern and Central Asian countries. The OECD expects little change in CPA provided to Africa. The Democratic Republic of the Congo and Kenya are expected to experience large increases, while Afghanistan and Haiti may see strong declines. Until 2015, any
14 The Global Partnership for Development: Making Rhetoric a Reality
Figure 4
ODA of DAC donors provided to least developed countries, 2000, 2009 and 2010 (percentage of GNI)
Source: OECD/DAC data.
2010 2009 2000
0.00 0.05 0.10 0.15 0.20 0.25 0.30 0.35 0.40 0.45
Luxembourg
Denmark
Norway
Belgium
Sweden
Ireland
Netherlands
United Kingdom
Finland
Canada
France
Portugal
Austria
Spain
Switzerland
Germany
Australia
Japan
New Zealand
United States
Italy
Korea, Rep. of
Greece
DAC total 0.11