Published online EarlyView 8 November 2013 in Wiley Online Library (wileyonlinelibrary.com) DOI: 10.1002/smj.2196 Received 21 January 2009;Final revision received 8 June 2012
MAKING SENSE OF OVERCONFIDENCE IN MARKET
ENTRY
DAYLIAN M. CAIN,1
* DON A. MOORE,2and URIEL HARAN3
1Yale School of Management, Yale University, New Haven, Connecticut, U.S.A. 2Haas School of Business, University of California, Berkeley, Berkeley, California,
U.S.A.
3Guilford Glazer Faculty of Business and Management, Ben-Gurion University of the
Negev, Beer-Sheva, Israel
Entrepreneurs are often described as overconfident (or at least very confident), even when entering difficult markets. However, recent laboratory findings suggest that difficult tasks tend to produce underconfidence. How do entrepreneurs maintain confidence in difficult tasks? Our two laboratory experiments and one archival study reconcile the literature by distinguishing types of overconfidence and identifying what type is most prominent in each type of task. Furthermore, we critically examine the notion that ‘overconfidence’ explains excess market entry: we find that entry into different markets is not driven by confidence in one’s own absolute skill, but by confidence in one’s skill relative to that of others. Finally, we consider whether overconfidence in relative skill is driven by neglecting competitors or by systematic errors made when considering them. Copyright2013 John Wiley & Sons, Ltd.
INTRODUCTION AND PUZZLES
‘No problem in judgment and decision mak-ing is more prevalent and more potentially catastrophic than overconfidence.’ (Plous, 1993: 217)
This article focuses on overconfidence in mar-ket entry, where two puzzles lurk in the empir-ical findings. The first puzzle arises from a discrepancy within the overconfidence literature. On the one hand, there is a fairly strong con-sensus that people are prone to overconfidence. Some have argued that overconfidence is particu-larly rampant among entrepreneurs (Bernardo and
Keywords: market entry; confidence; social comparison; overconfidence; underconfidence; competition
*Correspondence to Daylian M. Cain, Yale School of Manage-ment, Yale University, 135 Prospect Street, New Haven, CT 06520, U.S.A. E-mail: [email protected]
Copyright2013 John Wiley & Sons, Ltd.
difficult tasks, people tend to rate themselves as worse than average (Kruger, 1999; Windschitl, Kruger, and Simms, 2003). Thus, the first puzzle is to understand how entrepreneurs, who may be engaging in very difficult tasks, are able to remain so confident.
The second puzzle surrounds which type of overconfidence is responsible for excess entry. Most prior research has treated different types of overconfidence as one and the same, but there are important differences. Overplacement, which produces ‘better-than-average’ beliefs, is typically measured by asking people the extent to which they are better than others in a certain skill or task, and is manifested by a majority (sometimes more than 90%) of people believing they are better than the average, the median, or a randomly chosen other (for a review, see Alicke and Govorun, 2005). Research indicates that people generally believe they are better than average in a wide variety of tasks and skills (Dunning, 2005; Dunning, Heath, and Suls, 2004; Williams and Gilovich, 2008). A second type of overcon-fidence is overestimation of one’s own absolute performance; investors sometimes overestimate the return on their investments (Moore et al., 1999), students overestimate their raw score on exams (Clayson, 2005), and people overestimate the speed with which they can get work done (Buehler, Griffin, and Ross, 1994). Third, and finally, there isoverprecision (Haran, Moore, and Morewedge, 2010), which is the excessive faith that one knows the truth, for example, in answer-ing a trivia question with too narrow a range of possible answers. The question is: which form of overconfidence is most responsible for market entry, or are several forms equally responsible?
The importance of these distinctions is under-scored by evidence showing that overestimation and overplacement can be negatively correlated with each other across tasks (Moore and Healy, 2008). With respect to overestimation, people are most likely to overestimate their performances on difficult tasks (Larrick, Burson, and Soll, 2007), but underestimate their performances on easy tasks (Bar-Tal, Sarid, and Kishon-Rabin, 2001; Lichtenstein and Fischhoff, 1977). This moderat-ing role of task difficulty on overestimation has become known as the ‘hard/easy effect’ (Erev, Wallsten, and Budescu, 1994; Juslin, Winman, and Olsson., 2000). The reason for it is simple: performance estimates tend to be regressive, and
it is easier to overestimate a low performance than to underestimate it.
Using what they call ‘differential regression,’ Moore and Cain (2007) reconcile the fact that overestimation is reduced on easy tasks with the fact that overplacement is greatest on easy tasks. They point out that estimates of others are even more imperfect and, therefore, more regressive than estimates of self. In terms of easy tasks, people underestimate themselves, but they underestimate others even more, thereby displaying overplacement. The reverse holds true for difficult tasks, where people overestimate themselves but overestimate others even more, thereby displaying underplacement.
If entrepreneurs overestimate their absolute performance, as suggested by Bolger, Pulford, and Colman (2008), the problem of excess entry might be exacerbated when tasks are difficult. However, studies of market entry games (Dorfman, Bereby-Meyer, and Moran, 2013; Moore and Cain, 2007; Moore, Oesch, and Zietsma, 2007) have found excess entry into markets with easy tasks, at the expense of entry to markets comprising difficult tasks, which suggests that overplacement (which is greatest in easy tasks) may be at fault. Like Moore and colleagues, Camerer and Lovallo’s work (1999) also suggests overplacement as the culprit for excess entry. Camerer and Lovallo gave their participants the choice to enter a contest that would be determined either by skill or by chance. Participants were more willing to enter the contest when it was based on skill, estimating that their performance would lead to positive expected payoffs for themselves but negative payoffs for other entrants. Naturally, if people believe their chance of success is higher than that of the competition, it will increase their willingness to enter contests or start new businesses, even when their objective chances of succeeding are not particularly good.
Thus, there are several questions we investigate in this article. Why do entrepreneurs seem immune to underconfidence in difficult domains? Which type of overconfidence drives excess entry? And, what exactly is the role of task difficulty?
Our reconciliation
people generally prefer engaging in activities in which they feel competent (Rotberg, Brown, and Ware, 1987), when they self-select into competi-tions, it is often a consequence of their (sometimes correct) beliefs that they are better than others in that domain (Tesser, 1988). Since most people believe they are better than others on easy tasks and worse than others on difficult ones, we would expect excess entry only in ‘easy’ markets. Competition on difficult tasks will be driven by a
minority of entrants who feel (perhaps correctly) that they are better than average on these tasks. In lab studies where participants have been forced to perform a difficult task, most participants will tend to underplace themselves. Where they can self-select into tasks, e.g., in entrepreneurial settings and in the lab studies presented in this article, we need not find underplacement. Entrants will go where they place themselves highly relative to others, even if the tasks in which they choose to engage are difficult. This simple explanation will go far in explaining various contradictions in the literature and what types of confidence lead to entry, and will shed light on how proper calibration can help capture value by appropriately choosing where to compete.
We test our hypotheses in two laboratory experiments in which participants self-select into competitions characterized by varied levels of task difficulty and varied attractiveness of the opportunity. We observe entry rates and find that overplacement contributes most to the choice to enter a competition, whereas overestimation, if at all related, is negatively related to entry. As a result, competitions on easy tasks are most likely to suffer from excessive rates of entry. We present a third study using field data, in which we compare industries with respect to market entry rates and observe correlations with perceived ease of competing in that industry. The field data corroborate key aspects of our experimental results.
LABORATORY EXPERIMENTS
Participants had to choose which of two markets to enter. Markets differed with respect to task difficulty. In addition to varying the difficulty of the task used to rank participants in each market, we also varied the attractiveness of the entry opportunity by manipulating prize size. Prior
evidence suggests that people respond to variations in prize size with amazingly rational and well-coordinated entry choices (Ochs, 1995, 1999). Given the choice of several lotteries of different prize sizes, participants’ choices can be very close to a game theoretic equilibrium in which their expected values of entry are nearly identical to one another. These findings suggest that sensitivity to prize size leads to remarkably sensible and efficient changes in competitors’ entry choices and should serve as a useful counterpoint to the variations in task difficulty we will employ in our experiment.
In our experiments, the tasks were trivia quizzes. All participants completed two quizzes, one easy and one difficult. Quiz order varied randomly between participants, and everyone made a choice about entering the market on either the easy or the difficult quiz. Here, we note that the two quizzes are not in different domains,per se, but rather are (perhaps nonrepresentative) selections of questions chosen for their (low versus high) likelihood of correct answers. Each entrant’s probability of win-ning the prize for a given market was proportional to his/her relative quiz performance. Thus, this is a task in which entry judgments should be guided by judgments of performance relative to others, rather than by judgments of absolute level of per-formance. This captures the competitive dynamics in entrepreneurial environments that we seek to understand.
For half of our participants, the difficult quiz was associated with a large prize ($90) and the easy quiz was associated with a smaller prize ($45), whereas for the other half, the prize sizes were reversed. With twice the prize money available, the expected value doubles, and one can expect, at equilibrium, twice the competition. Therefore, one would predict two-thirds (2:1) of participants in each condition would choose the larger prize, making the expected value of entering each market the same at equilibrium.
Hypotheses
We predicted that participants’ entry decisions would be based on their perceived relative rankings, leading (ex post) to overentry in markets of easy tasks and underentry in mar-kets of difficult tasks. In addition, we predicted entry would be rationally affected by prize size. Finally, we also predicted that those who
overplace their performances on any partic-ular task would disproportionately choose to compete on it, and that this selection would overwhelm worse-than-average effects in diffi-cult tasks, leading to an ‘entrepreneur effect’: participants will tend to believe they are bet-ter than others in the markets they choose to compete in.
EXPERIMENT 1
Method
Participants
Participants were 160 people gathered from online recruiting Web sites and email lists at Yale University and University of California, Berkeley. Participants were informed that they would be paid at least $5 for participating and that out of every 40 participants, one person would earn an additional $45 prize and another person would earn an additional $90 prize. We paid using Amazon.com gift cards, sent electronically.
Procedure
Each participant was randomly assigned into one of four 40-person blocks. Separation into blocks controlled the amount of competition and the odds of winning within each block. The instructions read:
Thanks for participating in this experiment! The experiment has several parts. First, you will take two different quizzes composed of math and logic puzzles. Each quiz has 10 questions. You should do as well as you can on the quizzes, because it will help you later on in the study. For now, it is time to take the quizzes.
One quiz (the ‘Purple Quiz’) was difficult, while the other (the ‘Orange Quiz’) was easy, with the test order counterbalanced between participants (see Appendix 1 for the quizzes). After completing both quizzes, half the participants saw the follow-ing text:
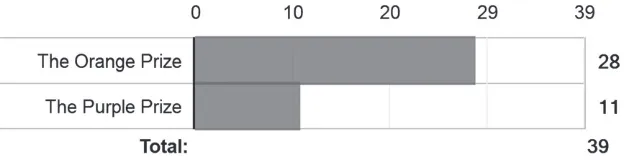
There will be two competitions for two prizes: the Orange Prize is $45.The Purple Prize is
$90. You have to choose which of the two prizes to go for. If you go for the orange prize, you will be competing using your per-formance on the orange test against everyone else who chooses to go for the orange prize. If you go for the purple prize, you will be up against everyone who goes for the purple prize, using your score on the purple test.
Your probability of winning the prize you go for will depend on how you did on that test, relative to others who also go for that prize. The higher your test scores rank against your competitors, the higher your probability of winning. The way it works is this: the lowest-ranked competitor for that prize gets one ticket; the next competitor gets two tickets; and so on. Competitors with tie scores all get the same number of tickets. All the tickets for that prize are mixed up and one is drawn at random to determine who wins that prize.
You should know that there will be a total of 40 people (including you) in exactly the same position, having taken both tests and deciding which prize to go for. Which prize do you want to go for?
The other half of the participants received the same text with one change: the orange prize was $90 and the purple prize was $45.
Figure 1. Screen shot of Question 5 in Experiment 1
they liked: (6) ‘How did you decide which prize to go for?’
Dependent measures
We measured overestimation as the difference of a participant’s reported score minus his/her
actual score. Overplacement was the difference of
estimated relative placement (estimated own score minus estimated average of other 39 participants’ scores)minus actual relative placement(own score minus average of other 39 participants’ scores). This ‘difference-of-differences measure’ adjusts for the fact that someone can correctly think he/she is better than average. In fact, someone who considers him/herself to be above average may, nevertheless, be underplacing his or her score if it is actuallymuchbetter than average. We developed a standardized measure of subjective placement using the difference between each participant’s estimated own score and the average of his/her reported distribution of all participants’ scores on the quiz, divided by the standard deviation of this distribution.
Expected value of entry
To examine whether participants did, on average, make the right decisions regarding which market to enter, we looked at the expected payoffs each participant would have earned in each market (given their actual scores and the actual scores and entry decisions of all other participants). For a participant’s chosen competition, we divided the number of lottery tickets the participant earned by the total number of lottery tickets earned by all entrants in that market, then multiplied that by the size of the prize. For the unchosen competition, we calculated what the allocation of lottery tickets would have been if the individual had chosen it.
Results
Manipulation checks
For a manipulation check, we submitted partici-pants’ responses to within-subject paired sample t-tests.1 The results show the expected main effects of difficulty: scores on the easy quiz were higher (M=6.96,SD=2.37) than on the difficult quiz (M =3.61, SD=2.09), t(159)=19.55,
p<0.001. Participants were aware of
differ-ences in quiz difficulty and estimated they had done better on the easy quiz (M=5.86,
SD=2.58) than on the difficult quiz (M=4.60,
SD=2.44), t(159)=7.45, p<0.001. These
results show that, similar to prior research, partic-ipants overestimated their scores on the easy quiz,
t(159)=6.76,p<0.001, and underestimated their
performance on the difficult quiz, t(159)=5.40,
p<0.001.
Relative placement and overplacement
On average, people are average. So, if the group is well calibrated, people’s beliefs about their relative placements in both quizzes should have a mean of zero. Instead, results supported prior findings of the effect of task difficulty: people over-placed themselves on the easy quiz (M=0.30,
SD=1.76) but underplaced themselves on the difficult quiz (M= −0.12, SD=2.14),
t(159)=2.41, p=0.02. Participants’ z-scored beliefs about placement on the two quizzes showed the same pattern, but the difference between them was not significant,t(159)=1.07, p=0.29.
Entry and expected entry
Surprisingly, our manipulation of prize size had basically no effect on entry choices, as
1All of our statistical tests are two tailed.
the preference for competing on the easy quiz remained high, whether it was for the large prize (attracting 70% of participants) or for the small prize (attracting 64%), χ2=0.71, p=0.40.
However, it is not as if participants failed to notice the prize manipulations. Like us, partici-pants incorrectly expected the prize size manipula-tion to work, by estimating that the difficult market would attract more participants when it carried a large prize (M =46%, SD=25%) than when it carried a small prize (M=36%, SD=22%),
t(158)=2.60, p=0.01. But in reality, partici-pants’ entry decisions were not much affected by prize size. Participants’ entry insensitivity to prize size resulted in an apparent insensitivity to the differences in expected values between the two competitions. Calculating each partici-pant’s estimated expected value of each compe-tition revealed that only 46 percent of partici-pants entered the market in which the expected value they estimated was higher, a rate that was not significantly different from chance, χ2=.90, p=0.34.
One possibility that could account for partici-pants’ insensitivity to prize size is if participants expected the draw of higher prizes to be counter-balanced with stiffer competition for higher prizes. That assumes that participants are thinking system-atically about others and expect others to take prize size into account. It also assumes that participants doubt others will conclude that greater competi-tion eradicates the benefits of going for the larger prize. A less sophisticated theory is that prize size simply got lost among the other concerns. In any case, prize size is not as salient a driver of entry as quiz difficulty: of the 160 participants, 107 (68%,
χ2=18.23, p<0.001) chose to compete on the
easy quiz.
There was excess entry to the easy market, leading to loss of value for participants. The mean expected value for participants who entered the easy market was $2.52 (SD=1.63), less than half that of the difficult market (M=$5.09,
SD=2.63), t(158)=7.58, p<0.001. This is
exacerbated by prize size: when the difficult mar-ket gave a higher prize, the easy entrants’ mean expected value (M =$1.76,SD=0.56) was much lower than that of the difficult entrants (M=$6.21,
SD=2.70),t(78)=11.39,p<0.001; in fact, even
when the easy market gave the higher prize, the mean expected value of easy entrants (M=$3.21,
SD=0.91) was lower than that of the difficult
entrants (M=$3.75, SD=1.47), t(78)=1.99,
p=0.05. Out of the 107 participants who chose to compete in the easy market, 74 would have gained a higher expected value by competing in the difficult market; these 74 lost an average of $2.41 (SD=1.68) in expected value.2 In con-trast, only 11 of the 53 participants who chose the difficult market would have gained a higher expected value from competing on the easy quiz,
χ2=33.35,p<0.001.
Did those who chose to compete on the easy quiz fail to anticipate that the easy quiz com-petition would be so crowded? No. Participants correctly anticipated the observed pattern of entry. Although they underestimated the true entry rate to the easy market, t(159)=4.30, p<0.001,
partic-ipants correctly expected that more people would choose to compete on the easy quiz (M=59%,
SD=23%) than on the difficult quiz (M=41%,
SD=24%),t(159)=4.63, p<0.001. To
summa-rize, participants displayed excessive preference to compete on the easy quiz, regardless of prize size and despite anticipating that the easy competition would be overcrowded with contestants.
Entry and confidence
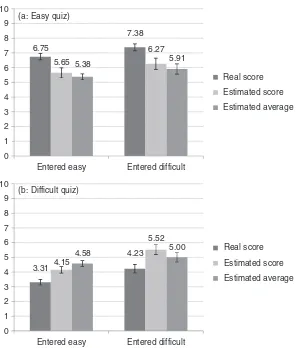
Did overconfidence drive participants’ entry choices? If so, which type of overconfidence was responsible? We compared easy market entrants with difficult market entrants, examining their beliefs about themselves and their relative placements on each quiz. As Figures 2a and 2b show, difficult market entrants performed better than easy market entrants on both quizzes, and also predicted higher scores (of themselves and others) on both quizzes, although these differences were significant only in performance and estimates in the difficult quiz. We conducted a 2 (quiz type) X 2 (entry choice) mixed ANOVA on overestimation. Results show that while both entry groups overestimated their scores on the easy quiz and underestimated their scores on the difficult one, they did not significantly differ in the degree to which they did so,F(1,158)=1.24,
p=0.27. Thus, entry decisions do not appear related to overestimation.
6.75
7.38
5.65
6.27
5.38 5.91
0 1 2 3 4 5 6 7 8 9 10
Entered easy Entered difficult
Entered easy Entered difficult
0 1 2 3 4 5 6 7 8 9 10
3.31
4.23 4.15
5.52
4.58 5.00
Real score
Estimated score
Estimated average
Real score
Estimated score
Estimated average (a: Easy quiz)
(b: Difficult quiz)
Figure 2. Mean scores, estimated own scores, and estimated average score by entry choice for the easy quiz (Fig. 2a) and the difficult quiz (Fig. 2b) in Experiment 1. Error bars represent±1 S.E.
Participants who competed on the easy quiz estimated that they scored higher on it than on the difficult quiz, but so did those who competed in the difficult market. Therefore, it does not look as if participants simply chose to compete on the quiz on which they believed they performed better in absolute terms. The bigger difference in the two groups’ beliefs is in how they thought they scored relative to the average. While entrants into the difficult market estimated their scores as above average on both the easy and difficult markets, entrants into the easy market placed themselves above average on the quiz on which they chose to compete and below average on the quiz they chose to forgo—placing themselves significantly lower in the forgone (difficult) market than did their counterparts who competed there,
t(158)=2.68, p=0.008. We conducted a mixed ANOVA, comparing relative placement on both
the easy and the difficult quiz of entrants of both markets. Participants who chose to compete on the easy quiz placed themselves higher on it than on the difficult quiz, whereas those who competed on the difficult quiz displayed the opposite pattern, F(1,158)=5.61, p=0.02. This result demonstrates that each group chose to compete where they felt that they had an advantage over others. We note that our design does not require large overplacement for us to find large excess entry: the comparison of overplacement in the easy task is not with proper placement (zero overplacement), but is with the overplacement in the difficult task, where it tends to be negative (underplacement).
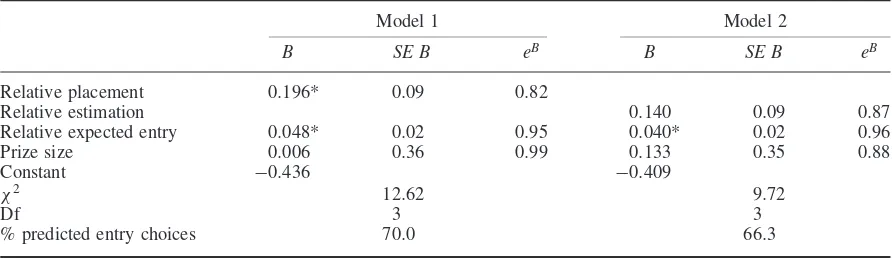
In addition to these analyses, we conducted logistic regressions to measure the effects of participants’ relative placement (the difference in their estimated relative placement between
Table 1. Logistic regression models from Experiment 1: the effects of relative placement and relative estimation on entry choices
Model 1 Model 2
B SE B eB B SE B eB
Relative placement 0.196* 0.09 0.82
Relative estimation 0.140 0.09 0.87
Relative expected entry 0.048* 0.02 0.95 0.040* 0.02 0.96
Prize size 0.006 0.36 0.99 0.133 0.35 0.88
Constant −0.436 −0.409
χ2 12.62 9.72
Df 3 3
% predicted entry choices 70.0 66.3
the two quizzes) and relative estimation on their entry choices. The models included quiz difficulty and the expected number of entrants to the different markets as covariates. The results are consistent with our hypothesis, showing that relative placement was a significant predictor of market entry choice,B=0.196,p=0.03.3Relative estimation, however, was not a significant pre-dictor of market entry choice,B=0.140,p=0.11 (see Table 1), although removing the control variables from this model improved its predictive ability,B=0.175,p=0.04, as well as its fit with the observed results (correctly predicting 68.8% of participants’ choices).4
Discussion
These results shed light on the link between over-confidence and entry into competitive markets. As predicted, participants preferred competing on an easy quiz over a difficult one, although they underestimated their performance on the easy quiz. Instead, entry choices are consistent with
3Unless stated otherwise, in the logistic regression models reported in this article, the same result patterns were observed when we excluded the covariates from the model.
4We also coded participants’ free text explanations of their choice of market. In the interest of space, we relegate that analysis to http://learnmoore.org/mooredata/SME/. In summary, 61 percent of those mentioning other competitors chose the higher EV (for them) market, while 43 percent of other participants did so. Those who explicitly mentioned theexpected amount of competition chose the higher EV market 72 percent of the time, while others did so 44 percent of the time. Despite it being a known quantity, only 33.75 percent of the participants mentioned thesize of the prize in their reasons; 68 percent of these prize-mentioning participants correctly entered the higher EV market, compared with only 40 percent of those who did not mention the prize.
overplacement. The easy quiz, which attracted the majority of contenders, was the one on which people believed they outdid others. These results replicate previous findings of over- and underconfidence on easy and difficult tasks and suggest that selection into competitive markets is driven by overplacement, or better-than-average beliefs. The better a person believes he/she is relative to others on a certain task, the higher the likelihood that he/she will compete on that task. The minority who believed they were much better than average on the difficult task preferred to compete on it.
One limitation of this study is that our par-ticipants could choose only between competing on one task or another. In reality, most potential entrepreneurs are not forced to choose between opening a burger bar and opening a magne-sium mine. In fact, most people opt not to enter any entrepreneurial market. In our first experi-ment, an observed choice to enter one competi-tion could be driven by the desire not to enter theother competition. Experiment 2 addresses this concern.
EXPERIMENT 2
prevent people from entering an overcrowded mar-ket. This would override competition neglect. For example, if people entered the easy market mostly because they had not considered that others would also do well on the easy quiz, then forcing people to consider the competition should reduce the pop-ularity of that competition. But, the main problem might not be inneglecting the competition, but in mischaracterizing it.
Method
Participants
Again, 160 individuals were recruited using an online subject pool, hosted at Yale University. Individual demographic data were not collected for this experiment, but within a few months of our study, the overall subject pool was measured to be 32 percent male and 68 percent female, with a median age of 34.
Procedure
The experiment’s materials and procedures were basically the same as in Experiment 1, with the following exceptions: after completing both quizzes, half the participants proceeded to make their entry decisions. After entry decisions, this group made performance and choice estimates (self, other). The other half of the participants first made the performance and choice estimates and then made their entry choices. Entry choices provided an alternative: ‘All of you will also have a third option: to take a 10 percent chance at a $15 payment and give up any chance for one of the larger prizes.’ Then, they all chose to enter either the easy or the difficult competition or neither.
Results
Actual and estimated scores
Quiz scores and estimates followed the pattern observed in Experiment 1. On the easy quiz, partic-ipants performed well (M=7.32 correct answers,
SD=2.07) and underestimated their performance (M=6.08, SD=2.53), t(159)=6.79, p<0.001.
On the difficult quiz, participants performed poorly (M=1.86, SD=1.33) and overestimated their scores (M =4.13, SD=2.10), t(159)=13.65,
p<0.001. Participants overplaced their scores on
the easy quiz (M =0.16, SD=2.02) more than
on the difficult quiz (M= −0.45, SD=2.07),
t(159)=3.71, p<0.001.
Participants’ estimated z-scores showed a sim-ilar pattern. While people generally thought they were average on the easy quiz (M=0.00,
SD=2.09), on the difficult quiz, participants placed themselves below average (M = −0.34,
SD=2.00), t(159)= −2.15, p=0.03 and lower than they did on the easy quiz, t(159)=1.97,
p=0.05.
The opt-out option and entry choices
Did the opt-out option reduce the excess entry into the easy competition? The results suggest not. On the contrary, while only 15 percent of participants opted out of both markets, the easy market still attracted the majority of participants (64%), significantly more than the difficult market (which 21% of participants chose to enter), χ2=36.03, p<0.001. Rates of entry to the easy market (103
entrants out of 160 participants) remained very similar to those observed in Experiment 1 (107 out of 160). Conversely, rates of entry to the difficult market decreased from those observed in Experiment 1 (33 versus 53 in the previous experiment). This suggests that in Experiment 1, participants who did not want to compete in any market but were forced to by the lack of an opt-out option may have chosen to compete in the difficult, less crowded market.
The introduction of an opt-out option helps clarify the confidence-entry relationship.
As in Experiment 1, the relationship between entry choices and differences in participants’ own performance estimates between the two quizzes does not seem to be strong. Entrants to both mar-kets thought they did better on the easy quiz than on the difficult quiz, to very similar degrees (easy market entrants:M=2.27,SD=2.18; diffi-cult market entrants:M=2.29,SD=2.00),t<1.
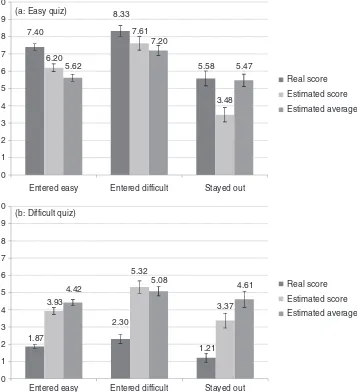
Placement beliefs, however, did seem to determine participants’ entry choices. A mixed ANOVA on participants’ self-placement in both quizzes reveals a significant interaction of placement and entry choice,F(1,157)=9.27,p<0.001. As Figures 3a
and 3b show, entrants to the easy market placed themselves highest among the three groups on the easy quiz, while difficult market entrants placed themselves higher on the difficult quiz than the two other groups, who both estimated they per-formed below average on this quiz. Participants
7.40
8.33
5.58 6.20
7.61
3.48 5.62
7.20
5.47
0 1 2 3 4 5 6 7 8 9 10
Entered easy Entered difficult Stayed out
Entered easy Entered difficult Stayed out
Real score
Estimated score
Estimated average
1.87
2.30
1.21 3.93
5.32
3.37
4.42 5.08 4.61
0 1 2 3 4 5 6 7 8 9 10
Real score
Estimated score
Estimated average (a: Easy quiz)
(b: Difficult quiz)
Figure 3. Mean scores, estimated own scores, and estimated average score by entry choice for the easy quiz (Fig. 3a) and the difficult quiz (Fig. 3b) in Experiment 2. Error bars represent±1 S.E.
who opted out placed themselves below aver-age on both quizzes and significantly lower than the other two groups (easy quiz: t(157)=6.05,
p<0.001; difficult quiz: t(157)=2.41,p=0.02).
Placement effects measured by participants’ esti-mated z-scores showed the same significant pat-terns.
In contrast to Experiment 1, where we could not distinguish the zealous market entrants from the reluctant ones, in this experiment, we could focus on those who had an option not to compete but still chose to enter a market. Using these participants, we compared relative estimation and relative placement as predictors for market entry
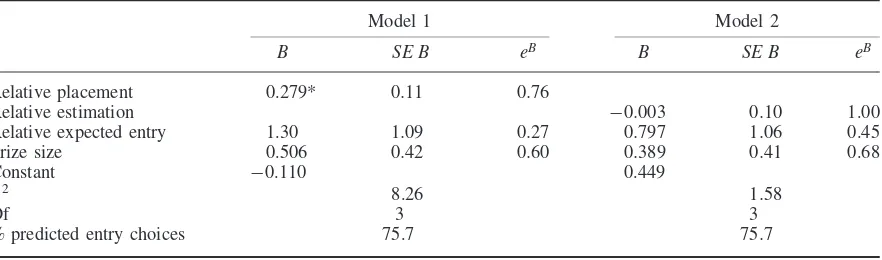
choice, again controlling for competition and prize sizes. Results show that while estimation was not a significant predictor of market entry, B= −0.003,
p=0.98, placement was, B=0.279, p=0.01, making correct predictions in 75.7 percent of the cases (see Table 2). Together, these results suggest that participants chose to compete on tasks in which they believed they performed better than others. When participants thought they did not possess a competitive advantage in either market, they simply chose not to compete.
Table 2. Logistic regression models from Experiment 2: the effects of relative placement and relative estimation on entry choices
Model 1 Model 2
B SE B eB B SE B eB
Relative placement 0.279* 0.11 0.76
Relative estimation −0.003 0.10 1.00
Relative expected entry 1.30 1.09 0.27 0.797 1.06 0.45
Prize size 0.506 0.42 0.60 0.389 0.41 0.68
Constant −0.110 0.449
χ2 8.26 1.58
Df 3 3
% predicted entry choices 75.7 75.7
rates to the competition on the easy task remained high in both prize size conditions (61% when it carried the small prize and 68% when it carried the large prize),χ2=1.00,p=0.32. Transforming
participants’ predictions into ‘expected’ values of each market again showed a match between higher ‘expected’ value and market entry for a minority of participants (70 out of 160),χ2=2.50, p=0.11.
These insensitivities, naturally, led to excess entry to the easy market: 81 of the 103 entrants to the easy markets would have gained higher expected values had they entered the other market, creating an average loss of $3.82 in (actual) expected value in that group, t(102)=10.73,
p<0.001.
Effect of assessing one’s relative performance before entrance
The entry rate to the easy market remained high, whether entry choice came after the think-about-others elicitation (65%) or before (64%),
χ2=1.00, p=0.32. This suggests that excess
entry to the easy market was not a result of failure to consider others’ performance.
Discussion
In Experiment 2, participants had the option to not enter any competition. This enabled us to measure the relationship between confidence and entry independently for each market, which revealed that the choice to enter an easy market was driven by the same process as a choice to enter a difficult one. Interestingly, comparing the choice patterns of participants in the two experiments shows that entry rates to the easy market did
not change with the introduction of an opt-out option. Rather, those who would have opted out of both markets, had such an option been present in Experiment 1, may have chosen to compete in the difficult, rather than the easy market. We speculate that these participants may have anticipated, as did most participants, that the easy market would have significantly more competitors and chose to stay out. From the two studies, we can see that self-selection promotes overplacement, since selecting on confidence automatically selects on overconfidence.5 This is why entrepreneurs might be able to remain confident in difficult tasks. In difficult tasks, task-difficulty effects on confidence work in the opposite direction of self-selection effects. The balance of these effects would likely be different in different tasks; sometimes the net result is correct placement. In easy tasks, task difficulty and self-selection work in the same direction, producing more frequent overplacement.
In addition, Experiment 2 revealed that forcing people to assess their relative placement before making a choice did not change their choice patterns. In fact, since the manipulation to consider others may also have primed many other heuristics, we are surprised it did not have a greater effect. Unfortunately, this simple and plausible mechanism of ‘stopping a moment to think’ before acting proved insufficient as a debiasing technique against overentry into a saturated, competitive market. Perhaps this lends further support to the notion that it is not as if people neglect the competition; they think they are better than the competition.
5Thanks to an anonymous reviewer for making this explicit.
FIELD DATA
Do these effects show up in real markets? Perhaps industries perceived to be more ‘simple’ would demonstrate higher rates of market entry than those perceived as more ‘difficult.’ While the two lab experiments are more controlled, and already use real monetary incentives, this third study is admittedly more speculative and examines settings with all sorts of barriers to entry. It would be interesting to find that such a correlation persists among all the noise in the data. Much noise is caused by the difficulty of data gathering itself and the multitude of other factors that go into real entry decisions. That said, we predict that subjective ratings of market ‘ease’ will positively correlate with real rates of entry into different industries.
Method
Entry rates in the firm data
We collected data on market entry from Dun & Bradstreet’s records of firm starts. These records break firms into 118 different industries based on Standard Industrial Classification codes. Start rates (number of firm foundings per 10,000 existing firms) for years from which we were able to obtain data (1985, 1986, 1987, and 1995) are moderately stable. The correlation across industries between different years’ start rates averages around 0.32. As prior research has shown, the industries that see persistent high rates of entry are the same ones that see persistent high rates of exit (Dunne, Roberts, and Samuelson, 1989; Mata and Portugal, 1994; Schwalbach, 1991). Schwalbach (1991), for example, estimates the correlation between entry and exit across industries among German manufacturing industries for the period 1983 to 1985 somewhere between 0.34 and 0.55.
Perceived ease
Measures of perceived ease were obtained from 277 individuals at Carnegie Mellon Univer-sity, which Forbes listed as one of the ‘most entrepreneurial’ campuses in the nation (Ewalt, 2004). Thirty-one of these individuals were drawn from a population of likely entrepreneurs: MBA students in entrepreneurship classes.
The remaining 246 were drawn more broadly from the university community in response to advertisements offering payment for experimen-tal participation. The correlation between the responses of the MBA entrepreneurship students and the broader sample of respondents was 0.92. Because this high correlation suggests that the two groups were quite similar, subsequent analyses utilize the ratings of all respondents and do not distinguish the two samples.
Each participant was asked to rate the ease of succeeding in each of the 118 major industry cat-egories. Due to concerns about the monotony of this task and the risk of routinized responses from participants, each participant rated a mere sub-set of the industries. Each participant was given one of seven different subsets covering a differ-ent combination of the 118 industries. For each industry, we asked participants to ‘indicate the degree to which you believe you understand what it takes to run a successful business’ and provided a seven-point scale running from 1 (no idea) to 7 (confident). Note that this wording does not dis-ambiguate between absolute versus relative confi-dence. Because people tend to mix the two even when the question’s wording is entirely unam-biguous (Moore and Klein, 2008), we make no strong claims about which type of confidence our participants were thinking about here. Our prior lab experiments address these distinctions (and mechanisms for entry) more carefully. This experi-ment, however, merely corroborates the notion that there is excess entry into ‘easy’ markets. Also, we sought to distinguish perceived ease of perfor-mance from ease of entering the market. Therefore, we also asked participants to rate the barriers to entry for each industry on a seven-point scale, ranging from 1 (none) to 7 (maximal barriers to entry).6,7
6While some have attempted estimates of actual barriers to entry (Schwalbach, 1991), those estimates are based on the assumption that the only reason for entry is supernormal profits in earlier periods. That makes these estimates inappropriate for the present analysis because they assume away the very phenomenon we are interested in examining.
Results
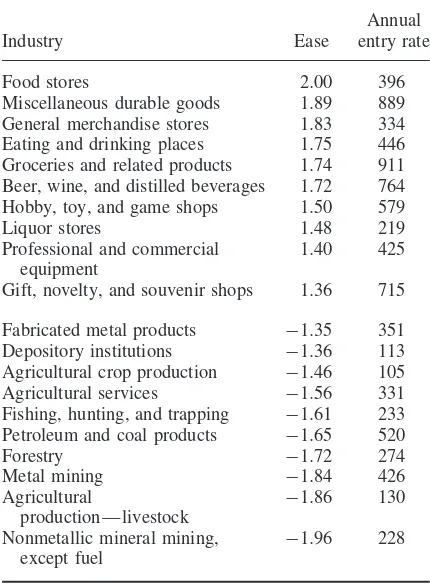
To measure the relationships between participants’ perceptions and the archival data, we computed the entry rates for each industry for each year in which data was available. The way entry rates are com-puted (entrants per 10,000 existing firms) allows one to account for industry size; in most markets, there are more burger bars than magnesium mines. We then averaged rates of entry across all years. Because this distribution was highly skewed, we normalized the rates using a log transformation and excluded two outliers from the analysis.8 We then usedentry rate as the dependent variable in a linear regression withperceived ease (averaged across all respondents) as an independent variable, controlling for barriers to entry. Results of this regression show that perceived ease of the industry significantly predicts actual market entry rates, B=0.355, t(115)=3.44, p=0.001. For a more straightforward comparison of ‘easy’ and ‘difficult’ industries, we conducted a median split on the ease measure and conducted a t-test com-paring mean market entry rates of the industries on either side of the split. Consistent with the regression results, we found that ‘easy’ industries enjoy higher market entry rates than ‘difficult’ industries, t(114)=2.97, p=0.004. Table 3 shows the 10 industries rated easiest and the 10 rated most difficult and their respective entry rates.
Discussion
A clear relationship emerges between perceived task difficulty and market entry, suggesting that task difficulty may have some influence on mar-ket entry decisions. Industries perceived to be easy attract more competitors, relative to industry size, than do difficult ones. The easier that running a business in a certain industry is perceived to be, the more crowded that industry’s competitive landscape becomes those that the base rate of suc-cess in the easy industry is sufficient; e.g., selling VHS tapes in this century might not be ‘easy’.9
8Advertising and transportation equipment manufacturing had entry rates of 5.42 and 4.19 standard deviations above the sample mean, respectively.
9This raises the notion that people may overenter easy competi-tions because they mistakenly think that easy competicompeti-tions will support many winners; this is ruled out by our design which clearly capped the amount of winners in each competition, yet still produced the excess entry.
Table 3. Ratings of ease (presented as z-scores) and annual entry rates (per 10,000 concerns) in the 20 most extreme industries based on rated ease
Industry Ease
Annual entry rate
Food stores 2.00 396
Miscellaneous durable goods 1.89 889
General merchandise stores 1.83 334
Eating and drinking places 1.75 446
Groceries and related products 1.74 911
Beer, wine, and distilled beverages 1.72 764
Hobby, toy, and game shops 1.50 579
Liquor stores 1.48 219
Professional and commercial equipment
1.40 425
Gift, novelty, and souvenir shops 1.36 715
Fabricated metal products −1.35 351
Depository institutions −1.36 113
Agricultural crop production −1.46 105
Agricultural services −1.56 331
Fishing, hunting, and trapping −1.61 233
Petroleum and coal products −1.65 520
Forestry −1.72 274
Metal mining −1.84 426
Agricultural
production—livestock −
1.86 130
Nonmetallic mineral mining,
except fuel −
1.96 228
Generalizing prior experimental findings of under-estimation in easy tasks, this field study provides further support to the argument that, contrary to prior assumptions about entrepreneurial overcon-fidence, excess entry to markets is not driven by overestimation. Overplacement, however, may be a better predictor of this phenomenon.
These data have several limitations. First, the relationship between perceived ease and market entry says nothing definitive about the confidence of real market entrants or their beliefs about how easy or difficult their jobs really are. Second, the data do not allow us to make causal conclusions. For example, it is possible that people perceive industries with high rates of entry as being easy—hence, a reverse in causation. Nonetheless, while the field data are open to many alternative explanations, the data are consistent with the findings of our experiments in which confidence was measured and task difficulty was controlled. Taken together with the experiments, the data
suggest the sorts of real market dynamics that can result from systematically biased entry choices.
GENERAL DISCUSSION
Our experimental data help reconcile the dis-crepancy between the overconfidence literature, where people are generally underconfident in their relative placement on difficult tasks, with the entrepreneurship literature, where people are any-thing but underconfident in the tasks they choose. This is produced by self-selection: when people are free to choose where to compete, they self-select into domains where they think they have relative advantage, similar to a winner’s curse contest.
Clarifying the concept of overconfidence can account for discrepancies found in the literature: whether or not one finds overconfidence in any domain depends largely on what form of over-confidence one is looking for. This article focuses on overestimation (e.g., of one’s own absolute performance) and overplacement (i.e., better-than-average beliefs). We tend to find overplacement in the same places that we find underestimation. While the study of overestimation represents about two-thirds of the overconfidence literature (Moore and Healy, 2008), both overestimation and overplacement are often incorrectly treated as if they were interchangeable manifestations of self-enhancement (Kwanet al., 2004). Both are mani-festations of overconfidence and can be driven by the same underlying processes, but they may be negatively correlated with each other across tasks. Our archival data showed the highest rates of market entry in industries people perceived to be ‘simple,’ rather than ‘difficult.’ Our experiments revealed that this tendency of people to flock to competitions characterized by easy tasks is driven by their beliefs that they are better than others on these easy tasks but worse than others (or at least, not so much better than others) on difficult tasks. Therefore, the majority of our participants chose to compete in the easy market, while, for the most part, they would have been better off competing in the difficult one. As we noted earlier, participants correctly expected more competitors in the easy market, so false beliefs about others’ entry choices are not the major reason for this pattern of excess entry. Also, it is not as if participants chose the easy market because they overestimated their own scores. In fact, participants tended to underestimate
their scores in the easy quiz, yet chose to compete there anyway.
Incidentally, most people feel they are at an advantage vis-`a-vis others on easy, rather than difficult tasks. It turns out that this effect can result from individuals making rational choices with imperfect information. Many of these errors are consistent with the Bayesian logic that under-lies differential regression: people make errors because they have imperfect information regard-ing their own performance and even more imper-fect information about others’ performances. Their estimations of their own performance are natu-rally less regressive than their estimations of the performance of others, and this leads to system-atic placement biases: ‘I know I did worse than expected on that hard test; I probably scored 1 out of 10 . . . Ithink he did poorly also, but I am less
sure—maybe he scored 2 out of 10?’. Thus, sen-sible people making sensen-sible choices may produce an outcome that appears irrationally myopic and collectively inefficient.
Limitations
start a dozen firms? Granted, entrepreneurial expe-rience might be richer, more costly, and, thus more effective than lab experiences at diminishing these biases.
We insist that the psychological basis for the effects demonstrated in our experiments will often be at play outside the laboratory. One often knows more about one’s own abilities than the abilities of others, and differential regression may cause persistent bias in competition entry. In fact, these effects will be exaggerated if experience teaches competitors asymmetrically more about their own skills than about the skills of the competition. We are not saying that actual entrepreneurs fail to get better at assessing the competition, nor that feedback will actually make matters worse. We are merely saying that experience is no obvious panacea to these problems. Indeed, the main causes for the effects we have documented (namely self-selection and differential knowledge of self versus others) are present in many domains. Perhaps sequential entry could reduce these effects if seeing prior entrants makes one more informed about others. That said, our field data somewhat get at sequential entry in that students were deciding how they could compete against prior movers in set markets with which the students presumably (especially in the categories in which they were most confident) had some interaction.
Implications
As Camerer (2003) points out, the way in which potential entrants coordinate their entry decisions is economically important. If there are too few firms entering a market, prices rise and con-sumers suffer; if there is too much entry, firms waste resources on unsalvageable fixed costs. For example, the optic cable industry laid more cable during the Internet boom of the late 1990s than demand could justify, and home contractors built too many houses during the housing boom of the mid-2000s. It is possible that entry choices are, in part, driven by overestimates of market capacity or by overestimates of the profit potential for any firm that survives. It is also possible that survivors actually are sufficiently compensated to warrant taking a chance on the low probability of surviv-ing. However, it is unlikely that these explanations were the reason behind excess entry in the cable industry (Camerer, 2003). In any case, these expla-nations cannot explain the excess entry into the
easy market in our experiments, since we fixed market capacity (winner takes all), as well as the prize for the winner in each market ($45 or $90) and made these constraints clear to all potential entrants. Nevertheless, many of our participants still chose to compete on the quiz where they had a lower expected value.
According to reference group neglect (or compe-tition neglect) explanations (Camerer and Lovallo, 1999), competitors focus too much on their own performance andneglect to consider the competi-tion (Dosi and Lovallo, 1997). Perhaps the cable companies simply neglected to consider their com-petitors’ ability to also lay down cable at high quantities. Many of our own experimental partic-ipants seem to have neglected their competition. This neglect came at their peril. However, even when we forced participants to consider the com-petition, as we did in Experiment 2, they failed to correct the bias in their entry choices, report-ing that they were better than others in the tasks on which they chose to compete. Our results sug-gest that the more significant driver of overplace-ment is notneglecting the competition, but rather underestimating it. In other words, it is not merely that one neglects the competition, it is that when one attends to the competition, one often gets the wrong idea about them. Thus, it may often not be enough to warn entrepreneurs to ‘first, consider the competition’ without enabling them to actually do so correctly. If differential regression explains overplacement in these domains, it also explains why these effects are larger in domains where information about others is low or when others are thought of as some vague group rather than as a specific, known other (Hoorens and Buunk, 1993; Klar, Medding, and Sarel, 1996; Windschitlet al., 2003). Perhaps the most effective way to improve decision makers’ ability to think about the compe-tition is by giving them better information about the competition (Moore and Small, 2007).
Concluding thought
The thing that potential market entrants seem to have trouble with is that success is often about having high relative standing; for example, it is not whether one can make a hamburger that leads to success at opening a burger joint, but (among other things) whether one can do so better than the competition. And when it comes to relative standing, the performance of one’s competition can
be just as important as one’s own performance. As the old joke goes, when two campers are being chased by a hungry bear, it is not necessary to outrun the bear—only to outrun the other camper.
ACKNOWLEDGEMENTS
The authors appreciate comments and data analysis by Keith Chen, especially in thinking about generalizability.
REFERENCES
Alicke MD, Govorun O. 2005. The better-than-average effect. In The Self in Social Judgment, Alicke MD, Dunning DA, Krueger JI (eds). Psychology Press: New York; 85–106.
Armor DA, Sackett AM. 2006. Accuracy, error, and bias in predictions for real versus hypothetical events.
Journal of Personality and Social Psychology 91(4): 583–600.
˚
Astebro T, Jeffrey SA, Adomdza GK. 2007. Inventor perseverance after being told to quit: the role of cognitive biases. Journal of Behavioral Decision Making 20(3): 253–272.
Barnes JH Jr. 1984. Cognitive biases and their impact on strategic planning.Strategic Management Journal 5(2): 129–137.
Bar-Tal Y, Sarid A, Kishon-Rabin L. 2001. A test of the overconfidence phenomenon using audio signals.
Journal of General Psychology 128(1): 76–80. Bateman TS, Zeithaml CP. 1989. The psychological
context of strategic decisions a test of relevance to practitioners. Strategic Management Journal 10(6): 587–592.
Bernardo AE, Welch I. 2001. On the evolution of over-confidence and entrepreneurs. Journal of Economics & Management Strategy 10(3): 301–330.
Bolger F, Pulford BD, Colman AM. 2008. Market entry decisions.Experimental Psychology 55(2): 113–120. Buehler R, Griffin D, Ross M. 1994. Exploring the ‘planning fallacy’: why people underestimate their task completion times. Journal of Personality and Social Psychology 67(3): 366–381.
Camerer CF. 2003. Behavioral Game Theory: Experi-ments in Strategic Interaction. Princeton University Press: Princeton, NJ.
Camerer CF, Lovallo D. 1999. Overconfidence and excess entry: an experimental approach.American Economic Review 89(1): 306–318.
Clayson DE. 2005. Performance overconfidence:
metacognitive effects or misplaced student expec-tations? Journal of Marketing Education 27(2): 122–129.
Cooper AC, Woo CY, Dunkelberg WC. 1988.
Entrepreneurs’ perceived chances for success.
Journal of Business Venturing 3(2): 97–109.
Dorfman A, Bereby-Meyer Y, Moran S. 2013. When feeling skillful impairs coordination in a lottery selection task.PLoS ONE 8(6): e65092.
Dosi G, Lovallo D. 1997. Rational entrepreneurs or opti-mistic martyrs? Some considerations on technological regimes, corporate entries, and the evolutionary role of decision biases. InTechnological Innovation: Over-sights and ForeOver-sights, Garud R, Nayyar P, Shapira Z (eds). Cambridge University Press: Cambridge, U.K.; 41–70.
Dunne T, Roberts MJ, Samuelson L. 1989. The growth and failure of U.S. manufacturing plants. Quarterly Journal of Economics104(4): 671–698.
Dunning D. 2005.Self-insight: Roadblocks and Detours on the Path to Knowing Thyself. Psychology Press: New York.
Dunning D, Heath C, Suls JM. 2004. Flawed self-assessment: implications for health, education, and the workplace. Psychological Science in the Public Interest 5(3): 69–106.
Erev I, Wallsten TS, Budescu DV. 1994. Simultaneous over- and underconfidence: the role of error in judgment processes. Psychological Review 101(3): 519–527.
Ewalt D. 2004. America’s most entreprenuerial campuses. Available at: http://www.forbes.com/entrepreneur (accessed 22 October 2012).
Haran U, Moore DA, Morewedge CK. 2010. A simple remedy for overprecision in judgment.Judgment and Decision Making 5(7): 467–476.
Hayward MLA, Hambrick DC. 1997. Explaining the premiums paid for large acquisitions: evidence of CEO hubris. Administrative Science Quarterly 42: 103–127.
Hoorens V, Buunk BP. 1993. Social comparison of health risks: locus of control, the person-positivity bias, and unrealistic optimism. Journal of Applied Social Psychology 23(4): 291–302.
Juslin P, Winman A, Olsson H. 2000. Naive empiricism and dogmatism in confidence research a critical examination of the hard-easy effect. Psychological Review 107(2): 384–396.
Klar Y. 2002. Way beyond compare: nonselective supe-riority and infesupe-riority biases in judging randomly assigned group members relative to their peers.
Journal of Experimental Social Psychology 38(4): 331–351.
Klar Y, Medding A, Sarel D. 1996. Nonunique invul-nerability: singular versus distributional probabilities and unrealistic optimism in comparative risk judg-ments.Organizational Behavior and Human Decision Processes67(2): 229–245.
Klayman J, Soll JB, Gonzalez-Vallejo C, Barlas S. 1999. Overconfidence: it depends on how, what, and whom you ask.Organizational Behavior and Human Decision Processes 79(3): 216–247.
Kruger J. 1999. Lake Wobegon be gone! The ‘below-average effect’ and the egocentric nature of compar-ative ability judgments. Journal of Personality and Social Psychology 77(2): 221–232.
Kunda Z. 1990. The case for motivated reasoning.
Psychological Bulletin108(3): 480–498.
Kwan VSY, John OP, Kenny DA, Bond MH, Robins RW. 2004. Reconceptualizing individual differences in self-enhancement bias: an interpersonal approach.
Psychological Review 111(1): 94–110.
Larrick RP, Burson KA, Soll JB. 2007. Social comparison and confidence: when thinking you’re better than average predicts overconfidence (and when it does not). Organizational Behavior and Human Decision Processes102(1): 76–94.
Lichtenstein S, Fischhoff B. 1977. Do those who know more also know more about how much they know?Organizational Behavior and Human Decision Processes20(2): 159–183.
Mata J, Portugal P. 1994. Life duration of new firms.
Journal of Industrial Economics 42(3): 227–246. Moore DA, Cain DM. 2007. Overconfidence and
under-confidence: when and why people underestimate (and overestimate) the competition.Organizational Behav-ior and Human Decision Processes103: 197–213. Moore DA, Healy PJ. 2008. The trouble with
overconfi-dence.Psychological Review 115(2): 502–517. Moore DA, Klein WMP. 2008. The use of absolute and
comparative performance feedback in absolute and comparative judgments and decisions.Organizational Behavior and Human Decision Processes107: 60–74. Moore DA, Kurtzberg TR, Fox CR, Bazerman MH. 1999. Positive illusions and forecasting errors in mutual fund investment decisions. Organizational Behavior and Human Decision Processes79(2): 95–114. Moore DA, Oesch JM, Zietsma C. 2007. What
compe-tition? Myopic self-focus in market entry decisions.
Organization Science18(3): 440–454.
Moore DA, Small DA. 2007. Error and bias in com-parative social judgment: on being both better and worse than we think we are. Journal of Personality and Social Psychology 92(6): 972–989.
Ng D, Westgren R, Sonka S. 2009. Competitive blind spots in an institutional field.Strategic Management Journal 30(4): 349–369.
Ochs J. 1995. Coordination problems. InThe Handbook of Experimental Economics, Kagel JH, Roth AE (eds). Princeton University Press: Princeton, NJ; 195–251. Ochs J. 1999. Coordination in market entry games. In
Games and Human Behavior, Budescu DV, Erev I, Zwick R (eds). Erlbaum: Mahwah, NJ; 143–172. Plous S. 1993.The Psychology of Judgment and Decision
Making. McGraw-Hill: New York.
Puri M, Robinson DT. 2007. Optimism and economic choice.Journal of Financial Economics86(1): 71–99. Radzevick JR, Moore DA. 2008. Myopic biases in competitions. Organizational Behavior and Human Decision Processes107(2): 206–218.
Rose JP, Windschitl PD. 2008. How egocentrism and optimism change in response to feedback in repeated competitions. Organizational Behavior and Human Decision Processes105(2): 201–220.
Rotberg HL, Brown DB, Ware WB. 1987. Career self-efficacy expectations and perceived range of career options in community college men and women. Journal of Counseling Psychology 34(2): 164–170.
Schwalbach J. 1991. Entry, exit, concentration, and mar-ket contestability. InEntry and Market Contestability, Geroski PA, Schwalbach J (eds). Blackwell: Oxford, U.K.; 121–142.
Simon M, Houghton SM. 2003. The relationship between overconfidence and the introduction of risky products: evidence from a field study.Academy of Management Journal 46(2): 139–150.
Stankov L, Crawford JD. 1996. Confidence judgments in studies of individual differences. Personality and Individual Differences 21(6): 971–986.
Tesser A. 1988. Toward a self evaluation maintenance model of social behavior. InAdvances in Experimental Social Psychology (Vol. 21), Berkowitz L (ed). Guilford: New York; 181–227.
Williams EF, Gilovich T. 2008. Do people really believe they are above average? Journal of Experimental Social Psychology 44(4): 1121–1128.
Windschitl PD, Kruger J, Simms E. 2003. The influence of egocentrism and focalism on people’s optimism in competitions: when what affects us equally affects me more. Journal of Personality and Social Psychology 85(3): 389–408.
Zacharakis AL, Shepherd DA. 2001. The nature of information and overconfidence on venture capitalists’ decision making.Journal of Business Venturing16(4): 311–332.
APPENDIX 1
The Purple (hard) Quiz and the Orange (easy) Quiz
The next 10 questions are from thePurple Quiz.
(1) The small hand and the big hand of a clock are each pointing to twelve. The small hand moves clockwise two numbers every hour while the big hand moves counterclockwise five numbers every hour. How long will it take until both hands overlap while pointing at the same number?
(2) What is the missing number in this sequence: 1-8 - 27 - ? - 125 – 216?
(3) Which word of four letters can be added to the front of the following words to create other English words? CARD BOX CODE BAG HASTE
(4) Jerry received $0.76 change from a purchase in the drugstore. If he received eight coins, and five of the coins are the same denomina-tion, how many quarters did he receive?
(5) Please insert the missing character to form two words: HUM ?ORK
(6) If it were two hours later, it would be half as long until midnight as it would be if it were an hour later. What time is it now?
(7) If two typists can type two pages in two minutes, how many typists will it take to type 18 pages in six minutes?
(8) Which one of the numbers does not belong in the following series: 23 67 814 -15 - 30?
(9) A certain metallic cube has a red top, a green bottom, two yellow sides, and a blue front and back. A woman with magnetic boots standing on the red top face walks forward onto the front blue face, turns right and walks three faces, turns left and walks three faces, turns right and walks two faces, and turns to her left and walks one face. What color is the face on which she now stands?
(10) What number comes next in this sequence: 3, 6, 18, 72, 360?
The next 10 questions are from theOrange Quiz.
(1) A bridge consists of 10 sections; each section is 2.5 meters long. How far is it from the edge of the bridge to the center?
(2) There are four equally spaced beads on a circle. How many straight lines are needed to connect each bead with every other bead using straight lines?
(3) If a certain type of bug lives for only 20 days, how old is the bug when it has lived half of its lifespan?
(4) John needs 13 bottles of water from the store. John can carry only three at a time. What’s the minimum number of trips John needs to make to the store, assuming he is carrying water by himself?
(5) LIVED is to DEVIL as 6,323 is to _____? (6) If the day before yesterday is two days after
Monday, then what day is it today?
(7) Which number should come next in the series: 3, 9, 6, 12, 9, 15, 12, 18?
(8) Which letter logically follows in this sequence: T, Q, N, K, H?
(9) If two typists can type two pages in five minutes, how many typists will it take to type 20 pages in 10 minutes?