Abstract. The current paper examined the level of food or store priorities of undergraduate students in Bandung City to promote better understanding of young generation in Bandung City. Based on two authors' theoretical foundation and Health Promotion Model, student's demographics, characteristics, food choice determinants, and store choice determinants are used as dimension that may consist of eating behavior. The questionnaire's survey of lunchtime eating behavior to the two universities, i.e., Institute Technology Bandung (ITB) and Parahyangan Catholic University (UNPAR) in Bandung City. The Selection of respondents took simple random sampling. Mann-Whitney U-test, Kruskal-Wallis test and ANOVA were used to examine the effect of consumer demographics and consumer characteristics for food and store choice determinants. A total of 251 undergraduate students participated; 54.6% were Males (n=137) and 45.4% were Females (n=114). Most of respondents were Moslem (48.4%) or Christian (40.6%). “Calorie”, “Degree of Congestion”, and Atmosphere (interior and exterior) were less important when they choose food or store. Moslem respondents tend to care food nutrient compared to the other religions. The result of this study is the priority of choosing food and store by respondents and showed national difference by using previous related research.
Keywords: eating behavior, food choice determinants, store choice determinants, bandung city, undergraduate students.
Abstrak. Penelitian ini ditujukan untuk menganalisis perilaku konsumsi makanan khususnya generasi muda di Kota Bandung secara komprehensif. Melalui penelitian ini dihitung prioritas pilihan makanan dan tempat berbelanja makanan bagi mahasiswa. Demografi mahasiswa, karakteristik, determinan pilihan makanan, dan pilihan tempat berbelanja makanan menjadi dimensi yang akan menjelaskan tingkah laku untuk mengkonsumsi makanan pada para mahasiswa ini. Perilaku konsumsi makanan pada saat makan siang dilakukan dengan menyebarkan kuesioner melalui survei ke dua kampus di Bandung, yaitu Institut Teknologi Bandung (ITB) dan Universitas Katolik Parahyangan (UNPAR). Sedangkan untuk Statistika yang digunakan adalah Mann-Whitney U-test, Kruskal-Wallis test, dan ANOVA untuk menganalisis efek demografis konsumen dan karakteristik makanan yang dibeli, serta tempat berbelanja makanan yang dipilih. Survey dilakukan kepada 251 responden dengan proporsi 54.6% (n=137) laki-laki dan 45.4% (n=114) perempuan. Mayoritas responden adalah muslim (48.4%) dan Kristen (40.6%). Jumlah kalori, tingkat keramaian, dan suasana (interior dan eksterior) tidak terlalu diperhitungkan dalam memilih tempat berbelanja makanan. Hasil dari penelitian ini adalah prioritas memilih makanan dan tempat belanja oleh responden serta perbedaan secara nasionalis dengan menggunakan penelitian terdahulu yang berkaitan.
Kata kunci: perilaku konsumsi makanan, determinan pilihan makanan, determinan tempat berbelanja makanan, Indonesia, mahasiswa
Received: 08 Maret 2015, Revision: 08 Mei 2015, Accepted: 29 September 2015
Print ISSN: 1412-1700; Online ISSN: 2089-7928. DOI: http://dx.doi.org/10.12695/jmt.2015.14.2.7
(Case of Undergraduate Students in Bandung City)
12 1 2,
Yuki Tsuruya , Santi Novani , Takeshi Arai
1 2
Utomo Sarjono Putro , and Hidetsugu Morimoto 1School of Business and Management, Institut Teknologi Bandung
2. Literature Review
2.1. Theoretical Framework
To understand food choice, we have to look not only at the physiology of individuals, but also at the interaction between the individual and social environments in which it feeds (B.G. Galefd, 1995). Elanie (1999) also discussed some of factors that influence consumer food choices. Several factors of his theoretical foundation of determinants of food decisions are examined in this study including; cultural factor (through “religion type”), psychological factor (through “taste preference”), life style factors (through “sleeping time”), and food trends (through “volume” and “serving time”).
Retail patronage also plays an important role in store selection because when we eat, we have to buy foods at somewhere except cooking at home. Pan and Zinkhan (2006) stated that an understanding of patronage behavior is a critical issue for retail managers because it enables them to identify and target those consumers most likely to purchase. Several parts of Pan and Zinkhan's theoretical foundation of determinants of retail patronage are examined in this study including: general price level (through “price level”), product assortment (through “menu variety”), friendliness of salespeople (through “staff attitude”), shopping convenience (through “location”), store atmosphere (through “atmosphere”), and characteristic variables (through “age”, “gender”).
There is the model, called “The Health Promotion Model (HPM)”, which is associated with restaurant patronage closely. The HPM holds that people take some given actions, such as what to eat, and where to eat, because such actions promote good health (Pender and Pender, 1986). According to Oyewole (2013),
the model stipulates that decisions to take these actions by an individual are influenced by five modifying factors which in turn operate through seven cognitive-perceptual factors. The five modifying factors are held to affect behavior indirectly, including: (1) demographic characteristics, (2) biological factors, 1. Introduction
1.1 . Background
In the Marketing, there is area of the study called “consumer behavior” which observes consumer's behavior directly. Consumer behavior is very difficult to predict because they take complicated acts due to many factors affected (Yamada, et al., 2008). This study focuses on eating behavior which is one of the areas of consumer behavior. Indonesia is very huge country; population based on the census results in 2012 was 249,866,000, which is 4th largest figure after China, India and the United States. Recently, Indonesian food industries have been grown rapidly and the reason of it is because Indonesian people have been fashionable eating habit (JETRO, 2010). Expenditure for food products have been increased by 48 % in four years from 2005 to 2009 and food market size has been expanded (Badan Pusat Statistik, 2012). What is important is that consumer population in Indonesia is not only big simply but also about 45% of them are less than 25 years old, shortly, young (United Nations, 2013). Therefore, it is desirable for food industries to make it a priority to meet the needs of big market in Indonesia. Up until now, there is no research investigating Indonesian eating behavior (See Table 1).
In addition, it is not well understood about eating behavior of undergraduate students in Indonesia that can be thought which consist of big part of younger generation.
Bandung City is located in West Java and is the capital of West Java Province. Population in Bandung city based on BPS(2014) were 2,483,977 people in 2013. Approximately 40% of population in Bandung were less than 25 years old. The characteristic of this city is an educational city with many universities compared to other cities in Indonesia (Global Center, 2009). Therefore, many students from various areas in West Java go to school in Bandung city. In this research, it will be investigated the Analysis of Consumer's Demographics and Characteristics which Influence Lunchtime Eating Behavior of Undergraduate Students in Bandung City.
1.2. Research Objective
The purpose of this research is to investigate eating behavior of undergraduate students in Bandung city with sample students from two universities, i.e., Institute Technology Bandung (ITB), Parahyangan Catholic University (UNPAR).
Author (s) Respondents Country
Kato and Roth (2009) Japanese university students Japan
Hasegawa et al (2010) Australian students Japan
Nishitani et al (2012) University students Japan
Mitwe et al (2009) Male workers USA
Ludy and Matters (2012) Caucasian, Asian USA
Catanzaro et al (2013) Public university students USA
Oyewole (2013) African American Consumers USA
Ungku et al (2010) Restaurants’ Consumers Malaysia
Zhao et al (2010) Consumers in Market China
Mariane et al (2012) 13-15 year students Canada, Scotland, USA
Boek et al (2012) College students Canada
Maghisan and Meghisan (2012) Romanian consumers Romania
Vildana et al (2011) Consumers in Market Bosnia and Herzegovina
This research Table 1 . Extent Studies Examining Eating Behavior
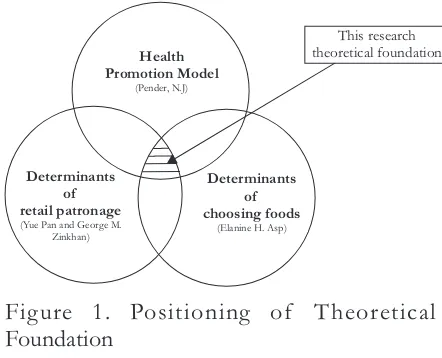
(3) behavioral factors, (4) interpersonal influences, and (5) situational factors. The seven cognitive-perceptual factors, on the other hand, are said to affect behavior directly, including: (1) importance of health, (2) perceived control of health, (3) perceived barriers, (4) perceived benefits, (5) perceived self-efficacy, (6) definition of health, and (7) perceived health status. In these 12 factors, the several of the constructs of HPM are examined in this study including: demographic (through respondent's demographic variables), interpersonal influences (through “friend's preference”), situational variables (through availability between inside of campus and outside of campus), importance of health (through “hygiene”, “calorie” and “nutrition”), and perceived barriers (through “time poverty” and “total serving time”). Figure 1 shows the positioning of theoretical foundation in the author's research. Here, “Eating Behavior” is defined as the decision-making process of selecting eating place and foods by consumers.
Figure 1. Positioning of Theoretical Foundation
2.2. Dimensions
2. Literature Review
2.1. Theoretical Framework
To understand food choice, we have to look not only at the physiology of individuals, but also at the interaction between the individual and social environments in which it feeds (B.G. Galefd, 1995). Elanie (1999) also discussed some of factors that influence consumer food choices. Several factors of his theoretical foundation of determinants of food decisions are examined in this study including; cultural factor (through “religion type”), psychological factor (through “taste preference”), life style factors (through “sleeping time”), and food trends (through “volume” and “serving time”).
Retail patronage also plays an important role in store selection because when we eat, we have to buy foods at somewhere except cooking at home. Pan and Zinkhan (2006) stated that an understanding of patronage behavior is a critical issue for retail managers because it enables them to identify and target those consumers most likely to purchase. Several parts of Pan and Zinkhan's theoretical foundation of determinants of retail patronage are examined in this study including: general price level (through “price level”), product assortment (through “menu variety”), friendliness of salespeople (through “staff attitude”), shopping convenience (through “location”), store atmosphere (through “atmosphere”), and characteristic variables (through “age”, “gender”).
There is the model, called “The Health Promotion Model (HPM)”, which is associated with restaurant patronage closely. The HPM holds that people take some given actions, such as what to eat, and where to eat, because such actions promote good health (Pender and Pender, 1986). According to Oyewole (2013), the model stipulates that decisions to take these actions by an individual are influenced by five modifying factors which in turn operate through seven cognitive-perceptual factors. The five modifying factors are held to affect behavior indirectly, including: (1) demographic characteristics, (2) biological factors, 1. Introduction
1.1 . Background
In the Marketing, there is area of the study called “consumer behavior” which observes consumer's behavior directly. Consumer behavior is very difficult to predict because they take complicated acts due to many factors affected (Yamada, et al., 2008). This study focuses on eating behavior which is one of the areas of consumer behavior. Indonesia is very huge country; population based on the census results in 2012 was 249,866,000, which is 4th largest figure after China, India and the United States. Recently, Indonesian food industries have been grown rapidly and the reason of it is because Indonesian people have been fashionable eating habit (JETRO, 2010). Expenditure for food products have been increased by 48 % in four years from 2005 to 2009 and food market size has been expanded (Badan Pusat Statistik, 2012). What is important is that consumer population in Indonesia is not only big simply but also about 45% of them are less than 25 years old, shortly, young (United Nations, 2013). Therefore, it is desirable for food industries to make it a priority to meet the needs of big market in Indonesia. Up until now, there is no research investigating Indonesian eating behavior (See Table 1).
In addition, it is not well understood about eating behavior of undergraduate students in Indonesia that can be thought which consist of big part of younger generation.
Bandung City is located in West Java and is the capital of West Java Province. Population in Bandung city based on BPS(2014) were 2,483,977 people in 2013. Approximately 40% of population in Bandung were less than 25 years old. The characteristic of this city is an educational city with many universities compared to other cities in Indonesia (Global Center, 2009). Therefore, many students from various areas in West Java go to school in Bandung city. In this research, it will be investigated the Analysis of Consumer's Demographics and Characteristics which Influence Lunchtime Eating Behavior of Undergraduate Students in Bandung City.
1.2. Research Objective
The purpose of this research is to investigate eating behavior of undergraduate students in Bandung city with sample students from two universities, i.e., Institute Technology Bandung (ITB), Parahyangan Catholic University (UNPAR).
Author (s) Respondents Country
Kato and Roth (2009) Japanese university students Japan
Hasegawa et al (2010) Australian students Japan
Nishitani et al (2012) University students Japan
Mitwe et al (2009) Male workers USA
Ludy and Matters (2012) Caucasian, Asian USA
Catanzaro et al (2013) Public university students USA
Oyewole (2013) African American Consumers USA
Ungku et al (2010) Restaurants’ Consumers Malaysia
Zhao et al (2010) Consumers in Market China
Mariane et al (2012) 13-15 year students Canada, Scotland, USA
Boek et al (2012) College students Canada
Maghisan and Meghisan (2012) Romanian consumers Romania
Vildana et al (2011) Consumers in Market Bosnia and Herzegovina
This research Table 1 . Extent Studies Examining Eating Behavior
(3) behavioral factors, (4) interpersonal influences, and (5) situational factors. The seven cognitive-perceptual factors, on the other hand, are said to affect behavior directly, including: (1) importance of health, (2) perceived control of health, (3) perceived barriers, (4) perceived benefits, (5) perceived self-efficacy, (6) definition of health, and (7) perceived health status. In these 12 factors, the several of the constructs of HPM are examined in this study including: demographic (through respondent's demographic variables), interpersonal influences (through “friend's preference”), situational variables (through availability between inside of campus and outside of campus), importance of health (through “hygiene”, “calorie” and “nutrition”), and perceived barriers (through “time poverty” and “total serving time”). Figure 1 shows the positioning of theoretical foundation in the author's research. Here, “Eating Behavior” is defined as the decision-making process of selecting eating place and foods by consumers.
Figure 1. Positioning of Theoretical Foundation
2.2. Dimensions
3.2. Questionnaire Contents
The questionnaire included questions on gender, Academic Classification, University Name, Religion Type (coded as: 1=Muslim, 2=Christian, 3=Hindu, 4=Buddha, 5= other religion), Sleeping Time (from “less than 3.0 hours” to “more than 9.0 hours”, 6-point scale), maximum cost that you are willing to pay for lunch inside of campus (from “~10,000 rupiah” to “50,001 rupiah ~”, 6-point scale), and maximum cost that you are willing to pay for lunch outside of campus (the scale is same as previous one).
To measure the level of time poverty, use 5-point Likert scale and respondents are indicated to what extent they agree/disagree with the statement that says: “On school days I have very little time for eating lunch because of having classes or tasks”.
In terms of measuring religious restriction, respondents are asked to rate their agreement/disagreement (1=”Strongly Disagree”; 5=”Strongly Agree”) with the statement, “I must eat the food based on my religious rules” to measure how they are constrained by religion rules based on their self-report.
Respondents are asked to rate the level of each 5 tastes (Sweet, Salty, Bitter, Sour, and Spicy) on a five-point Likert-scale (1=”I hate it very much”; 5=”I like it very much”). In addition, respondents are asked to indicate their agreement/disagreement (1=”Strongly Disagree”; 5=”Strongly Agree”) with the 7 statements regarding the reason why they choose the food (e.g., “the price is cheap”, “the portion is big”, etc). Respondents are asked to indicate their agreement/disagreement (1=”Strongly Dis-agree”; 5=”Strongly Agree”) with the 20 statements regarding the reason why they choose the store (e.g., “the location is near from campus”, “the location is accessible to transportation”, etc). Regarding items of store hygiene, we borrowed parts of items from Ungku et al., (2011).
3.3. Analysis
Statistical analyses were completed with the statistical package SPSS 17.0J. Independent variables are consumer demographics and consumer characteristics as well as dependent variables are food choice determinants and store choice determinants. The effect of gender and academic classification for dependent variables were examined through Mann-Whitney U-test and that of religion type difference was examined through Kruskal-Wallis test. The effects of the difference level of consumer characteristics were investigated using ANOVA.
4. Results and Discussion 4.1. Simple Calculation
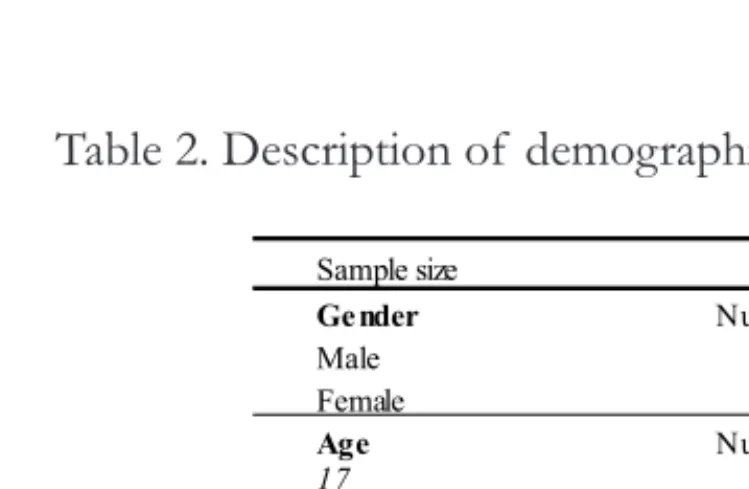
Consumer demographics and characteristics data are presented in Table 2, 251 subjects filled out questionnaire and ITB and UNPAR students were 142(56.6%), 109(43.4%) respectively. 54.6% of the students were males (n=137). Most of respondents were Moslem (48.2%) or Christian (40.6%).
The layer of Willingness to pay (WTP) for their lunch, was different between inside and outside of the campus. While WTP for lunch inside of campus was concentrated in 10,001-30,000 rupiah, WTP for lunch outside of campus was scattered. We speculate that some students want to take lunch with cheap cost and others want to eat delicious food even though the price is expensive. Finally, with respect to sleeping time, approximately 80% of respondents have sleep for 4.5-7.5 hours.
Table 3 shows mean importance level of time poverty and religious restriction. This result showed that more than half of respondents (58.5%) have lack of lunchtime. Around 64% respondents followed their religious rule for food and the level of religious restriction was considerably different by religion type (Moslem; M=4.63, Christian: M=3.20, p<0.001). For the purpose of further analysis, some factors were regrouped as Table 4 shown. According to hypothesis 3 & 4, because there is
no prior research showing that religion type, sleeping time and religious restriction affect store priority, their two variables were eliminated.
3. Methodology
3.1. Population and Procedures
Participants were selected from ITB undergraduate students and UNPAR undergraduate students in Bandung City. Population was set as undergraduate students living in Bandung city.
Questionnaire was written in English by the author at first and after that native students translated it into Indonesian language. Questionnaire survey took place over a three-month period of April to June in 2014. The data method was taken simple random sampling, which creates sampling frame for all cases. The author and academic helpmate distributed randomly in school cafeteria of each university or classes of each university and retrieved filled questionnaires on the spot.
Consumer Demographics (3): Gender, Academic Classification, Religion Type.
Consumer Characteristics (4): Money Restriction (Inside of Campus, Outside of Campus), Sleeping Time, Time Poverty, Religious Restriction.
Food Choice Determinants (7): Taste (Sweet, Salty, Bitter, Sour, Spicy), Price, Volume, Calorie, Nutrient, Food Hygiene, Food Serving Time.
Store Choice Determinants (9):
Location, Price level, Menu Variety, Store Hygiene, Store Serving Time, Congestion, Friend's Preference, Atmosphere, Staff Behavior.
2.3. Hypotheses Formulation
This research attempts to examine the importance level of each food (or store) choice determinants by consumer demographics or consumer's characteristics. The relationship of four dimensions is drawn as shown Figure 2 and four causalities were formulated as follows:
H : Level of importance of food choice determinants is 1 different from consumer's demographics
H : Level of importance of food choice determinants is 2 different from consumer's characteristics
H : Level of importance of store choice determinants is 3 different from consumer's demographics (except Religion Type)
H : Level of importance of store choice determinants is 4 different from two consumer's characteristics (Money Restriction and Time Poverty)
Consumer’s Demographics
3.2. Questionnaire Contents
The questionnaire included questions on gender, Academic Classification, University Name, Religion Type (coded as: 1=Muslim, 2=Christian, 3=Hindu, 4=Buddha, 5= other religion), Sleeping Time (from “less than 3.0 hours” to “more than 9.0 hours”, 6-point scale), maximum cost that you are willing to pay for lunch inside of campus (from “~10,000 rupiah” to “50,001 rupiah ~”, 6-point scale), and maximum cost that you are willing to pay for lunch outside of campus (the scale is same as previous one).
To measure the level of time poverty, use 5-point Likert scale and respondents are indicated to what extent they agree/disagree with the statement that says: “On school days I have very little time for eating lunch because of having classes or tasks”.
In terms of measuring religious restriction, respondents are asked to rate their agreement/disagreement (1=”Strongly Disagree”; 5=”Strongly Agree”) with the statement, “I must eat the food based on my religious rules” to measure how they are constrained by religion rules based on their self-report.
Respondents are asked to rate the level of each 5 tastes (Sweet, Salty, Bitter, Sour, and Spicy) on a five-point Likert-scale (1=”I hate it very much”; 5=”I like it very much”). In addition, respondents are asked to indicate their agreement/disagreement (1=”Strongly Disagree”; 5=”Strongly Agree”) with the 7 statements regarding the reason why they choose the food (e.g., “the price is cheap”, “the portion is big”, etc). Respondents are asked to indicate their agreement/disagreement (1=”Strongly Dis-agree”; 5=”Strongly Agree”) with the 20 statements regarding the reason why they choose the store (e.g., “the location is near from campus”, “the location is accessible to transportation”, etc). Regarding items of store hygiene, we borrowed parts of items from Ungku et al., (2011).
3.3. Analysis
Statistical analyses were completed with the statistical package SPSS 17.0J. Independent variables are consumer demographics and consumer characteristics as well as dependent variables are food choice determinants and store choice determinants. The effect of gender and academic classification for dependent variables were examined through Mann-Whitney U-test and that of religion type difference was examined through Kruskal-Wallis test. The effects of the difference level of consumer characteristics were investigated using ANOVA.
4. Results and Discussion 4.1. Simple Calculation
Consumer demographics and characteristics data are presented in Table 2, 251 subjects filled out questionnaire and ITB and UNPAR students were 142(56.6%), 109(43.4%) respectively. 54.6% of the students were males (n=137). Most of respondents were Moslem (48.2%) or Christian (40.6%).
The layer of Willingness to pay (WTP) for their lunch, was different between inside and outside of the campus. While WTP for lunch inside of campus was concentrated in 10,001-30,000 rupiah, WTP for lunch outside of campus was scattered. We speculate that some students want to take lunch with cheap cost and others want to eat delicious food even though the price is expensive. Finally, with respect to sleeping time, approximately 80% of respondents have sleep for 4.5-7.5 hours.
Table 3 shows mean importance level of time poverty and religious restriction. This result showed that more than half of respondents (58.5%) have lack of lunchtime. Around 64% respondents followed their religious rule for food and the level of religious restriction was considerably different by religion type (Moslem; M=4.63, Christian: M=3.20, p<0.001). For the purpose of further analysis, some factors were regrouped as Table 4 shown. According to hypothesis 3 & 4, because there is
no prior research showing that religion type, sleeping time and religious restriction affect store priority, their two variables were eliminated.
3. Methodology
3.1. Population and Procedures
Participants were selected from ITB undergraduate students and UNPAR undergraduate students in Bandung City. Population was set as undergraduate students living in Bandung city.
Questionnaire was written in English by the author at first and after that native students translated it into Indonesian language. Questionnaire survey took place over a three-month period of April to June in 2014. The data method was taken simple random sampling, which creates sampling frame for all cases. The author and academic helpmate distributed randomly in school cafeteria of each university or classes of each university and retrieved filled questionnaires on the spot. Consumer Demographics (3): Gender, Academic
Classification, Religion Type.
Consumer Characteristics (4): Money Restriction (Inside of Campus, Outside of Campus), Sleeping Time, Time Poverty, Religious Restriction.
Food Choice Determinants (7): Taste (Sweet, Salty, Bitter, Sour, Spicy), Price, Volume, Calorie, Nutrient, Food Hygiene, Food Serving Time. Store Choice Determinants (9):
Location, Price level, Menu Variety, Store Hygiene, Store Serving Time, Congestion, Friend's Preference, Atmosphere, Staff Behavior.
2.3. Hypotheses Formulation
This research attempts to examine the importance level of each food (or store) choice determinants by consumer demographics or consumer's characteristics. The relationship of four dimensions is drawn as shown Figure 2 and four causalities were formulated as follows: H : Level of importance of food choice determinants is 1
different from consumer's demographics
H : Level of importance of food choice determinants is 2 different from consumer's characteristics
H : Level of importance of store choice determinants is 3 different from consumer's demographics (except Religion Type)
H : Level of importance of store choice determinants is 4 different from two consumer's characteristics (Money Restriction and Time Poverty)
Consumer’s Demographics
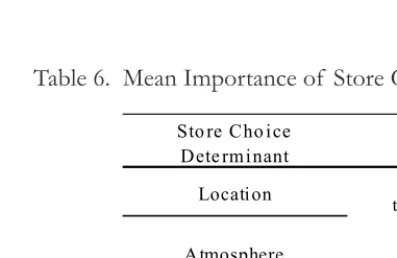
Table 5 and Table 6 display the mean importance of each food choice determinants and store choice determinants respectively. Food Price and Food Hygiene were substantial factor for undergraduate students. Especially, the highest score item of Hygiene was related to pest existence. In fact, when we eat at street vendor, usually there are many pests around our dishes. It implies that at a glance students do not seem to care flies when they eat, but actually they really care them. On the other hand, they didn't make a priority to calorie. In terms of taste, the degree of like for spicy was considerably different from individual (S.D.= 1.19). Secondly, regarding store choice determinants, Location, Price Level and Store Hygiene were the three important factors of undergraduate students. Especially they really care about the presence of pest in foodservice facilities (M=4.27).
On the other hand, Store Atmosphere and Congestion (even though they surely recognize time poverty for eating lunch) are less important factors. Japanese “university students have high priority to price”, “volume” and “menu variety” for lunch (Hasegawa et al., 2010). Also African American consumers also attached high level of importance to “freshness”, “hygiene” and “variety” when they eat at all-you-can-eat buffet restaurant (Oyewole, 2013). On the other hand, customers in Malaysia rated “low price” as fourth important factor for restaurant selection followed by “food variety”, “convenient location” and “hygiene” (Ungku et al., 2011). Table 2. Description of demographics and characteristics of subjects
Sample size 251 Sample size 251
Gender Number % WTP for lunch in campus Number %
Male 137 54.6 ~10,000 rupiah 7 2.8
Female 114 45.4 10,001~20,000 rupiah 154 61.4
Age Number % 20,001~30,000rupiah 61 24.3
17 3 1.2 30,001~40,000 rupiah 19 7.6
18 33 13.1 40,001~50,000rupiah 6 2.4
19 109 43.4 50,001~rupiah 4 1.6
20 57 22.7 WTP for lunch outside of campus Number %
21 13 5.2 ~10,000 rupiah 2 0.8
22 25 10.0 10,001~20,000 rupiah 28 11.2
23 9 3.6 20,001~30,000rupiah 62 24.7
24 2 0.8 30,001~40,000 rupiah 36 14.3
Academic Classfication Number % 40,001~50,000rupiah 52 20.7
Freshman 26 10.4 50,001~rupiah 71 28.3
Sophomore 171 68.1 Sleep Time Number %
Junior 9 3.6 Less than 3.0h 6 2.4
Senior 45 17.9 3.0h~4.5h 13 5.2
Reigion Type Number % 4.5h~6.0h 109 43.4
Muslim 121 48.2 6.0h~7.5h 90 35.9
Christian 102 40.6 7.5h~9.0h 31 12.4
Hindu 1 0.4 More than 9.0h 2 0.8
Buddha 13 5.2
Other Religions 14 5.6
Table 4. Factors Regrouped for Further Analysis Table 5. Mean Importance of Food Choice Determinants
Table 3. Mean Importance of Two Consumer Characteristics
Sample size 251
Time Poverty Number %
Strong Disagree 6 2.4
Disagree 28 11.2
Neutral 70 27.9
Agree 103 41.0
Strong Agree 44 17.5
Mean 3.60
Standard Deviation 0.98
Sample size 251
Food Restriction by Food Number %
Strong Disagree 19 7.6
Disagree 21 8.4
Neutral 50 19.9
Agree 43 17.1
Strong Agree 118 47.0
Mean 3.88
Standard Deviation 1.30
Grade Regrouped
Freshmen Sophomore Lower Grade Junior Senior Higher
Grade Sleeping Time Regrouped Religion Type Regrouped Less than 3.0h Short
Muslim Muslim 3.0h~4.5h
Christian Christian 4.5h~6.0h Medium
Hindu The Others 6.0h~7.5h
Buddha 7.5h~9.0h Long
Other Religions The Other
Factors Regrouped
Money Restriction Regrouped Strong Disagree Low
~10,000 rupiah Low Disagree Medium
10,001~20,000 rupiah Neutral High
20,001 ~30,000 rupiah Medium Agree 30,001 ~40,000 rupiah Strong Agree 40,001 ~50,000 rupiah High
50,001 ~rupiah
Food Choice Determinant Item ( 5 Scale) Mean S.D.
Food Price the price is cheap 4.23 0.81
Volume the portion is big 3.72 0.89
Serving Time I can start to eat it quickly 3.50 0.86
Calorie the food is high calorie 2.87 1.01
Nutrient I can get high nutrient from the food 3.55 0.98
Food Hygiene the food is heated enough 4.14 0.82
Taste
Sweet 3.82 0.88
Salty 3.90 0.88
Bitter 1.45 0.69
Sour 2.69 1.05
Table 5 and Table 6 display the mean importance of each food choice determinants and store choice determinants respectively. Food Price and Food Hygiene were substantial factor for undergraduate students. Especially, the highest score item of Hygiene was related to pest existence. In fact, when we eat at street vendor, usually there are many pests around our dishes. It implies that at a glance students do not seem to care flies when they eat, but actually they really care them. On the other hand, they didn't make a priority to calorie. In terms of taste, the degree of like for spicy was considerably different from individual (S.D.= 1.19). Secondly, regarding store choice determinants, Location, Price Level and Store Hygiene were the three important factors of undergraduate students. Especially they really care about the presence of pest in foodservice facilities (M=4.27).
On the other hand, Store Atmosphere and Congestion (even though they surely recognize time poverty for eating lunch) are less important factors. Japanese “university students have high priority to price”, “volume” and “menu variety” for lunch (Hasegawa et al., 2010). Also African American consumers also attached high level of importance to “freshness”, “hygiene” and “variety” when they eat at all-you-can-eat buffet restaurant (Oyewole, 2013). On the other hand, customers in Malaysia rated “low price” as fourth important factor for restaurant selection followed by “food variety”, “convenient location” and “hygiene” (Ungku et al., 2011). Table 2. Description of demographics and characteristics of subjects
Sample size 251 Sample size 251
Gender Number % WTP for lunch in campus Number %
Male 137 54.6 ~10,000 rupiah 7 2.8
Female 114 45.4 10,001~20,000 rupiah 154 61.4
Age Number % 20,001~30,000rupiah 61 24.3
17 3 1.2 30,001~40,000 rupiah 19 7.6
18 33 13.1 40,001~50,000rupiah 6 2.4
19 109 43.4 50,001~rupiah 4 1.6
20 57 22.7 WTP for lunch outside of campus Number %
21 13 5.2 ~10,000 rupiah 2 0.8
22 25 10.0 10,001~20,000 rupiah 28 11.2
23 9 3.6 20,001~30,000rupiah 62 24.7
24 2 0.8 30,001~40,000 rupiah 36 14.3
Academic Classfication Number % 40,001~50,000rupiah 52 20.7
Freshman 26 10.4 50,001~rupiah 71 28.3
Sophomore 171 68.1 Sleep Time Number %
Junior 9 3.6 Less than 3.0h 6 2.4
Senior 45 17.9 3.0h~4.5h 13 5.2
Reigion Type Number % 4.5h~6.0h 109 43.4
Muslim 121 48.2 6.0h~7.5h 90 35.9
Christian 102 40.6 7.5h~9.0h 31 12.4
Hindu 1 0.4 More than 9.0h 2 0.8
Buddha 13 5.2
Other Religions 14 5.6
Table 4. Factors Regrouped for Further Analysis Table 5. Mean Importance of Food Choice Determinants Table 3. Mean Importance of Two Consumer
Characteristics
Sample size 251
Time Poverty Number %
Strong Disagree 6 2.4
Disagree 28 11.2
Neutral 70 27.9
Agree 103 41.0
Strong Agree 44 17.5
Mean 3.60
Standard Deviation 0.98
Sample size 251
Food Restriction by Food Number %
Strong Disagree 19 7.6
Disagree 21 8.4
Neutral 50 19.9
Agree 43 17.1
Strong Agree 118 47.0
Mean 3.88
Standard Deviation 1.30
Grade Regrouped
Freshmen Sophomore Lower Grade Junior Senior Higher
Grade Sleeping Time Regrouped Religion Type Regrouped Less than 3.0h Short
Muslim Muslim 3.0h~4.5h
Christian Christian 4.5h~6.0h Medium
Hindu The Others 6.0h~7.5h
Buddha 7.5h~9.0h Long
Other Religions The Other
Factors Regrouped
Money Restriction Regrouped Strong Disagree Low
~10,000 rupiah Low Disagree Medium
10,001~20,000 rupiah Neutral High
20,001 ~30,000 rupiah Medium Agree 30,001 ~40,000 rupiah Strong Agree 40,001 ~50,000 rupiah High
50,001 ~rupiah
Food Choice Determinant Item ( 5 Scale) Mean S.D.
Food Price the price is cheap 4.23 0.81
Volume the portion is big 3.72 0.89
Serving Time I can start to eat it quickly 3.50 0.86
Calorie the food is high calorie 2.87 1.01
Nutrient I can get high nutrient from the food 3.55 0.98 Food Hygiene the food is heated enough 4.14 0.82
Taste
Sweet 3.82 0.88
Salty 3.90 0.88
Bitter 1.45 0.69
Sour 2.69 1.05
* Significant at .05, ** Sinificant at. 01 Kruskal-Wallis test * Significant at .05, ** Significant at .01
4.2. Hypothesis Validation
4.2.1. Gender
Regarding food choice determinants, Volume and Taste (Spicy) tested significant. These two factors had also significant gender difference among Japanese undergraduate students (Hasegawa et al., 2012). Male students prefer bigger portion (Female=3.54, Male=3.87,
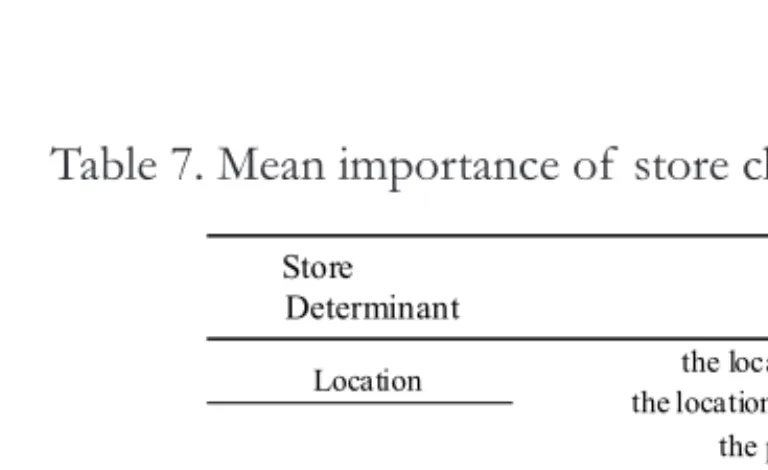
p<0.01). We also found that females rated spicy foods as more palatable (Female=4.04, Male=3.45, p<0.001). In contrast, there was no association between sex and spicy food preferences, where subjects were Caucasian and Asian (Ludy & Mattes, 2012). Considering these findings, Indonesian young girls may have reasons for eating spicy foods such as beauty, curiosity. Regarding store choice determinants, Atmosphere (exterior and comfortable), Variety and Store Hygiene tested significant. Female students rated all significant factors of store choice determinants higher than males (see Table 7). Food industries need to pay attention to these rate differences by gender if they attempt to sale food products for female.
4.2.2. Grade
Grade tested on 5 items include 3 food choice determinants; Taste (Sweet, Bitter), Serving Time and 2 store choice determinants; Location, and Store Hygiene. Higher Grade examinees needed short time of eating food. Lower grade rated sweet as more palatable (LG =3.87, HG= 3.61, p<0.05) and rated bitter taste as less palatable (LG=1.43, HG=1.64,
p<0.05). Lower grade respondents preferred food facilities near from campus more (LG=4.69, HG=4.41, p<0.01).
4.2.3. Religion Type and Religious Restriction
Religion type tested significant on Nutrient and Taste (Sweet). Muslim and Christian respondents rated sweet foods as more (Moslem=3.91, Christian=3.79, The Others
=3.50, p<0.05). In addition, Muslim
respondents tend to care food nutrient compared to the other religions (Muslim=3.71, Christian=3.39, Others =3.43, p<0.05). There was no association between the level of religious restriction and the level of importance of food choice determinants. Table 6. Mean Importance of Store Choice Determinants
the location is near from campus 4.63 0.64
the location is ac cessible to transportation 4.31 0.77
the place's exterior is nice 3.12 1.02
the place's interior is nice 3.27 1.05
the place is comfortable to use(s tay) 3.88 0.96
the place's price level is low 4.17 0.91
the place's price is suitable for food quality 4.22 0.87
Variety the place has a wide variety of foods 3.90 0.87
the s taff behavior is cheerful 3.73 0.97
the staff beavior is kind and friendly 3.75 0.94
Friend's Preference I follow my friend's sugges tion 3.42 0.98
no bad smell in the place 4.18 0.99
no bad smell from the s urrounding environment 4.13 1.01 the table and/or table cloth is clean 3.84 0.97 the utens ils (folk,dish etc .) for serving food are c lean 4.08 0.95 the table equipment (napkin/toothpick etc.) is enough 3.92 0.98 no pest (fly, cockroach) is found in the place 4.27 0.99
the restroom is c lean 3.68 1.06
Serving Time the food s erving s peed is fas t in overall 3.94 0.87
Degree of Congestion the place is usally not c rowded 3.29 1.06
S.D.
Store Choice
Determinant Item (5 Scale)
Location
Table 7. Mean importance of store choice determinants by gender
n=251
Mean S.D. Mean S.D.
the location is near from campus 4.58 0.68 4.68 0.59 0.174 the location is accessible to transportation 4.23 0.84 4.40 0.68 0.170 the place's exterior is nice 3.01 1.00 3.25 1.04 0.043* the place's interior is nice 3.18 0.99 3.38 1.10 0.083 the place is comfortable to use(stay) 3.79 0.92 3.99 1.00 0.038*
the place's price level is low 4.28 0.86 4.04 0.96 0.074 the place's price is suitable for food quality 4.13 0.93 4.32 0.80 0.126 Variety the place has a wide variety of foods 3.74 0.84 4.10 0.87 0.002**
the staff behavior is cheerful 3.66 1.03 3.80 0.89 0.300 the staff beavior is kind and friendly 3.72 0.94 3.79 0.95 0.470 Friend's Preference I follow my friend's suggestion 3.36 1.06 3.49 0.88 0.414 no bad smell in the place 4.07 1.06 4.31 0.89 0.083 no bad smell from the surrounding environment 4.02 1.03 4.25 0.99 0.041*
the table and/or table cloth is clean 3.67 0.99 4.04 0.91 0.003** the utensils (folk,dish etc.) for serving food are clean3.91 1.03 4.29 0.80 0.005** the table equipment (napkin/toothpick etc.) is enough3.77 0.97 4.11 0.97 0.003** no pest (fly, cockroach) is found in the place 4.16 1.06 4.40 0.89 0.057
the restroom is clean 3.48 1.04 3.92 1.03 0.001** Serving Time the food serving speed is fast in overall 3.86 0.87 4.04 0.86 0.084
Degree of Congestion 3.28 1.12 3.31 0.99 0.833
The length of sleeping time showed significant influence on the preference level of “Taste (Sour)” and the importance level of “Serving Time”. Table 8 showed that with shorter sleeping, students are more likely to prefer sour taste (Low=2.89, Medium=2.72, High=2.36,
p<0.05). Since sour foods have an inhibitory effect on fatigue, it is inferred that students with short sleep time may eat sour foods to get rid of fatigue. Also, they had higher priority about if they can eat foods quickly. This result corresponds approximately to Japanese students' eating behavior by sleeping time. It showed that short sleeping times urge the speed of eating and the frequency of eating fast food and may contribute to eating much (Nishitani et al., 2012).
4.2.5. Money Restriction
The level of WTP inside of campus showed significant influence on Location (distance) and Store Hygiene (utensils' cleanness). In likewise, level of WTP outside of campus showed significant influence on Volume, Calorie, Nutrient, and Congestion as depicted in Table 9. Because students with medium WTP rated Calorie and Nutrient lowest of all,
we speculate that students with medium level of WTP tend to be less sensitive with diet. In addition, we discovered that they pay less attention to the degree of congestion and that the higher their WTP is, the higher the level of importance of Volume is.
4.2.6. Time Poverty
* Significant at .05, ** Sinificant at. 01 Kruskal-Wallis test * Significant at .05, ** Significant at .01
4.2. Hypothesis Validation
4.2.1. Gender
Regarding food choice determinants, Volume and Taste (Spicy) tested significant. These two factors had also significant gender difference among Japanese undergraduate students (Hasegawa et al., 2012). Male students prefer bigger portion (Female=3.54, Male=3.87, p<0.01). We also found that females rated spicy foods as more palatable (Female=4.04, Male=3.45, p<0.001). In contrast, there was no association between sex and spicy food preferences, where subjects were Caucasian and Asian (Ludy & Mattes, 2012). Considering these findings, Indonesian young girls may have reasons for eating spicy foods such as beauty, curiosity. Regarding store choice determinants, Atmosphere (exterior and comfortable), Variety and Store Hygiene tested significant. Female students rated all significant factors of store choice determinants higher than males (see Table 7). Food industries need to pay attention to these rate differences by gender if they attempt to sale food products for female.
4.2.2. Grade
Grade tested on 5 items include 3 food choice determinants; Taste (Sweet, Bitter), Serving Time and 2 store choice determinants; Location, and Store Hygiene. Higher Grade examinees needed short time of eating food. Lower grade rated sweet as more palatable (LG =3.87, HG= 3.61, p<0.05) and rated bitter taste as less palatable (LG=1.43, HG=1.64, p<0.05). Lower grade respondents preferred food facilities near from campus more (LG=4.69, HG=4.41, p<0.01).
4.2.3. Religion Type and Religious Restriction
Religion type tested significant on Nutrient and Taste (Sweet). Muslim and Christian respondents rated sweet foods as more (Moslem=3.91, Christian=3.79, The Others =3.50, p<0.05). In addition, Muslim respondents tend to care food nutrient compared to the other religions (Muslim=3.71, Christian=3.39, Others =3.43, p<0.05). There was no association between the level of religious restriction and the level of importance of food choice determinants. Table 6. Mean Importance of Store Choice Determinants
the location is near from campus 4.63 0.64 the location is ac cessible to transportation 4.31 0.77 the place's exterior is nice 3.12 1.02 the place's interior is nice 3.27 1.05 the place is comfortable to use(s tay) 3.88 0.96 the place's price level is low 4.17 0.91 the place's price is suitable for food quality 4.22 0.87 Variety the place has a wide variety of foods 3.90 0.87 the s taff behavior is cheerful 3.73 0.97 the staff beavior is kind and friendly 3.75 0.94 Friend's Preference I follow my friend's sugges tion 3.42 0.98 no bad smell in the place 4.18 0.99 no bad smell from the s urrounding environment 4.13 1.01 the table and/or table cloth is clean 3.84 0.97 the utens ils (folk,dish etc .) for serving food are c lean 4.08 0.95 the table equipment (napkin/toothpick etc.) is enough 3.92 0.98 no pest (fly, cockroach) is found in the place 4.27 0.99 the restroom is c lean 3.68 1.06 Serving Time the food s erving s peed is fas t in overall 3.94 0.87 Degree of Congestion the place is usally not c rowded 3.29 1.06 S.D. Store Choice
Determinant Item (5 Scale) Location
Table 7. Mean importance of store choice determinants by gender
n=251
Mean S.D. Mean S.D.
the location is near from campus 4.58 0.68 4.68 0.59 0.174 the location is accessible to transportation 4.23 0.84 4.40 0.68 0.170 the place's exterior is nice 3.01 1.00 3.25 1.04 0.043* the place's interior is nice 3.18 0.99 3.38 1.10 0.083 the place is comfortable to use(stay) 3.79 0.92 3.99 1.00 0.038*
the place's price level is low 4.28 0.86 4.04 0.96 0.074 the place's price is suitable for food quality 4.13 0.93 4.32 0.80 0.126 Variety the place has a wide variety of foods 3.74 0.84 4.10 0.87 0.002**
the staff behavior is cheerful 3.66 1.03 3.80 0.89 0.300 the staff beavior is kind and friendly 3.72 0.94 3.79 0.95 0.470 Friend's Preference I follow my friend's suggestion 3.36 1.06 3.49 0.88 0.414 no bad smell in the place 4.07 1.06 4.31 0.89 0.083 no bad smell from the surrounding environment 4.02 1.03 4.25 0.99 0.041*
the table and/or table cloth is clean 3.67 0.99 4.04 0.91 0.003** the utensils (folk,dish etc.) for serving food are clean3.91 1.03 4.29 0.80 0.005** the table equipment (napkin/toothpick etc.) is enough3.77 0.97 4.11 0.97 0.003** no pest (fly, cockroach) is found in the place 4.16 1.06 4.40 0.89 0.057
the restroom is clean 3.48 1.04 3.92 1.03 0.001**
Serving Time the food serving speed is fast in overall 3.86 0.87 4.04 0.86 0.084
Degree of Congestion 3.28 1.12 3.31 0.99 0.833
The length of sleeping time showed significant influence on the preference level of “Taste (Sour)” and the importance level of “Serving Time”. Table 8 showed that with shorter sleeping, students are more likely to prefer sour taste (Low=2.89, Medium=2.72, High=2.36, p<0.05). Since sour foods have an inhibitory effect on fatigue, it is inferred that students with short sleep time may eat sour foods to get rid of fatigue. Also, they had higher priority about if they can eat foods quickly. This result corresponds approximately to Japanese students' eating behavior by sleeping time. It showed that short sleeping times urge the speed of eating and the frequency of eating fast food and may contribute to eating much (Nishitani et al., 2012).
4.2.5. Money Restriction
The level of WTP inside of campus showed significant influence on Location (distance) and Store Hygiene (utensils' cleanness). In likewise, level of WTP outside of campus showed significant influence on Volume, Calorie, Nutrient, and Congestion as depicted in Table 9. Because students with medium WTP rated Calorie and Nutrient lowest of all,
we speculate that students with medium level of WTP tend to be less sensitive with diet. In addition, we discovered that they pay less attention to the degree of congestion and that the higher their WTP is, the higher the level of importance of Volume is.
4.2.6. Time Poverty
Badan Pusat Statistik. (2012).Perkembangan Beberapa Indikator Utama Sosial-Ekonomi Indonesia. Web site: (2012). Gender and Race are Significant Determinants of Students' Food Choices on a College Campus, Journal of Nutrition Education and Behavior, 44(4), 372-378.
Catanzaro, D., Chesbro, E.C., and Velkey, A.J. (2013). Relationship between food preferences and PROP taster status of
college students. Appetite, 68, 124-131.
Elaine H.Asp (1999). Factors affecting food decisions made by individual consumers, Food Policy, 24, 287-294.
Fatimah, U.Z.A.U., Boo, H.C., Sambasivan, M.,
and Salleh, R. (2011). Foodservice
hygiene factors—The consumer
perspective. International Journal of
Hospitality Management, 30(1),38-45. Marketing study regarding Romanian consumers behavior towards fast-food
products, Procedia Economics and Finance
,3, 397-402.
Global Center for Education and Research on Human Security Engineering for Asian M e g a c i t i e s ( 2 0 0 9 ) . B a n d u n g h t t p : / / h s e . g c o e . k y o t o -u.ac.jp/en/bases/bandung/
Japan External Trade Organization JETRO (2010). Report about the latest dining out trend in Indonesia, Web site:
http://www.jetro.go.jp/world/asia/idn/food s/trends/1010002.html
Table 8. Mean importance ratings of food choice determinants by the length of sleep time
Table 9. Mean values of significant factors for WTP for lunch outside of campus
Factor
Low Medium High P for trend
Sour taste preference level 2.89± 0.99 2.72 ± 1.06 2.36 ± 0.93 p<0.05
Serving Time 3.65 ± 0.87 3.42 ± 0.69 3.24 ± 0.87 p<0.05
ANOVA Lentgth of sleeping time
Factor
Low Medium High P for trend
Volume 3.44 ± 0.88 3.66 ± 0.82 3.80 ± 0.90 p<0.05
Calorie 2.79 ± 1.15 2.66 ± 0.90 2.96 ± 1.00 p<0.05
Nutrient 3.56 ± 0.97 3.38 ± 0.93 3.59 ± 1.00 p<0.05
Congestion 3.50 ± 1.07 3.10 ± 1.10 3.31 ± 1.05 p <0.001
ANOVA WTP for lunch outside of campus
Table 10. Mean values of Store Serving Time and Nutrient for the level of time poverty
Factor
Low Medium High P for trend
Store Seving Time 3.80 ± 0.93 3.93 ± 0.85 4.26 ± 0.75 p<0.05
Nutrient 3.91 ± 1.11 3.51 ± 0.91 3.48 ± 0.96 p<0.05
ANOVA The level of Time Poverty
5. Managerial Implication
This research provides managerial implications. Following price and location (nearness), hygiene is the third important factor. Female students tend to care hygiene factors more than males. Thus, food industries and canteen staffs should pay more attention to heating process, smell inside or ambience of store, and expel pests before checking store design and caring food calorie.
6. Conclusion and Limitations
This research investigated four dimensions of eating behavior presented by undergraduate students in Indonesia comprehensively and all hypothesizes formulated were partly supported. In results and discussion part, we found the priority of choosing food and store by respondents and showed national difference by using previous related research. These findings may help poor knowledge develop.
There are several limitations in this research. First, focusing only lunch time may make the range of their behavior limited. Second, we didn't include birth place as consumer characteristics, which can be salient element effecting priority of their food choice determinants. Third, we did not input actual store choice of respondents. Fourth, the undergraduate students only from ITB which is located only in Bandung not include Jatinangor and UNPAR which is located in Bandung. Addressing with these limitations may be useful for further research on consumer behavior topic.
References
Alibabic, V., Jokic, S., Mujic, I, Rubic, D., Bajramovic, M., and Jukic, H. (2011). Attitudes, behaviors, and perception of consumers' from northwestern Bosnia and Herzegovina toward food products
on the market, Procedia Social and
Behavioral Sciences , 15, 2932-2937.
Kitano, N., Ganeko, N., Kawakami, I., Ikegami, Y., Numata, K., Nakashima, N., and Etoh, H. (2012). A present state of attitudes to cooking in university students, and changes on the attitudes and the skills through a cooking class, The Japan Association for the Integrated study of Dietary Habits, 22(4), 308-314.
Ludy M.J., and Mattes, R.D. (2012). ,
Comparison of sensory, physiological, personality, and cultural attributes in regular spicy food users and non-users, Appetite, 58, 19-27.
Musingo, M.N., and Wang, L. (2009). Analysis of Eating Habits According to Socio-Demographic Characteristics of
College Students, Pakistan Journal of
Nutrition, 8(10), 1575-1580
Nishitani, N., Sakakibara, H., and Akiyama, I. (2012). Characteristics of short sleeping time and eating behaviors related to
obesity, Obesity Research & Clinical
Practice, 6(2), e103-e109.
Oyewole, P. (2013). The role of frequency of patronage and service quality of
all-you-can-eat buffet restaurant: A
perspective of socio-economic and demographic characteristics of African
American consumers, International
Journal of Hospitality Management, 34, 202-213.
Pan, Y., and Zinkhan, G.M. (2006).
Determinants of retail patronage: A meta-analytical perspective, Journal of Retailing, 82(3), 229-243.
Pender, N.J., and Pender, A.R (1986). Attitudes, subjective norms, and intentions to
engage in health behaviors, Nursing
Research, 35, 15–18.
Population Division of the Department of Economic and Social Affairs of the
United Nations Secretariat (2013).World
Population Prospects: The 2012 Revision. Tomoko, H., Sumio, I., Ikko, K., and
Badan Pusat Statistik. (2012).Perkembangan Beberapa Indikator Utama Sosial-Ekonomi Indonesia. Web site:
http://www.bps.go.id/int/index.php/s (2012). Gender and Race are Significant Determinants of Students' Food
Choices on a College Campus, Journal of
Nutrition Education and Behavior, 44(4), 372-378.
Catanzaro, D., Chesbro, E.C., and Velkey, A.J. (2013). Relationship between food preferences and PROP taster status of college students. Appetite, 68, 124-131. Elaine H.Asp (1999). Factors affecting food
decisions made by individual consumers,
Food Policy, 24, 287-294.
Fatimah, U.Z.A.U., Boo, H.C., Sambasivan, M.,
and Salleh, R. (2011). Foodservice
hygiene factors—The consumer
perspective. International Journal of
Hospitality Management, 30(1),38-45. Galefd, B.G. J.R. (1995). Food Selection:
Problems in Understanding How we
Choose Foods to Eat. Neuroscience and
Behavioral Reviews, 20(1), 67-73.
Meghisan, G.M., and Meghisan, F. (2012). Marketing study regarding Romanian consumers behavior towards fast-food
products, Procedia Economics and Finance
,3, 397-402.
Global Center for Education and Research on Human Security Engineering for Asian M e g a c i t i e s ( 2 0 0 9 ) . B a n d u n g
h t t p : / / h s e . g c o e . k y o t o -u.ac.jp/en/bases/bandung/
Japan External Trade Organization JETRO (2010). Report about the latest dining out trend in Indonesia, Web site:
http://www.jetro.go.jp/world/asia/idn/food s/trends/1010002.html
Table 8. Mean importance ratings of food choice determinants by the length of sleep time
Table 9. Mean values of significant factors for WTP for lunch outside of campus
Factor
Low Medium High P for trend
Sour taste preference level 2.89± 0.99 2.72 ± 1.06 2.36 ± 0.93 p<0.05
Serving Time 3.65 ± 0.87 3.42 ± 0.69 3.24 ± 0.87 p<0.05
ANOVA Lentgth of sleeping time
Factor
Low Medium High P for trend
Volume 3.44 ± 0.88 3.66 ± 0.82 3.80 ± 0.90 p<0.05
Calorie 2.79 ± 1.15 2.66 ± 0.90 2.96 ± 1.00 p<0.05
Nutrient 3.56 ± 0.97 3.38 ± 0.93 3.59 ± 1.00 p<0.05
Congestion 3.50 ± 1.07 3.10 ± 1.10 3.31 ± 1.05 p <0.001
ANOVA WTP for lunch outside of campus
Table 10. Mean values of Store Serving Time and Nutrient for the level of time poverty
Factor
Low Medium High P for trend
Store Seving Time 3.80 ± 0.93 3.93 ± 0.85 4.26 ± 0.75 p<0.05
Nutrient 3.91 ± 1.11 3.51 ± 0.91 3.48 ± 0.96 p<0.05
ANOVA The level of Time Poverty
5. Managerial Implication
This research provides managerial implications. Following price and location (nearness), hygiene is the third important factor. Female students tend to care hygiene factors more than males. Thus, food industries and canteen staffs should pay more attention to heating process, smell inside or ambience of store, and expel pests before checking store design and caring food calorie.
6. Conclusion and Limitations
This research investigated four dimensions of eating behavior presented by undergraduate students in Indonesia comprehensively and all hypothesizes formulated were partly supported. In results and discussion part, we found the priority of choosing food and store by respondents and showed national difference by using previous related research. These findings may help poor knowledge develop.
There are several limitations in this research. First, focusing only lunch time may make the range of their behavior limited. Second, we didn't include birth place as consumer characteristics, which can be salient element effecting priority of their food choice determinants. Third, we did not input actual store choice of respondents. Fourth, the undergraduate students only from ITB which is located only in Bandung not include Jatinangor and UNPAR which is located in Bandung. Addressing with these limitations may be useful for further research on consumer behavior topic.
References
Alibabic, V., Jokic, S., Mujic, I, Rubic, D., Bajramovic, M., and Jukic, H. (2011). Attitudes, behaviors, and perception of consumers' from northwestern Bosnia and Herzegovina toward food products
on the market, Procedia Social and
Behavioral Sciences , 15, 2932-2937.
Kitano, N., Ganeko, N., Kawakami, I., Ikegami, Y., Numata, K., Nakashima, N., and Etoh, H. (2012). A present state of attitudes to cooking in university students, and changes on the attitudes and the skills through a cooking class,
The Japan Association for the Integrated study of Dietary Habits, 22(4), 308-314.
Ludy M.J., and Mattes, R.D. (2012). ,
Comparison of sensory, physiological, personality, and cultural attributes in regular spicy food users and non-users,
Appetite, 58, 19-27.
Musingo, M.N., and Wang, L. (2009). Analysis of Eating Habits According to Socio-Demographic Characteristics of
College Students, Pakistan Journal of
Nutrition, 8(10), 1575-1580
Nishitani, N., Sakakibara, H., and Akiyama, I. (2012). Characteristics of short sleeping time and eating behaviors related to
obesity, Obesity Research & Clinical
Practice, 6(2), e103-e109.
Oyewole, P. (2013). The role of frequency of patronage and service quality of
all-you-can-eat buffet restaurant: A
perspective of socio-economic and demographic characteristics of African
American consumers, International
Journal of Hospitality Management, 34, 202-213.
Pan, Y., and Zinkhan, G.M. (2006).
Determinants of retail patronage: A meta-analytical perspective, Journal of Retailing, 82(3), 229-243.
Pender, N.J., and Pender, A.R (1986). Attitudes, subjective norms, and intentions to
engage in health behaviors, Nursing
Research, 35, 15–18.
Population Division of the Department of Economic and Social Affairs of the
United Nations Secretariat (2013).World
Population Prospects: The 2012 Revision. Tomoko, H., Sumio, I., Ikko, K., and
Nobuyuki, S. (2010).A psychological study of attitude toward eating and eating behavior of university students: From the perspective of the priority of
rating and personal expenditure, Journal
Yoshiko, K., and Roswith, R. (2009). The Difference of Eating Behavior between Austrian and Japanese University
Students, Journal of Yasuda Women's
University, 37,209-220.
Yamada, K., Abe, T., and Kimura, H (2008). Simulator of Consumer's Behavior in a
Store Using Multi-agent Model, Japan
Association for Consumer Studies, 13(1), 79-88.