Data Divination:
Big Data Strategies
Pam Baker
Cengage Learning PTR
Publisher and General Manager,
CENGAGE and CENGAGE LEARNING are registered trademarks of Cengage Learning, Inc., within the United States and certain other jurisdictions.
ALL RIGHTS RESERVED. No part of this work covered by the copyright herein may be reproduced, transmitted, stored, or used in any form or by any means graphic, electronic, or mechanical, including but not limited to photocopying, recording, scanning, digitizing, taping, Web distribution, information networks, or information storage and retrieval systems, except as permitted under Section107or108of the1976United States Copyright Act, without the prior written permission of the publisher.
For product information and technology assistance, contact us at
Cengage Learning Customer & Sales Support,1-800-354-9706.
For permission to use material from this text or product, submit all requests online atcengage.com/permissions. Further permissions questions can be emailed to
All trademarks are the property of their respective owners.
All images © Cengage Learning unless otherwise noted.
Library of Congress Control Number:2014937092
Cengage Learning is a leading provider of customized learning solutions with office locations around the globe, including Singapore, the United Kingdom, Australia, Mexico, Brazil, and Japan. Locate your local office at:
international.cengage.com/region.
Cengage Learning products are represented in Canada by Nelson Education, Ltd.
For your lifelong learning solutions, visitcengageptr.com. Visit our corporate website atcengage.com.
Printed in the United States of America 1 2 3 4 5 6 7 16 15 14
To my daughter Stephanie and my son Ben; you are my inspiration each and every day and the joy of my life. To my
mother Nana Duffey; my profound gratitude for teaching me critical thinking skills from a very early age and
First and foremost, I would like to thank the publishing team at Cengage Learning PTR for their hard work and patience during this time. Specifically, thank you Stacy Hiquet for publishing our text. Thank you Heather Hurley for facilitating this book and being the marvelous person that you are. Your professionalism is second to none but your demeanor is an absolute joy. Thank you Kezia Endsley for your calm management of the editing and deliverables, despite the challenges I inadvertently presented to you. Your many talents, eternal patience, and wise guidance were invaluable to this effort. You are by far the best editor I have had the pleasure of working with and I sincerely hope to have the honor of working with you again one day. Thank you Richard Santalesa for your thorough tech review and insightful suggestions. You are and always will be the greatest legal resource and tech editor a writer can ever have, not to mention the truest of friends. Thank you to the entire team at Cengage.
Many thanks also to my family for their patience and support during this time. Spending long and seemingly unending hours finishing the book is not only hard on the authors, but our families as well. A special thanks to two of my brothers—Steven Duffey and
John Duffey—for pitching in to create screenshots and such to exacting specs to help
speed completion of the book on such a tight deadline.
About the Authors
Pam Baker is a noted business analyst, tech freelance journalist and the editor of the
online publication and e-newsletter, FierceBigData. Her work is seen in a wide variety of respected publications, including but not limited to Institutional Investor magazine,
ReadWriteWeb, CIO (paper version), CIO.com, Network World, Computerworld, IT World, LinuxWorld, iSixSigma, and TechNewsWorld. Further she formerly served as a contracted analyst for London-based VisionGain Research and Evans Data Corp, head-quartered in Santa Cruz, California. She has also served as a researcher, writer, and man-aging editor of Wireless I.Q. and Telematics Journal for ABI Research, headquartered in New York.
Interested readers can view a variety of published clips and read more about Pam Baker and her work on these websites: Mediabistro Freelance Marketplace at http://www .mediabistro.com/PamBaker and the Internet Press Guild at http://www.netpress.org/ ipg-membership-directory/pambaker. There are also numerous professional references on her LinkedIn page at http://www.linkedin.com/in/pambaker/.
She has also authored numerous ebooks and several of the dead tree variety. Six of those books are listed on her Amazon Author Central page. Further, Baker co-authored two books on the biosciences for the Association of University Technology Managers (AUTM), a global nonprofit association of technology managers and business executives. Those two books were largely funded by the Bill and Melinda Gates Foundation.
Among other awards, Baker won international acclaim for her documentary on the paper-making industry and was awarded a Resolution from the City of Columbus, Georgia, for her news series on the city in Georgia Trend Magazine. The only other author to receive such recognition from the city was the legendary Carson McCullers. Baker is a member of the National Press Club (NPC) and the Internet Press Guild (IPG). You can follow or chat with her on Twitter where her handle is @bakercom1 or on Google + at google .com/+PamBaker. You can also reach her through the contact form at FierceBigData where she is the editor (see http://www.fiercebigdata.com/).
Bob Gourleyis a contributing writer inData Divination.He wrote a significant portion of
the chapter on use cases in the Department of Defense and Intelligence Community given that is the area he focuses on in his work with big data. Gourley also wrote the chapter on Empowering the Workforce. He is the editor in chief of CTOvision.com and is the founder and Chief Technology Officer (CTO) of Crucial Point LLC, a technology research and advisory firm.
Bob was named one of the top 25 most influential CTOs in the globe by InfoWorld, and one of DC’s“Tech Titans” byWashingtonian. Bob was named one of the “Top 25 Most
Fascinating Communicators in Government IT” by the Gov2.0 community GovFresh.
In 2012 Bob was noted as“Most Influential on Twitter for Big Data”byForbes.
Bob holds three master’s degrees including a master of science degree in scientific and
technical intelligence from Naval Postgraduate School, a master of science degree in mili-tary science from USMC university, and a master of science degree in computer science from James Madison University. Bob has published over 40 articles on a wide range of topics and is a contributor to the January 2009 book titled Threats in the Age of Obama. His blog, CTOvision, is now ranked among the top federal technology blogs by
WashingtonTech.
Contents
Introduction . . . xv
Chapter 1 What Is Big Data, Really? . . . 1
Technically Speaking . . . 1
Why Data Size Doesn’t Matter. . . 5
What Big Data Typically Means to Executives. . . 5
The“Data Is Omnipotent”Group . . . .6
The“Data Is Just Another Spreadsheet”Group . . . .6
Big Data Positioned in Executive Speak . . . 7
Summary . . . 14
Chapter 2 How to Formulate a Winning Big Data Strategy . . . 17
The Head Eats the Tail . . . 17
How to End the“Who’s on First”Conundrum . . . 20
Changing Perspectives of Big Data . . . 20
User Perception Versus the Data-Harvesting Reality . . . 21
The Reality of Facebook’s Predictive Analytics . . . 22
Facebook’s Data Harvesting Goes Even Further . . . 23
Using Facebook to Open Minds on the Possibilities and Potential of Big Data . . . 24
Professional Perceptions Versus Data Realities . . . 24
From Perception to Cognitive Bias. . . 25
Finding the Big Data Diviners . . . 26
Next Step: Embracing Ignorance . . . 28
Where to Start . . . 29
Begin at the End . . . 31
Outdated Models Invite Disruptors . . . 63
Chapter 5 Why the Answer to Your Big Data Question Resembles a Rubik’s Cube . . . 73
What Is Actionable Data Anyway? . . . 74
The Difference Among Descriptive, Predictive, and Prescriptive Analytics . . . 77
Descriptive Analytics. . . 78
Formulas for Calculating Project Returns . . . 109
Chapter 8 Rise of the Collaborative Economy and Ways to Profit from It. . . 115
Data Is Knowledge and an Asset . . . 115
Big Data’s Biggest Impact: Model Shattering . . . 117
The Sharing Economy . . . 119
The Maker Movement . . . 121
Co-Innovation . . . 123
Examples of New Models Emerging in the New Collaborative Economy . . . 124
Agile Is Out, Fluid Is In . . . 126
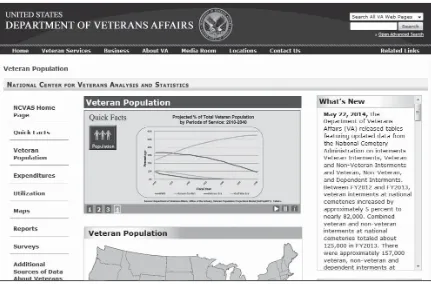
How John Q. Public’s and Veterans’Data Help Other Nations Plan Attacks . . . 137
Chapter 10 Use Cases in the Department of Defense and Intelligence
Community . . . 171
Situational Awareness and Visualization . . . 172
Information Correlation for Problem Solving (the“Connect the Dots”Problem) . . . 174
Information Search and Discovery in Overwhelming Amounts of Data (the“Needle in Haystack”Problem) . . . 179
Enterprise Cyber Security Data Management . . . 182
Logistical Information, Including Asset Catalogs Across Extensive/ Dynamic Enterprises . . . 183
From Google to the CDC . . . 236
The Claim that the Data Is Used Only to“Help”the Farmer Farm More Profitably. . . 273
The Claim that the Farmer’s Data Will Remain Private . . . 274
Money, Money, Money: How Big Data Is Broadening Your Borrowing Power. . . 275
How 3D Printing Is Changing Manufacturing and Disrupting Its Customers. . . 364
WinSun Prints 10 Homes in a Single Day. . . 365
The 3D Printed Landscape House . . . 365
The 3D Printed Canal House . . . 367
The Impact of 3D Home Printing on Manufacturing . . . 367
The Shift to Additive Manufacturing Will Be Massive and Across All Sectors . . . . 368
How Personalized Manufacturing Will Change Everything and Create Even More Big Data . . . 370
Use Cases in the Department of Defense and Intelligence Community . . . 393
Introduction
Amidst all the big data talk, articles, and conference speeches lies one consistently un-answered question: What can we actually do with big data? Sure, the answer is alluded to frequently but only in the vaguest and most general terms. Few spell out where to begin, let alone where to go with big data from there. Answers to related questions—from how
to compute ROI for big data projects and monetize data to how to develop a winning strategy and ultimately how to wield analytics to transform entire organizations and industries—are even rarer. That’s why Data Divination was written—to answer all of
those most pressing questions and more from a high-level view.
This Book Is for You If
If you are interested in the business end of big data rather than the technical nuts and bolts, this book is for you. Whether your business is a one-man operation or a global empire, you’ll find practical advice here on how and when to use big data to the greatest
effect for your organization. It doesn’t matter whether you are a data scientist, a
depart-ment head, an attorney, a small business owner, a non-profit head, or a member of the C-Suite or company board, the information contained within these pages will enable you to apply big data techniques and decision-making to your tasks.
Further, many of the chapters are dedicated to use cases in specific industries to serve as practical guides to what is being and can be done in your sector and business. Ten industries are addressed in exquisite detail in their own chapters. There you’ll find use
cases, strategies, underlying factors, and emerging trends detailed for the governments,
department of defense and intelligence community, security, healthcare, small businesses and farms, transportation, energy, retail, banking and insurance, and manufacturing sec-tors. However, it is a mistake to read only the chapter on your own industry, as changes wrought by big data in other industries will also affect you, if they haven’t already.
If there is one thing that big data is shaping up to be, it is a catalyst of disruption across the board. Indeed, it is helping meld entire industries in arguably the biggest surge of cross-industry convergence ever seen. It therefore behooves you to note which industries are converging with yours and which of your customers are reducing or eliminating a need for your services entirely. It’s highly likely that you’ll find more than a few surprises
here in that regard.
Strategy Is Everything
Data Divinationis about how to develop a winning big data strategy and see it to fruition. You’ll find chapters here dedicated to various topics aimed at that end. Included in these
pages are the answers to how to calculate ROI; build a data team; devise data monetiza-tion; present a winning business proposimonetiza-tion; formulate the right questions; derive action-able answers from analytics; predict the future for your business and industry; effectively deal with privacy issues; leverage visualizations for optimum data expressions; identify where, when, and how to innovate products and services; and how to transform your entire organization.
By the time you reach the end of this book, you should be able to readily identify what you need to do with big data, be that where to start or where to go next.
There are some references to tools here, but very few. Big data tools will age out over time, as all technologies do. However, your big data strategies will arch throughout time, morphing as needed, but holding true as the very foundation of your business. Strategy then is where you need to hold your focus and it is where you will find ours here.
Chapter 1
What Is Big Data, Really?
One would think that, given how the phrase“big data”is on the tip of nearly every tongue
and top of mind for most, everyone knows what big data is. That’s not quite the case.
Although there is a technical definition of sorts, most people are unsure of where the defining line is in terms of big versus regular data sizes. This creates some difficulty in communicating and thinking about big data in general and big data project parameters in particular.
This chapter considers the different interpretations of the meaning of the term“big data.”
Technically Speaking
As discussed in more detail in the next chapter, big data does not mean more of the same data, simply boosting gigabytes to terabytes, although obviously it includes the expected growth of existing data sets. Rather, big data is a collection of data sets, some structured and some unstructured, some “onboarded” from physical sources to online sets, some
transactional and some not, from a variety of sources, some in-house and some from third parties. Often it is stored in a variety of disparate and hard-to-reconcile forms. As a general rule, big data is clunky, messy, and hard, if not impossible, as well as signifi-cantly expensive, to shoe-horn into existing computing systems.
Furthermore, in the technical sense there is no widely accepted consensus as to the mini-mum size a data collective must measure to qualify as “big.” Instead the technical world
favors a definition more attuned to data characteristics and size relative to current com-puting capabilities.
You’ll commonly hear big data defined as “containing volume, velocity, and variety”
which is the three-legged definition coined by a 2001 Gartner (then Meta) report. These days, some people throw in a fourth“v,”—veracity—to cover data quality issues too.
But in essence big data is whatever size data set requires new tools in order to compute. Therefore, data considered big by today’s standards will likely be considered small or
aver-age by future computing standards.
That is precisely why attaching the word “big” to data is unfortunate and not very useful.
In the near future most industry experts expect the word big to be dropped entirely as it fails to accurately describe anything essential to the concept. For what makes “big data”
truly valuable are the “big connections” it makes possible—between people, places, and
things—that were previously impossible to glean in any coherent fashion.
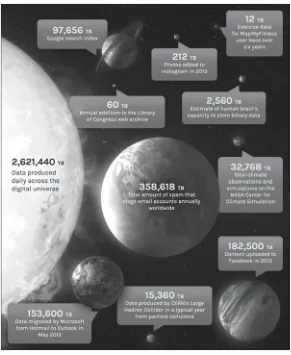
Even so, there are those who try to affix a specific size to big data, generally in terms of terabytes. However this is not a static measurement. The measure generally refers to the amount of data flowing in or growing in the datacenter in a set timeframe, such as weekly. Conversely, since data is growing so quickly everywhere, at an estimated rate of 2,621,440 terabytes daily according to the Rackspace infographic in Figure 1.1, a static measurement for a “big data” set is frequently meaningless after a very short time. (This infographic
Figure 1.1
This interactive infographic has a counter at the top that shows how many terabytes of data were added to the digital universe since the user opened the infographic. The speed in which the counter counts gives you a good idea of just how fast data is growing overall. By rolling a mouse over the different planets, the user reveals the size of data in different categories relative to the size of all data generated (represented here as the sun) such as in email spam, in the Google search index, and in Facebook.
Source: Infographic courtesy of Rackspace. Concept and research by Dominic Smith; design and rendering by Legacy79.
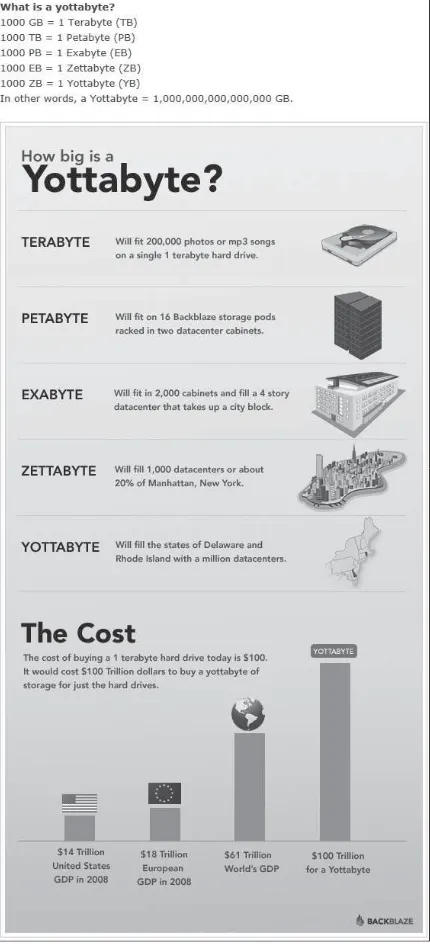
Already we know that bigger data is coming. Data sets so big that we don’t yet have a
measuring term for it. But until then we’ll use the measurements we do have: first up is
zettabytes and then yottabytes. To give you an understanding of the magnitude of a yotta-byte, consider that it equals one quadrillion gigabytes or one septillion bytes—that is a
1 followed by 24 zeroes. Consider Figure 1.2 for other ways to visualize the size of a yottabyte.
Figure 1.2
This graphic and accompanying text visualize the actual size of a yottabyte.
As hard as that size is to imagine, think about what comes next. We have no word for the next size and therefore can barely comprehend what we can or should do with it all. It is, however, certain that extreme data will arrive soon.
Why Data Size Doesn
’
t Matter
Therefore the focus today is primarily on how best to access and compute the data rather than how big it is. After all, the value is in the quality of the data analysis and not in its raw bulk.
Feel confused by all this? Rest assured, you are in good company. However, it is also a relief to learn that many new analytic tools can be used on data of nearly any size and on data collections of various levels of complexities and formats. That means data science teams can use big data tools to derive value from almost any data. That is good news indeed because the tools are both affordable and far more capable of fast (and valuable) analysis than their predecessors.
Your company will of course have to consider the size of its data sets in order to ultimately arrange and budget for storage, transfer, and other data management related realities. But as far as analytical results, data size doesn’t much matter as long as you use
a large enough data set to make the findings significant.
What Big Data Typically Means to Executives
Executives, depending on their personal level of data literacy, tend to view big data as somewhat mysterious but useful to varying degrees. Two opposing perceptions anchor each endpoint of the executive viewpoint spectrum. One end point views big data as a reveal all and tell everything tool whereas the other end of the spectrum sees it is simply as a newfangled way to deliver analysis on more of the same data they are accustomed to seeing in the old familiar spreadsheet. Even when presented with visualizations, the second group tends to perceive it, at least initially, as another form of the spreadsheet.
There are lots of other executive perceptions between these two extremes, of course. But it is useful for your purposes here to consider the two extremes—omniscience and
spread-sheet upgrade—in order to quickly assess the executive expectations. This will better
prepare you to deliver data findings in the manner most palatable and useful to your individual executives.
The
“
Data Is Omnipotent
”
Group
For the first group, it may be necessary to explain that while big data can and does pro-duce results heretofore not possible, it is not, nor will it ever be, omniscience as is often depicted in many movies. In other words, data, no matter how huge and comprehensive, will never be complete and rarely in proper context. Therefore, it cannot be omnipotent.
This group also tends to misunderstand the limitations of predictive analytics. These are good tools in predicting future behavior and events, but they are not magical crystal balls that reveal a certain future. Predictive analytics predict the future assuming that current conditions and trends continue on the same path. That means that if anything occurs to disrupt that path or significantly change its course, the previous analysis from predictive analytics no longer applies. This is an important distinction that must be made clear to executives and data enthusiasts. Not only so that they use the information correctly but they also understand that their role in strategizing is not diminished or replaced by analytics, but greatly aided by it.
Further, most big data science teams are still working on rather basic projects and experi-ments, learning as they go. Most are simply unable to deliver complex projects yet. If executives have overly high initial expectations, they may be disappointed in these early stages. Disappointment can lead to executive disengagement and that bodes ill for data science teams and business heads. This can actually lead to scrapping big data projects and efforts all together. Therefore, it’s important to properly and realistically manage
executive expectations from the outset.
On the upside, executives in this group may be more open to suggestions on new ways to use data and be quicker to offer guidance on what information they most need to see. Such enthusiastic involvement and buy-in from executives is incredibly helpful to the initiative.
The
“
Data Is Just Another Spreadsheet
”
Group
At the other extreme end of the spectrum, the second group is likely to be unimpressed with big data beyond a mere nod to the idea that more data is good. This group views big data as a technical activity rather than as an essential business function.
what information they wish they could know and why. Then, if they answer, you have a solid and welcomed way to demonstrate the value of the company’s big data efforts by
presenting exactly what was needed but heretofore missing.
If they can’t or don’t answer the question, work proactively to find ways to demonstrate
the value of data analysis in ways that are meaningful to those executives.
Expect most executives to have little interest in how data iscooked—gathered, mixed, and
analyzed. Typically they want to know its value over the traditional ways of doing things instead.
Whether executives belong to one of these two extreme groups or are somewhere in between, it is imperative to demonstrate the value of big data analysis as you would in any business case and/or present ongoing metrics as you would for any other technology.
However, your work with executives doesn’t end there.
Big Data Positioned in Executive Speak
Although data visualizations have proven to be the fastest and most effective way to trans-fer data findings to the human brain, not everyone processes information in the same way. Common visualizations are the most readily understood by most people, but not always. Common visualizations include pie charts, bar graphs, line graphs, cumulative graphs, scatter plots, and other data representations used long before the advent of big data.
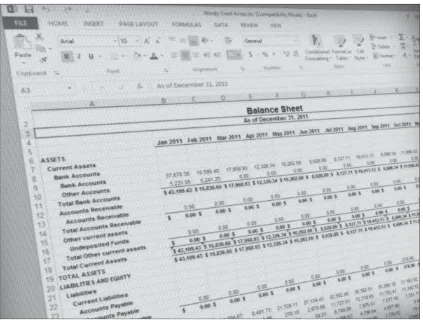
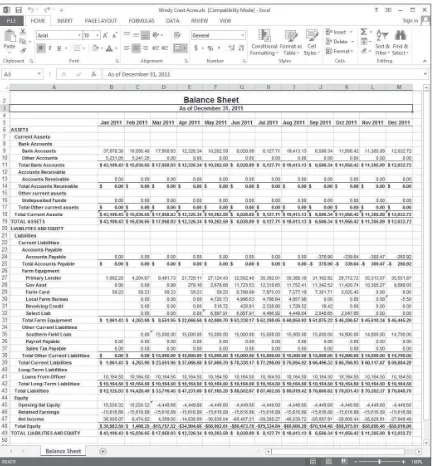
The most common of all is the traditional spreadsheet with little to no art elements. Figure 1.3 shows an example of a traditional spreadsheet.
Figure 1.3
An example of a traditional spreadsheet with little to no art elements.
Source: Pam Baker.
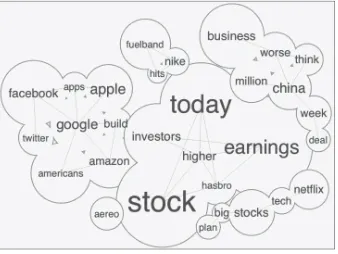
Figure 1.5 shows an example of a word cloud that quickly enables you to understand the prominence of ideas, thoughts, and occurrences as represented by word size. In this exam-ple, a word cloud was created on an iPad using the Infomous app to visualize news from several sites like FT,Forbes, Fortune, The Economist,The Street, and Yahoo! Finance. The size of the word denotes its degree of topic prominence in the news.
Figure 1.4
Augmented reality visualization. Imagine using your phone, tablet, or wearable device and seeing your multi-dimensional data in an easy to understand form such as in this VisualCue tile. In this example, a waste management company is understanding the frequency, usage, and utility of their dump stations.
Source: VisualCue™Technologies LLC. Used with permission.
Figure 1.5
A word cloud created on an iPad using the Infomous app to visualize news from several financial sites. The size of the word denotes its degree of topic prominence in the news.
Source: Infomous, Inc. Used with permission.
Both traditional and new visualizations range from the overly simplistic to the mind-bogglingly complex, with most falling somewhere in the middle. The function of any visu-alization is to convey meaningful information quickly. The effectiveness of such is not measured by its aesthetic value but by how well and quickly the information is received by the viewer.
“The best approach is to build visualizations in the most digestible form, fitted to how that
executive thinks,”John Lucker, principal at Deloitte Consulting, said in a phone interview. “You will have to interact with executives, show them different visualizations, and see how
they react in order to learn which forms work best for them. Be ready to fail often and learn fast, particularly with visualizations.”
In short, one man’s perfect visualization is often another’s modern art nightmare scenario.
information easily but also enable the user to consider the same information from differ-ent viewpoints and to drill down for more granular information.
In any case, it is imperative to figure out how each executive best learns, values and absorbs information and then tailor the visualizations accordingly.
As a result, it is a common mistake to develop a“one set of visualizations fits all”to share
with all executives. Given the inexpensive visualization tools available today and the ease in which they generate the same data results into a large variety of visualizations, there is simply no reason to standardize or bulk-produce visualizations.
Personalize visualizations instead. It’s not much more work and the effect on improved
communications with executives is invaluable.
“Whichever visualizations you decide to use, be consistent throughout your report,”
advises Lucker. “Consistency in forms makes it easier to understand and follow as the
viewer doesn’t have to stop and figure out each new visualization before they can grasp
the information within. Frequently changing visualization forms in your report creates user exhaustion.”
Figures 1.6 and 1.7 show more examples of new visualization types available today.
Figure 1.6 is in VisualCue’s“tile” format, whereby you can understand numerous
organi-zations at a glance, leveraging scorecard colors (red, yellow, and green) and intuitive pic-tures. In this case, you see one organization and the relevant financial market data. You make decisions with the full picture and then you can employ traditional views (graphs, charts, and so on) later once you know who or what you really want to study further.
Figure 1.7 is an example of how you can view your data on a map, but not just with one or two dimensions. Understand relationships as well as the overall picture of your organiza-tion. Such visualizations inspire you to ask questions you didn’t even think to ask! In this
example, a school franchise is understanding how their total operation is performing (main middle VisualCue tile) and then each corresponding student.
Figure 1.6
VisualCue’s“tile”format, where you can understand numerous organizations at a glance leveraging scorecard colors (red, yellow, green) and intuitive pictures. In this case, you see one organization and the relevant financial market data.
Figure 1.7
Another example of the wide range of new visualization types you can use to get people excited about your big data. In this example, a school franchise is understanding how their total operation is performing (main middle VisualCue tile) and then comparing each corresponding student.
Source: VisualCue™Technologies LLC. Used with permission.
However, even traditional spreadsheets are becoming more powerful and versatile in pro-viding data visualizations these days. Figure 1.8 shows a new way to use bar graphs in Microsoft Excel. There are several ways to use new data visualizations in Microsoft Excel now, particularly in the Enterprise version with Microsoft’s Power BI for Office 365.
Figure 1.8
An image of a new way to use bar graphs in Microsoft Excel.
Source: Microsoft Inc.
Focus on delivering the findings and skip the explanations on how you got to them unless the executive expresses interest in such.
Summary
In this chapter you learned that the term “big data” is imperfect. There is no widely
accepted consensus as to the minimum size a data collective must measure to qualify as
“big.”Instead, the technical world favors a definition more attuned to the data
character-istics and size relative to current computing capabilities. Therefore the focus today is pri-marily on how best to access and compute the data rather than how big it is. After all, the value is in the quality of the data analysis and not in its raw bulk. However, it is certain that extreme data is a near-term inevitability.
Fortunately, many new analytic tools can be used on data of nearly any size and on data collections of various levels of complexities and formats. Data size doesn’t much matter as
Executives, depending on their personal level of data literacy, tend to view big data as somewhat mysterious but useful to varying degrees. Two opposing perceptions anchor each endpoint of the executive viewpoint spectrum. One endpoint views big data as omnipotent, capable of solving any problem and accurately predicting the future, whereas the other end of the spectrum sees it simply as a spreadsheet upgrade. The latter group views big data as a technical activity rather than as an essential business function. There are lots of other executive perceptions between these two extremes, of course. But in any case, executive expectations must be managed if your big data projects are to succeed and continue.
Although data visualizations have proven to be the fastest and most effective way to trans-fer data findings to the human brain, not everyone processes information in the same way. It is imperative to figure out how each executive best learns, values, and absorbs informa-tion and then tailor the visualizainforma-tions accordingly. Focus on delivering the findings and skip the explanations on how you got them unless the executive expresses interest in such.
Chapter 2
How to Formulate a Winning
Big Data Strategy
Strategy is everything. Without it, data, big or otherwise, is essentially useless. A bad strat-egy is worse than useless because it can be highly damaging to the organization. A bad strategy can divert resources, waste time, and demoralize employees. This would seem to be self-evident but in practice, strategy development is not quite so straightforward. There are numerous reasons why a strategy is MIA from the beginning, falls apart mid-project, or is destroyed in a head-on collision with another conflicting business strategy. Fortu-nately, there are ways to prevent these problems when designing strategies that keep your projects and your company on course.
However, it’s important to understand the dynamics in play first so you know what needs
to be addressed in the strategy, beyond a technical“To Do” list.
The Head Eats the Tail
The question of what to do with data tends to turn back on itself. Typically IT waits for the CEO or other C-level executives and business heads to tell them what needs to be done while the CEO waits for his minions, in IT and other departments, to produce cun-ning information he can use to make or tweak his vision. Meanwhile department heads and their underlings find their reports delayed in various IT and system queues, or their selections limited to a narrow list of self-service reports, quietly and fervently wishing someone at the top would get a clue about what needs to be done at their level. In other words, everyone is waiting on everyone else to make the first move and all are frustrated.
The default is business gets done in the usual way, meaning everyone is dutifully trudging along doing the exact same things in the exact same ways. And that is why so much data sits fallow in data warehouses. No one is using it. No one is entirely sure what data is there. Few can imagine what to do with it beyond what is already being done at the moment.
The typical CEO continues to depend on data fed to the same fields he’s accustomed to
looking at on his trusty and familiar spreadsheet (see Figure 2.1). IT continues the daily struggle of trying to store and integrate data, learning and deploying new big data tools plus other technology and online initiatives, and managing a growing number of service and support tickets. Department heads consult the same reports they always have, often populated with too little data and which commonly arrive too long after the fact to accu-rately reflect current conditions. Staffers scratch their heads in confusion over the fruit-lessness or inefficiency of the entire process.
It’s not that anyone in this scenario is deliberately thinking that improving things is not
their job; rather they are usually unsure what needs to change or how to go about making these changes. They are also not thinking about how these changes would affect others in the organization or the organization at large; rather they are focused on how their desired changes will affect their own domain within the business.
People are simply unaccustomed to thinking in terms of using big data to decide the way forward and to predict business impact. Some are even afraid of using big data, should it become a driver to such an extent that it results in a loss of power or worse, a loss of job security.
But for the most part, it simply hasn’t occurred to many people that data analysis can
address and even resolve most of their problems. That’s why few think to turn to it first.
Figure 2.1
A common, traditional spreadsheet used by executives.
Source: Pam Baker.
In other words, the head eats the tail and everyone in the organization is trapped in this circular reasoning. But as you shall see in a moment, the way to end this circle is not with a linear strategy but with a non-linear one and yes, sometimes even with another circle, albeit one of a far different nature.
How to End the
“
Who
’
s on First
”
Conundrum
That is not to say that using data is a foreign experience to everyone. Virtually all people already use data to some extent in their daily work. What is different now, however, isnot
that there is more data, that is, big data, but that there are more ways to use that data than most people are accustomed to.
Unfortunately, the difference gets muddied in conversations about big data, leading to muddied efforts as well.
Changing Perspectives of Big Data
When we focus on the word“big,” our minds most often translate that to mean“more of
the same.”For example, a big person is just one person no matter how big or tall, and not
a big collection of several different people. Big means more and not a diverse and growing collection of connections in the minds of most people. As a consequence, when most peo-ple hear the term“big data,” they tend to think of more of the same data.
That mental translation of the term happens commonly in everyday conversations about big data. Perhaps you will hear someone say something like, “big data is so big we have
trouble storing and retrieving it” or“big data is too big for normal computing methods.”
It’s not that these statements are untrue, for they are indeed often correct. It is that the
average human mind conjures the image of more of the same data clogging the system, and not diverse and disparate data sets tumbling in from every direction.
How humans professionally and personally relate to the word “data” also adds weighty
perceptions to the mental baggage carried into big data conversations, bringing to mind the old fable of the Blind Men and The Elephant, where each man, based on their limited perception, concluded that an elephant was far different from what it actually is when all the parts are recognized and assembled properly. Big data allows us to see the elephant; not merely a trunk, leg, or tail in isolation.
User Perception Versus the Data-Harvesting Reality
For example, a Facebook user will typically think in terms of what they personally post when they hear Facebook is gathering data on them. Most people have trouble immedi-ately comprehending that Facebook can track far more than merely what they have posted. Is this ignorance of how data is collected? Yes, in many cases it is. But even when such ignorance is not present, the average person will immediately first think of what they shared or used intentionally on Facebook and not necessarily what they did on their computer overall while Facebook was accessed or their smartphone’s Facebook
app was running in the background. Why? Because their personal experience on Facebook is their reference point.
The reality of Facebook’s work in data harvesting far exceeds that of simply recording
and analyzing posts users put on their Facebook wall. Here is just one example of how Facebook gathers data on both non-users and users, tracking them across websites, none of which are Facebook owned, as reported in a November 16, 2011 article inUSA Today:
Facebook officials are now acknowledging that the social media giant has been able to create a running log of the web pages that each of its 800 million or so members has visited during the previous 90 days. Facebook also keeps close track of where millions more non-members of the social network go on the Web, after they visit a Facebook web page for any reason.
To do this, the company relies on tracking cookie technologies similar to the controversial systems used by Google, Adobe, Microsoft, Yahoo!, and others in the online advertising industry, says Arturo Bejar, Face-book’s engineering director.
Of course the information Facebook gathers from actual user activity on their website is staggering too. Bernard Marr explains some of it in his February 18, 2014 SmartDataCol-lective post this way:
We as the users of Facebook happily feed their big data beast. We send 10 billion Facebook messages per day, click the Like button 4.5 billion times and upload 350 million new pictures each and every day. Overall, there are 17 billion location-tagged posts and a staggering 250 billion photos on Facebook.
All this information means, Facebook knows what we look like, who our friends are, what our views are on most things, when our birthday is, whether we are in a relationship or not, the location we are at, what we like and dislike, and much more. This is an awful lot of information (and power) in the hands of one com-mercial company.
Facebook has also invested in image processing and “face recognition” capabilities
that basically allow Facebook to track you, because it knows what you and your friends look like from the photos you have shared. It can now search the Internet and all other Facebook profiles to find pictures of you and your friends.
Face recognition allows Facebook to make “tag suggestions” for people on photos you
have uploaded but it is mind boggling what else they could do with technology like that. Just imagine how Facebook could use computer algorithms to track your body shape. They could analyze your latest beach shots you have shared and compare them with older ones to detect that you have put on some weight. It could then sell this information to a slimming club in your area, which could place an ad on your Facebook page. Scary?
There is more: a recent study shows that it is possible to accurately predict a range of highly sensitive personal attributes simply by analyzing the “Likes” you have clicked on
Facebook. The work conducted by researchers at Cambridge University and Microsoft Research shows how the patterns of Facebook “Likes” can very accurately predict your
sexual orientation, satisfaction with life, intelligence, emotional stability, religion, alcohol use and drug use, relationship status, age, gender, race and political views among many others. Interestingly, those“revealing”likes can have little or nothing to do with the actual
attributes they help to predict and often a single“Like”is enough to generate an accurate
prediction.”
The Reality of Facebook
’
s Predictive Analytics
As if this data wasn’t enough intimate information about users, Facebook also studies a
user’s posting patterns and moods to predict a future romantic relationship. I reported
on this activity in a February 19, 2014 FierceBigData post:
“During the 100 days before the relationship starts, we observe a slow but steady increase in the number of
timeline posts shared between the future couple,”writes Facebook data scientist Carlos Diuk in his“The
For-mation of Love”post. “When the relationship starts (day 0), posts begin to decrease. We observe a peak of
1.67 posts per day 12 days before the relationship begins, and a lowest point of 1.53 posts per day 85 days into the relationship. Presumably, couples decide to spend more time together, courtship is off and online interactions give way to more interactions in the physical world.”
In other words, Facebook knows when you are about to become a couple, perhaps before you know, and certainly long before you announce your new couplehood on your own Facebook posts. Further, Facebook determines that the physical part of your relationship begins when your online activity decreases. Facebook tactfully calls this phase“courtship”
in the posts but we all know that courtship actually occurred during the exchanges Facebook initially tracked to predict the coupling.
Further, Facebook uses posting patterns and moods to detect a romantic breakup before it happens. In a February 15, 2014 post on Facebook titled“When Love Goes Awry,”Adrien
Friggeri, Facebook data scientist, said:
To conclude this week of celebrating love and looking at how couples blossom on Facebook, we felt it was important not to forget that unfortunately sometimes relationships go south and people take different paths in life. In this context, we were interested in understanding the extent to which Facebook provides a platform for support from loved ones after a breakup.
To that end, we studied a group of people who were on the receiving end of a separation, i.e. who had been in a relationship for at least four weeks with someone who then switched their relationship status to Single.
For every person in this group, we tracked a combination of the number of messages they sent and received, the number of posts from others on their timeline and the number of comments from others on their own content, during a period starting a month before the separation to a month after.
We observed a steady regime around the baseline before the day the relationship status changes, followed by a discontinuity on that day with a +225% increase of the average volume of interactions which then gradu-ally stabilize over the course of a week to levels higher to those observed pre-breakup.
This means that Facebook now has the means to accurately predict romantic breakups, often long before the poor, dumped soul may suspect anything is wrong. Rest assured that Facebook is likely using similar analysis to predict other intimate details about its users beyond mere romantic relationships.
’
s Data Harvesting Goes Even Further
Facebook officials say they are even going further in data collection but they will do so in an increasingly secretive mode. On April 18, 2014, Dan Gillmor reported in his post in
The Guardian:
Facebook may be getting the message that people don’t trust it, which shouldn’t be surprising given the
com-pany’s long record of bending its rules to give users less privacy. CEO Mark Zuckerberg told The New York
Times’Farhad Manjoo that many upcoming products and services wouldn’t even use the name Facebook,
as the company pushes further and further into its users’lives. The report concluded:
If the new plan succeeds, then, one day large swaths of Facebook may not look like Facebook—and may not
even bear the name Facebook. It will be everywhere, but you may not know it.
If Facebook does indeed proceed down that route, users will be even less likely to be able to correctly identify what data the social media giant is collecting about them and how it is being used. Meanwhile Facebook’s big data projects, whatever they may be, will become
increasingly accurate, thus enabling the firm to substantially increase revenues and accel-erate innovation.
Using Facebook to Open Minds on the Possibilities and
Potential of Big Data
Because the average Facebook user has no direct knowledge or experience with Facebook’s
data collection activities and data usage practices, they often fail to see the harm such can cause. Instead, the average user tends to perceive Facebook’s use of data as relatively
harmless and little more than an annoyance. They mistakenly believe that as long as they don’t post anything on their wall of a personal or detailed nature that no harm can
come of it.
Facebook is not the only corporate giant engaging in wide scale data harvesting. These days almost all corporations do so to some degree. Some of these efforts are benign and others not so much. Worse still, none of us know how this data will be used in the future nor to whom it is being sold and for what purpose it is being bought.
While the average person is fully attuned to the potential danger in the government collecting large amounts of data on them, they are blinded to the dangers in the private sector doing so.
It is this limited perception based on personal experience alone that can cloud discussions of the potential in big data within an organization. While many business heads are per-sonally using Facebook and other social media, they may not be aware of how Facebook uses their and other users’data and thus have difficulty imagining how their own
organi-zation could do so. Therefore, Facebook serves both as an excellent example of what is possible with big data from the business side, and as a warning of the dangers to privacy on the individual side. In any case, Facebook is an excellent case study to use in broaden-ing the thinkbroaden-ing of business leaders in your organization.
Professional Perceptions Versus Data Realities
universally cheer the concept of gathering and using more data. Unfortunately many of them are unsure what to do with that data once it is gathered.
Further, professionals in all disciplines tend to think of data only as it pertains to their specific job or current tasks.
Members of the C-suite will typically act similarly. They tend to think in terms of the data they use now and rarely what other types of data and analysis they might use, at least not in any specific detail. Even CIOs, presumably skilled in taking the broader data picture, may think in terms of the specific data and related reports they regularly deliver to depart-ments and to the CEO, and not necessarily about the data in storage that no one has accessed or requested in ages.
Because data analysis is performed piecemeal in this way, analysis becomes fragmented and siloed, even if the data itself isn’t, and the organization overall typically fails to realize
full benefit. It isn’t that data democratization is a problem, for such is actually a strong
advantage in nearly every case. The problem is that no one in the typical organization is asking the larger questions, those that exist outside their normal tasks, beyond their job scope or perhaps entirely outside of it. Innovation comes from looking at things differ-ently rather than using new tools to perform the same tasks for the same reasons and in the same way. For innovation and extraordinary competitive advantage to be realized, this mold must be either augmented or broken.
From Perception to Cognitive Bias
Relying on your personal or professional reference point is a totally human thing to do. It is a useful way to organize your thoughts and actions most of the time. However, it is a clear example of“cognitive biases,”a term which coincidentally grew out of studies
exam-ining humans’ innate inability to correctly recognize and rationally factor decisions in
situations involving huge numbers or statistical probabilities counter from commonly expected results. This leads to actions counter-productive to innovation in general and to data use in particular.
In other words, in order to consider information from a perspective not related to one’s
own cognitive biases or reference points, most people need to see a clear example or for someone to show them what can be done before they can begin to imagine what else can be done with data.
Finding the Big Data Diviners
This is why it’s important for someone or some team to take the lead on exploring new
data uses rather than merely hope such will spontaneously and organically appear within the organization. It is also important to understand these dynamics to better communi-cate the details and worthiness of big data projects and thereby increase executive buy-in, user adoption, overall collaboration, and widespread innovation.
Fortunately there are a few people in every organization who possess sufficient intellectual curiosity, analytical and critical thinking skills, and a fearlessness of change who can power true innovation via data use. The big surprise is that they are generally peppered throughout the organization and almost never conveniently grouped entirely in IT or as business analysts. Occasionally one of those people happens to hold a seat in the C-suite or at the boardroom table, but that is relatively rare given their great distance from the troops on the ground and the sanctum of the datacenter and data warehouse.
Characteristics of a Big Data Diviner
Remember your data diviners will be peppered throughout your organization and often where you least expect them to be. Look for these characteristics to help you find them:
n Insatiable curiosity. A tendency to explore information even when not directly required to do so.
n A love for knowledge. These individuals are constantly learning on their own and on the job. But they may not be enrolled in training classes or formalized education. Whether they are enrolled in a class or not, they are absorbing new information around them constantly and they do so naturally and eagerly.
n Easily make connections between seemingly disparate information. It has been said that the nature of genius is to“connect the dots”between sets of information. You’re looking for this kind of genius. Like big data tools, data diviners naturally and easily see connections between information points that others either don’t recognize at all or are far slower in recognizing. n Intuitive intelligence. This relates to the ability to make connections between disparate
infor-mation but goes beyond that to include the ability to put such newly“connected information” to work. In other words, they don’t just see the connections and divine a new thought from them, but also can intuitively sense an appropriate action based on that information. n Ease with change and new technologies. Because this group loves to learn, they’re quick to
n Good critical thinking skills. They are highly logical in their approach to work and life. These people are natural thinkers and logical, effective planners.
n Easily understand patterns. Whether they purposefully do so or not, data diviners naturally see patterns everywhere: in how people act and think, the flow of work, the nature of office politics, the information in any chart they see, and pretty much in everything they observe. n Science lovers. This group tends to be interested in science to some degree because of the logic
and patterns they find there and because of their love for learning. They may not be in science professions, but they have an affinity for science all the same.
n Typically good at math. Typically this group has strong math skills, or least they have stronger math skills than the average person. But not always. Some may be truly awful at statistics and higher maths but possess such high pattern recognition and critical thinking skills that they can divine data easily with the help of software that does the math for them.
n Natural problem solvers. These are the“fixers”in your ranks. When data diviners see a problem they’re usually the first to suggest a solution or even to just fix it outright. n Easily bored with repetitive work. They may be doing repetitive work, after all jobs are still
relatively hard to come by so they may have taken whatever job they could find, but they’re not happy there. This group much prefers mental exercise to accompany their work.
n Purpose driven. This group is not at all interested in busy work. They want to know the purpose behind their work and they want to work purposely. It is this innate search for purpose that enables them to find faster and better ways to accomplish the same thing. They don’t work harder; they work smarter.
n Values production over time clocking. These are clock haters. They don’t want their work time tracked because they tend to find such activity annoying and useless. Instead they value actual production. In other words, it doesn’t matter to this group if a task takes five minutes or five weeks, what matters is producing a worthy result. They want to be judged by results and not by how much time they took or didn’t take in getting them. But don’t worry, they tend to be hard workers who will stay at the task for whatever time is necessary to complete it. But if they accomplish it early, don’t expect them to fill the rest of the time on the clock doing busy work. They’ll want another challenging task to do. They are highly focused on efficient production and this is what makes them exceptionally good at innovating.
n Highly focused. This group is not easily distracted from a task. They tend to be highly focused and detailed in their work. While any human can make a mistake, this group makes far fewer than others, simply because they are so conscious of detail.
n Often teach peers. Because this group learns well and easily, they are the first among their peers to learn and master new things. Usually they are also quick to teach their peers or at least answer their questions. Usually a data diviner is the person others in their work group turn to for help in understanding a task or process.
These people, the data diviners, whomever they are and wherever they are, need to be identified and their skills put into play, not necessarily on the data science teams, although they are very helpful there too, but in any position where they can have a direct impact on how data is used in the organization. At the very least, they should be encouraged to share their thoughts and to show their peers the very real gains to be had in data analysis beyond the norm.
It’s only when people with these tendencies are actively seeking new ways to use data that
the company will see the full promise of big data come to fruition.
Until such people can be identified and their skills leveraged, the beginning big data play almost always rests on IT and/or the data science teams. Certainly the average team can work on the low-hanging fruit in data analysis if only by enhancing existing reports and processes. But for there to be any ground-breaking realizations of big data benefits and any truly imaginative innovations, those teams need members who are cross-disciplined and extremely knowledgeable of the business.
In other words, you need people on your data science teams who can bridge the gaps between disciplines and find the intersections. This is where creative thinking in terms of honing the company’s competitive edge begins and thus where innovative ideas are found.
However, it is a mistake to limit your data efforts to only data science teams. Granted, they are the foundation on which the company can pivot to a better position but they are not, nor should they ever be, the company’s only innovative engine. Start here but
move quickly to recruit talented data diviners to the ongoing effort.
Start at a single point, such as with your data science team, but move quickly and steadily toward a large and fluid collaboration throughout the organization.
Next Step: Embracing Ignorance
Further, if you are aware of and acknowledge the ignorance, you can more easily identify what needs to be known. Use ignorance; consider it your friendly conspirator in big data explorations. It is when you are sure of the answer beforehand that you are more likely to fail because it then becomes more likely that you’ll inadvertently introduce confirmation
biases, manipulate the outcome, or overlook additional data.
Build your project strategy as tightly as you can in order to keep it on course but also allow some“ignorance flexibility”to enable the capture and leverage of knowledge
hereto-fore unknown that you may find along the way.
Where to Start
You should develop an overall big data strategy as well as more pointed project-specific strategies. The overall data strategy should be focused on continuously discovering ways to improve the business through refinement, innovation, and solid returns, both in the short and long terms. Project-specific strategies should lead to a specific measurable and actionable end for that effort. This should be immediately followed with ideas about what can be done from there, which in turn should ultimately lead to satisfying the goals in the overall big data strategy and reshaping it as necessary too.
Figure 2.2 illustrates how big data projects form from your overall big data strategy, but each project also has its own strategy. As these projects come to fruition, your company grows and changes to become more competitive and profitable. When this happens, new ideas and needs form which then should return to shape, inform or instruct your overall big data strategy and to dictate new big data projects.
Figure 2.2
Big data projects form from your overall big data strategy, but each project also has its own strategy.
Begin at the End
The key to developing a winning big data strategy is to focus on actionable insights rather than on simply delivering information. This in not to say that knowledge isn’t useful in its
own right but merely an acknowledgment that even the best fishing expeditions are not satisfying unless you also bring home a basketful of fish at the end of the day. In other words, you must produce actionable insights for there to be measurable gain, that is, an appreciable return on investment (ROI). However, it is smart to also “fish” for new
knowledge that may not result in an immediate payload, as that new knowledge will often point you to opportunities and avoidable pitfalls that you may not have otherwise discovered.
For projects designed to deliver actionable insights, you begin at the end by identifying what you need to know, and that which you can actually act upon, in order to solve a specific business problem or to reach a specific goal. From there you work backward to formulate the questions you need to ask of data in order to arrive at the needed insights.
If your defined goal is too broad, such as“increase sales,”then you can’t easily determine
what information you’ll need to look for within your data, nor will you be able to pinpoint
a specific action to bring about the desired outcome. By contrast, if your defined goal is more specific, such as“to increase purchases of Product X by 10% in the‘best customers’
group” then you will know what you need to look for inside your internal and externally
imported data in order to develop a winning strategy.
For example, some of the things you would likely need to know in the “to increase
pur-chases of Product X by 10% in your‘best customers’group”scenario are the following:
n A list of your top customers in general
n A list of your top customers who bought Product X in the past
n A list of your top customers who bought products similar to Product X in the past
n A list of top customers who have not purchased Product X but have bought similar or related products
n A determination of common characteristics and triggers among top buyers of
product X and similar products that you can then use to identify other top customers in general who share the same characteristics and high response rate to the same triggers
n An understanding of how Product X compares with competing products on the market and with current trends overall; determine how that information affects
“salability” of Product X
n An understanding of which price points moved Product X best in the past; which moved products similar to Product X best in the past
n Knowledge of which price points moved Product X well in the past and also delivered the best margin
n An understanding of which price points slowed Product X sales; find out whether those price points were the sole problem or whether there were other circumstances present that also affected Product X sales in the same time period
n A determination of what seasons, weather, and other external factors affected an uptick or downturn in Product X sales
n Insight into which sales people and stores are currently moving the most Product X and what they have in common (pricing, ad campaigns, in-store merchandising or window displays, weather conditions, sales contests, and so on)
n Metrics on what website positioning has moved the most Product X in the past
n Comparatives of all A/B and multivariate testing regarding or impacting Product X sales online
n A performance comparative of past ad and marketing campaigns aimed at moving Product X
n A study of loyalty programs that affected past sales of Product X and similar products to evaluate how well such worked in the past and to determine if a new loyalty tie-in is needed to move more of Product X now
n Analysis of what your competitors are doing to move Product X and similar products (pricing, ad/marketing campaigns, merchandising displays online and off, and so on)
Using analytics to explore new ideas and discover and address issues and opportunities is done much the same way. Start with a “what if” or “why is this so” or “could this be”
question and work your way back to identify what questions you need to ask of data. Even if the answer is not actionable in some of these cases, the knowledge gleaned will likely be useful in other actionable situations.
concise view that will then reveal an action. Evaluate the action in terms of logistics and cost as well as in terms of public relations, customer relations, and regulatory compliance. Take action accordingly.
When Action Turns into Inaction
Ideally your company will be willing, able, and prepared to take action as soon as you have the insights necessary to do so. Unfortunately this is sometimes not the case.
Industry analyst Joshua Greenbaum, who is also an IEEE Computer Society member and principal at Enterprise Applications Consulting, said in an interview following his presen-tation at the 2013 Rock Stars of Big Data event that the“number of companies that walk
away from taking action after they have the insights from big data is unbelievable.”
He cited as one example a manufacturer that used big data to discover counterfeiters who were stealing millions of dollars from the company by producing look-alike products complete in every detail, including packaging and the company logo. After the counterfei-ters were busted via big data analysis, one would think the company would immediately act to protect future revenues. But that’s not what happened, says Greenbaum. “They
shrugged and walked away because they had no budget with which to act.”
If you would like to hear Greenbaum’s full presentation, you can find it on YouTube. The
video is titled “Joshua Greenbaum: Imagineering Big Data—How to Bring Rock Star
Analysis to Your Company.” But rest assured that many industry observers have noted
the all-too-common phenomenon of companies walking away from the answers found in data analysis.
This begs the question of why companies bother going to the expense and effort of ana-lyzing big or small data if they have no plans to then act upon the findings? This is a fre-quent occurrence across industries. Why? Frefre-quently, companies find they don’t have the
resources or the leadership commitment to follow through. Other times, says Greenbaum,
“the company culture gets in the way.”
In other words, if the analysis is counterintuitive to decision makers, if the action indi-cated is costly or threatens to disrupt other activities already budgeted and prioritized, and/or if the implementers perceive the action to be threatening to their job security or department, the recommended action is not taken and the big data project fails to produce a return on investment (ROI). This then, not surprisingly, tends to lead to a huge drop in morale among data science team members and users who were eagerly looking forward to having a solution.
Therefore it is prudent to consider at the beginning of strategy development both the availability of the means to take action on the results and the likelihood that action will be taken. There simply is no point in searching for a solution to a problem that the powers-that-be don’t want solved or can’t afford to act upon.
However, quite frequently you will not know in advance how the end results will be received or whether they will be acted on. Many big data efforts will thus be a bit of a gamble. To offset this risk, mix data projects so that you are running some you know will be seen to fruition with some you are unsure will ever see the light of day. In this way, you can steadily show a return on investment while also pushing forward into new territory.
Otherwise, consider big data analysis largely a “what if” game on a huge scale. However,
time can be lost and efforts scattered if you simply begin by exploring all the “what ifs”
you and your team can think up.
Identifying Targets and Aiming Your Sights
It is smarter to begin by looking at the reports and processes the company already uses. In regard to reports, begin by noting the questions posed and the report requests made to IT and reporting systems. Also look at what reports are generated and what information they contain. Then ask the data science team to discern from this information what spe-cific insights are being sought and why, and then figure out how those insights can be delivered more effectively and efficiently through big data analysis.
In regard to processes, follow a similar line of inquiry. Why does the process exist, that is, what ultimately is it designed to achieve? Look for inefficiencies in those processes that can be eliminated by a smarter use of data analytics. Sometimes you’ll even discover that
a process is no longer needed and should be replaced or eliminated outright.
This is where the“what if”game begins. This is where the team asks“what if we did it this
way?” or “what other analysis can we add to help?” until an optimum answer is found.
From there, mapping out a data project right down to the user interface and dashboard is relatively straightforward.
It’s when you get past this low hanging fruit that the what-if game gets truly challenging.
At that point you’ll need creative, analytical thinkers who are unusually knowledgeable