Controlling the Charge State of a Single Redox Molecular Switch
Thomas Leoni,1Olivier Guillermet,1,2Hermann Walch,1Ve´ronique Langlais,1Andrew Scheuermann,1,3 Jacques Bonvoisin,1and Se´bastien Gauthier1,*
1CNRS, CEMES (Centre d’Elaboration des Mate´riaux et d’Etudes Structurales), B.P. 94347, 29 rue Jeanne Marvig,
F-31055 Toulouse, France
2Universite´ de Toulouse, UPS, 118 route de Narbonne, 31062 Toulouse, France 3Department of Chemistry, University of Florida, Gainesville, Florida 32611, USA
(Received 4 March 2011; published 27 May 2011)
Scanning tunneling microscopy and dynamic force microscopy in the noncontact mode are used in combination to investigate the reversible switching between two stable states of a copper complex adsorbed on a NaCl bilayer grown on Cu(111). The molecular conformation in these two states is deduced from scanning tunneling microscopy imaging, while their charge is characterized by the direct measure-ment of the tip-molecule electrostatic force. These measuremeasure-ments demonstrate that the molecular bistability is achieved through a charge-induced rearrangement of the coordination sphere of the metal complex, qualifying this system as a new electromechanical single-molecular switch.
DOI:10.1103/PhysRevLett.106.216103 PACS numbers: 68.37.Ef, 68.37.Ps, 82.37.Gk
A molecular switch is a molecule that can be reversibly shifted between two states by an external stimulus [1]. Potential applications of these molecules in the field of nanotechnology are numerous, from memory units [2] to electronic switches [3] and driving elements for molecular motors [4]. Recently, a wide variety of molecular switches have been characterized by different techniques, in par-ticular, by scanning tunneling microscopy (STM) [5–14]. Most of these studies were performed on metal surfaces. Here, we introduce a new molecular switch, a redox mole-cule adsorbed on an ultrathin insulating film deposited on a metal. By a combination of STM and noncontact atomic force microscopy (nc-AFM) measurements, we unambig-uously demonstrate that the as-deposited neutral and square-planar molecule becomes negatively charged and tetrahedral after switching. Our findings on this interplay between conformational change and charge state, although well documented in the chemistry of transition metal com-plexes, enables us to study fundamental phenomena at the single molecule level, such as electron transfer between two redox centers, or to develop new charge manipulation schemes, such as triggering mechanical motion in a mole-cule by electron injection.
A commercial low temperature (5 K) microscope (Omicron Nanotechnology, Taunusstein, Germany) equipped with a tuning fork of the qPlus sensor type [15] and a control system from SPECS (Zurich, Switzerland) was used for this study. All the data shown were obtained at 5 K. The Cu(111) substrate was cleaned by cycles of Arþ sputtering (600 eV) followed by annealing at
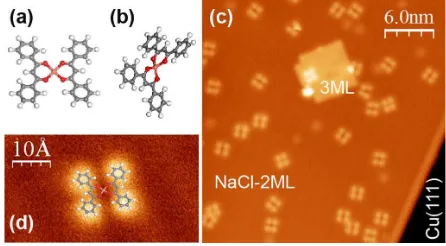
750 K. NaCl was deposited by thermal evaporation on this substrate at 300 K in order to get a partial coverage of NaCl bilayer islands. The coordination complex bis-dibenzoylmethanato-copper [CuðdbmÞ2: Fig. 1(a)] was prepared as previously described [16] and characterized
by electrochemistry and x-ray diffraction. These molecules were deposited from a heated crucible on the sample maintained at low temperature in the microscope. The resonance frequency of the tuning forks used for this study was of the order of 25 kHz and their quality factor in the range 10 000–20 000. They were equipped with a glued electrochemically etched tungsten tip.
The STM image of oneCuðdbmÞ2molecule adsorbed on a NaCl bilayer on Cu(111) presents four bright lobes arranged in an almost square configuration [Figs. 1(c) and 1(d)]. A closer examination shows that one of the grooves separating these lobes is more pronounced than the other, suggesting that the ligands are positioned along the connected lobes [Fig. 1(d)]. The apparent molecular height is approximately 100 pm.
Figure 2 shows the reversible switching of two mole-cules controlled by suitable bias voltage. Applying þ2 V
FIG. 1 (color online). Bis-dibenzoylmethanato-copper C30H22O4Cu (a) square-planar complex ½CuðIIÞðdbmÞ20 and (b) tetrahedral complex ½CuðIÞðdbmÞ21. STM images of CuðdbmÞ2 on a bilayer of NaCl on Cu(111). (c) Tunneling current It¼1 pA; bias voltage Vt¼1 V. (d) It¼0:7 pA;
Vt¼1:2 V.
PRL106,216103 (2011) P H Y S I C A L R E V I E W L E T T E R S 27 MAY 2011week ending
(referring to the sample) above the center of a square molecule changed the geometry from flat planar to 3D [Fig.2(a)to 2(b)and Fig.2(b)to 2(c)] with an increased height of more than 200 pm [Fig.2(f )]. Applying 2 V above this molecule restored the initial square conforma-tion [Fig.2(c)to2(d)and Fig.2(d)to2(e)], demonstrating the complete reversibility of the process. The switching events were detected during the application of the voltage by monitoring the occurrence of sharp transitions in the tunneling current. In the experimental conditions corre-sponding to Fig.2, the waiting time before switching was a few hundred milliseconds. The process is highly reliable, with a rate of success approaching 100%. Spontaneous switching was not detected in a time range of several hours, demonstrating the stability of the two species. In addition, it was not possible to induce similar transitions on mole-cules directly adsorbed on Cu(111). This observation shows that NaCl plays an important role in the switching mechanism, either by its specific adsorption properties or by its electronic decoupling effect for the adsorbed mole-cules relative to the metallic substrate.
These conformational changes are not unexpected: It is well established that the redox state of the metallic ion in a complex is coupled to its coordination geometry [17]. In its neutral form, CuðdbmÞ2 is square-planar [Fig. 1(a)], as shown by x-ray diffraction [16]. This geometry is typical of Cu(II) coordinated with two singly charged anionic ligands. Cyclic voltammetry experiments on similar com-pounds show partial irreversibility due to the rearrange-ment from this planar to a tetrahedral coordination [Fig. 1(b)] during the reduction process [18,19]. These observations can be rationalized by using crystal-field theory [20]: In the Cu(II) complex, the electronic configu-ration of the metal isd9, and the structure is stabilized by the Jahn-Teller effect. In the negatively charged Cu(I) complex, the metal is d10, and, therefore, there is no crystal-field stabilization energy preference for any coor-dination symmetry. The structure is then governed by steric and electrostatic effects, and a tetrahedral geometry is adopted (Ref. [20], p. 212). Note that similar coordination geometry changes in Cu complexes have been used to
control molecular motors in solution [4]. In light of these observations, we interpret the switching behavior as tran-sitions between a square-planar (SP) [Fig.1(a)] and a 3D tetrahedral (Td) geometry [Fig.1(b)].
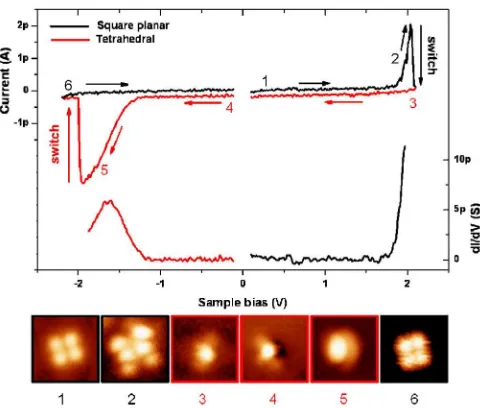
Tunneling spectroscopy experiments were performed in order to obtain insight into the electronic structure of the adsorbed molecule in its two states (Fig. 3). ThedI=dV
spectrum of a SP molecule presents a sharp increase that starts at V’1:8 V and is interrupted, in this particular case, by the switching to the Td state at V’2 V. Imaging the SP molecule in this voltage range was difficult because it tends to switch to the Td state. Nevertheless, it was possible to obtain a complete image at V ¼1:85 V (image no. 2 in Fig. 3), which is markedly different from the square one: It exhibits 6 lobes, its lateral dimensions are larger, and its height increases to more than 300 pm. In a similar way, thedI=dVspectrum of a Td species exhibits a conductance peak atV’ 1:7 V, and the image becomes much higher as well (’500 pm) beyond this voltage. Following recent works [21,22], we attribute these features to molecular ion resonances, which dominate the spectrum at these bias voltages because the NaCl bilayer partially decouples the molecule electronically from the metallic substrate. Considering the open shell d9 electronic con-figuration of Cu(II) in the SP complex, the resonance observed at positive bias is expected to derive from its singly occupied molecular orbital, while the resonance associated with the Td complex corresponds to its first occupied level. The position of these conductance peaks is in good correspondence with the bias voltages applied to induce the transitions between the two conformations of
FIG. 2 (color online). (a)–(e) Sequence of STM images show-ing the reversible switchshow-ing of two molecules. The position of the tip above the molecule during the application of the bias voltage is marked by a black circle. (f ) 3D representation of image (b). Image size: 6:9 nm5:5 nm. It¼0:4 pA;
Vt¼100 mV.
FIG. 3 (color online). IðVÞ and dI=dV spectroscopy curves obtained on the SP (black lines) and the Td (red line) species. The numbers that appear on theI-Vcurves refer to the number-ing of the STM images shown below the graph (size:3:5 nm
3:5 nm). They are located at the corresponding imaging bias voltage. 1, 2, and 6 (3, 4, and 5) correspond to the SP (Td) species.
PRL106,216103 (2011) P H Y S I C A L R E V I E W L E T T E R S 27 MAY 2011week ending
the molecule. Therefore, the transformation from SP to Td is triggered by the injection of an electron in the singly occupied molecular orbital of SP and the reverse one by the retrieval of an electron from the highest occupied molecu-lar orbital of Td. This observation suggests that the SP adsorbate is neutral, while the Td one is negatively charged. The sequence shown in Figs. 2(b)–2(d) and in Fig.3could then be considered as an oxido-reduction cycle performed on a single redox center.
This conclusion is strengthened by the observation re-ported in Fig.4, where the difference between the images after [Fig.4(b)] and before [Fig.4(a)] switching has been calculated [Fig. 4(c)], following a recently proposed method [14]. The rings that appear surrounding the SP molecule can be attributed to the scattering by the long range electrostatic potential of the localized charge of the two-dimensional electron gas that is confined at the Cu-NaCl interface [9,14]. But the effect is very weak, and, in addition, it does not allow the determination of the sign of the charge.
A more direct method consists in characterizing the electrostatic force exerted by the molecule on the tip by nc-AFM, following the method developed in Refs. [12,23,24]. Electrostatic forces can be distinguished from the other forces involved in AFM by their quadratic dependence on the bias voltage. In nc-AFM [25], the constant-height measurement of the resonance frequency shiftfas a function of the bias voltage gives a parabola with its maximum atV ¼V. This bias voltage minimizes
the electrostatic force [26] and is used to build maps of the local contact potential difference [ðelectron chargeÞ V]
in Kelvin probe force microscopy [27].
Here we use the fðVÞ spectra to characterize the charge state of the adsorbed species, as shown in Fig. 5(a). The measurements were performed in the fol-lowing way: The tip was positioned in the constant-current mode (with the tuning fork oscillating) above the object of interest. The distance-controlled loop was then disabled, the distance changed byz, and the bias voltage ramped over the predetermined range. The z scale has been cor-rected by the height of the molecules measured on the constant-current STM image in order to plot the curves on a common scale relative to the substrate.
The curves can be fitted very precisely with parabolas (red lines), the maxima ðV;fÞ of which were
deter-mined for a complete set of measurements at different tip heights, z. The resulting VðzÞ curves, displayed in
Fig.5(b), reveal a different behavior for the two molecular states.V
SPdoes not deviate significantly from the
approxi-mately constant valueV
NaCl 0:4 Vover the complete z range. In contrast, V
Td increases for z lower than 150 pm reaching þ0:8 V at z¼50 pm. As shown re-cently [12,23,24,28], the presence of a charge qchanges the value of V with respect to its value on the substrate.
This effect is due to the interaction ofqwith the potential created by the tip-substrate potential differenceVV
NaCl. The interaction term is proportional toqðVV
NaClÞand, consequently, depends on the sign of the charge. The shift ofV
Td toward positive values observed in Fig.5indicates that the Td molecule is negatively charged, confirming our previous observations. Therefore, we conclude that the SP species can be described as a neutral molecule ½CuðIIÞdbm20 and the Td one as a negative ion ½CuðIÞdbm21. Note that the amplitude of the voltage shift we observe cannot be related in a simple way to the value of the charge as it depends on the tip structure. Moreover, the large value (nearly þ1:4 V) we observe in Fig. 5(b) cannot be explained with simple models [12,23,24,28], and more realistic calculations are needed to reach a better understanding of these measurements [29].
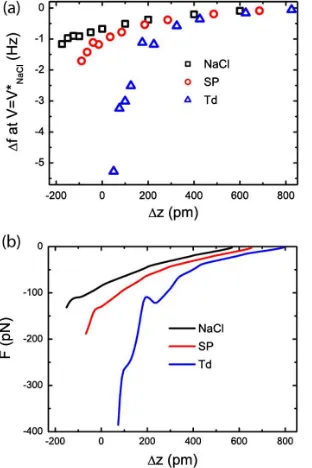
The frequency shift as a function ofzatV¼V
NaClon NaCl, on the SP, and on the Td species resulting from the fitting curves displayed in Fig. 5 is shown in Fig. 6(a). The corresponding forces, obtained by using the method proposed in Ref. [30], are shown in Fig.6(b).
The experimental points plotted in Fig. 6(a) were ob-tained at a tip-NaCl distance of about 700 pm, fixed by the imaging conditions (It¼700 fAandVt¼400 mV). In this distance regime and at V¼V
NaCl, only the FIG. 4 (color online). STM images before (a) and after (b) the
switching of a molecule. (c) The difference between (b) and (a).
FIG. 5 (color online). (a) Frequency shiftfas a function ofV
above NaCl, a SP, and a Td molecule.z¼100 pm. Imaging conditions: Oscillation amplitude A¼240 pm, It¼0:7 pA, andVt¼400 mV. Each measurement is fitted with a parabola (red lines). (b)VðzÞabove NaCl, the SP, and the Td molecule.
PRL106,216103 (2011) P H Y S I C A L R E V I E W L E T T E R S 27 MAY 2011week ending
van der Waals interaction contributes to the force on NaCl. When the tip is above a molecule, at the same distance, this term still contributes. The molecular contribution to the force can be isolated by subtracting this NaCl contri-bution to the molecular force curves. If the molecular van der Waals and the short-range chemical contributions can be neglected, the resulting force curves correspond to the interaction of the charge with its tip and substrate images. For the experiments presented here, the maximum force atV¼V
NaCl remains below 400 pN.
These findings open new perspectives. This molecular switch is highly reliable and does not require delicate preparation procedures such as atomic and/or molecular manipulations on NaCl to be operative. The wide possibil-ities offered by synthetic chemistry render it possible to incorporate such a redox center as a building block in new molecular architectures for charge engineering, in which charges could be used to store, transmit, or even process information. The conformational change associated with charging could be used to reveal easily and unambiguously the presence of a charge, without relying on delicate AFM measurements. Another application would be to utilize this molecular switch as an electromechanical transducer, where the molecular rearrangement associated with the oxido-reduction cycle could be used as a driving mecha-nism in a synthetic molecular motor [31].
The authors thank A. Gourdon and E. Dujardin for careful reading of the manuscript. A. S. gratefully ac-knowledges financial support from the NSF Chemistry REU program. This work has been supported by the French National Agency in the frame of its program in Nanosciences and Nanotechnologies (MolSiC No.
ANR-08-P058-36) and by the European Commission within the project ARTIST (Contract No. 243421). The images have been processed with theWSXMsoftware [32].
[1] B. L. Ferringa, Molecular Switches (Wiley-VCH, Weinheim, 2001).
[2] J. E. Greenet al.,Nature (London)445, 414 (2007). [3] C. P. Collieret al.,Science285, 391 (1999).
[4] A. Livoreil, C. O. Dietrich-Buchecker, and J.-P. Sauvage, J. Am. Chem. Soc.116, 9399 (1994).
[5] S. Jan van der Molden and P. Liljeroth,J. Phys. Condens. Matter22, 133001 (2010).
[6] B.-Y. Choiet al.,Phys. Rev. Lett.96, 156106 (2006). [7] C. Driet al.,Nature Nanotech.3, 649 (2008).
[8] A. Safiei, J. Henzl, and K. Morgenstern,Phys. Rev. Lett.
104, 216102 (2010).
[9] J. Repp, G. Meyer, F. E. Olsson, and M. Persson,Science
305, 493 (2004).
[10] G. Mikaelian, N. Ogawa, X. W. Tu, and W. Ho,J. Chem. Phys.124, 131101 (2006).
[11] S. W. Wu, N. Ogawa, G. V. Nazin, and W. Ho,J. Phys. Chem. C112, 5241 (2008).
[12] L. Grosset al.,Science324, 1428 (2009).
[13] T. Ko¨niget al.,J. Am. Chem. Soc.131, 17 544 (2009). [14] F. Mohnet al.,Phys. Rev. Lett.105, 266102 (2010). [15] F. J. Giessibl,Appl. Phys. Lett.76, 1470 (2000). [16] B. Maet al.,J. Chem. Crystallogr.29, 793 (1999). [17] C. J. Ballhausen, Introduction to Ligand Field Theory
(McGraw-Hill, New York, 1962).
[18] V. Amendolaet al.,Chem. Eur. J.5, 3679 (1999). [19] J. R. Bradbury, J. L. Hampton, D. P. Martone, and A. W.
Maverick,Inorg. Chem.28, 2392 (1989).
[20] M. S. Owen and A. T. Brooker, A Guide to Modern Inorganic Chemistry (Longman Scientific & Technical, Harlow, 1995), 4th ed.
[21] J. Reppet al.,Phys. Rev. Lett.94, 026803 (2005). [22] C. Villagomezet al.,Chem. Phys. Lett.450, 107 (2007). [23] R. Stompet al.,Phys. Rev. Lett.94, 056802 (2005). [24] Y. Azuma, M. Kanehara, T. Teranishi, and Y. Majima,
Phys. Rev. Lett.96, 016108 (2006).
[25] S. Morita, R. Wiesendanger, and E. Meyer,Noncontact Atomic Force Microscopy(Springer, Berlin, 2002). [26] M. Guggisberget al.,Phys. Rev. B61, 11 151 (2000). [27] S. Kitamura and M. Iwatsuki,Appl. Phys. Lett.72, 3154
(1998).
[28] F. Bocquet, L. Nony, and C. Loppacher,Phys. Rev. B83, 035411 (2011).
[29] The value of the voltage shift we measured in similar experimental conditions but with different tips varied from 0.5 to 1.4 V. We also performed experiments on a bilayer of NaCl on Ag(111) and observed a similar switching behavior, with values for the maximal voltage shift of the order of 0.5 V.
[30] J. E. Sader and S. P. Jarvis, Appl. Phys. Lett. 84, 1801 (2004).
[31] A. Carellaet al.,Dalton Trans. (2007) 177.
[32] I. Horcaset al.,Rev. Sci. Instrum.78, 013705 (2007). FIG. 6 (color online). (a) Frequency shift at V¼V
NaCl¼ 0:4 V and (b) forces above NaCl, a SP, and a Td molecule as a function ofz.
PRL106,216103 (2011) P H Y S I C A L R E V I E W L E T T E R S 27 MAY 2011week ending