Magnetotelluric Phase Tensor Application to Geothemal
Modeling
Agung Budi Laksono1, Witta Putri Anggraini1, Chevy Iskandar2, Bagus Sapto Mulyatno1 1
University of Lampung, Engineering Faculty, Geophysical Engineering Department, Telp. (0721)704947, Fax. (0721)704947, E-mail : [email protected]
2
PT. Geo Dipa Energi, Jakarta Selatan 12160, Telp. (021)7245673, Fax. (021)7247539, Email: [email protected]
Summary
Phase tensor analysis generate invariant parameters of phase tensor ellipticity and phase tensor skew angle determines the dimensionality of regional impedance tensor and geoelectrical strike. Geoelectrical strike and dimensionality information generated by the phase tensor of the regional structure can used to remove the galvanic distortion from measured impedance tensor and number of assumed parameters required to remove galvanic distortion is a function of this dimension. As key equation for galvanic distortion is Z = DZR so regional impedance tensor can be rewritten as ZR = D
-1
Z. And D-1 is derived after the dimension information provided by phase tensor and accordingly one, two and four assumptions are made for 1D, 2D and 3D structures for the removal of galvanic distortion. The invariant parameters of the phase tensor, such as the ellipticity (Φmax and Φmin) and slope angle of phase tensor (β) determine the dimensionality of the impedance tensor. If the structure of 1-D, then Φmax and Φmin will be equal, so the phase tensor form will bea circle with β is zero or near zero, for structur of 2-D the value Φmax ≠ Φmin while β is still zero or near zero and for 3D structure all components in tensor each impedance has a value and β ≠ 0 with a value of β> 3 °. The results of the above phase tensor analysis show that the 1-D and 2-D structures are shown at frequencies of 320 Hz to 0.2 Hz (the period of 0.0031s to 5.4s) and 3-D structures are shown at less from frequencies 0.11 Hz (period 9.588s). If the graphical representation non-symmetrical ellipse 2-D to the ellipse axis this because β ≠ 0, so it needs to be rotated to the ellipse axis with the angular value generated by calculation of α-β is -10o. The angle α − β defines direction of the major axis of the tensor ellipse in the Cartesian coordinate system used to express the tensor. Knowing the orientation of the major axis the ellipse may then be constructed from knowledge of the lengths of the major and minor axes (i.e. from max and min). A more direct and simpler way of drawing the tensor ellipse is to recall that the matrix representing the tensor can be thought of as mapping of one vector into another. This is easily and compactly implemented in modern computer languages such as MATLAB.
Introduction
This is the case in the Magnetotelluric (MT) study to obtain an accurate representation of the subsurface resistivity structure of the earth. However, magnetotelluric data obtained from acquisitions in the field can still be affected by noise and galvanic distortion. The presence of galvanic distortion in magnetotelluric data can mask the true dimensions of the subsurface resistivity structure until it can ultimately reduce interpretation errors.
The most common techniques used for distortion removal are the decomposition method of Groom & Bailey (1989, 1991) and the related technique of Smith (1995). In both these methods distortion analysis is also used as a means of determining an appropriate strike of the regional structure, assuming that structure to be 2-D (McNeice & Jonesm, 2001). An alternative approach to the problem is based on the analysis of the phase and is aimed primarily at determining the dimension of the regional (undistorted) MT data, and estimating the strike direction Bahr (1988, 1991). Weaver et al. (2000) used a set of invariants of the impedance tensor to deduce the inherent regional dimensionality and to identify the presence of distortion. These invariants can be linked to the properties of the phase tensor (Weaver et al., 2000). CaldwelJ, Bibby, and Brown (2004) have introduced a new and elegant method for analysing magnetotelluric (MT) data which can be applied directly to galvanically distorted data in a regional conductivity structure of any dimension. The procedure of CBB, on the other hand, is founded on their innovative definition of a real 2x2 'phase tensor' which is independent of any real (galvanic) distortion that may be present (in fact it is identical for both the distorted and the regional data), and does not require any assumption about the dimensionality of the underlying regional conductivity.
Phase tensor analysis generate invariant parameters of phase tensor ellipticity and phase tensor skew angle determines the dimensionality of regional impedance tensor and geoelectrical strike. Geoelectrical strike and dimensionality information generated by the phase tensor of the regional structure can used to remove the galvanic distortion from measured impedance tensor and number of assumed parameters required to remove galvanic distortion is a function of this dimension. As key equation for galvanic distortion is Z = DZR so regional impedance tensor can be rewritten as ZR = D
-1
Z. And D-1 is derived after the dimension information provided by phase tensor and accordingly one, two and four assumptions are made for 1D, 2D and 3D structures for the removal of galvanic distortion.
In this paper we have used phase tensor analysis for MT datasets. Dimensionality as well as geoelectrical strike is determined using phase tensor analysis for acquired MT sites. Following Caldwell et al., 2004, and Bibby et al., 2004, we have also removed galvanic distortion from that of the regional impedance tensor using phase tensor analysis as some acquired sites were severely affected by static shift problem.
Phase Tensor Analysis
Thus the observed and regional phase tensors are identical and are independent of the distortion tensor, consistent with the behaviour expected for the phase on physical grounds. Note, no assumption about the nature or dimensionality of the regional conductivity structure is required and eq. (10) is applicable where the conductivity structure is 3-D. Written in terms of the real and imaginary components of Z in a Cartesian coordinate system (x1, x2), the phase tensor Φ can be written as the matrix
= (12)
where det(X) = X 11 X 22 − X 21 X 12 is the determinant of X. Note that, in general, Φ will be non-symmetric and that, the components of Φ are not functions of the impedance tensor arguments (component phases) alone, i.e. i j = f (arg[Zkl]).
Coordinat Invariants and Dimensionality
Just as a vector is characterized by its direction and magnitude, a real second-rank, 2-D tensor is characterized (in the general case) by a direction and three independent scalar quantities that are independent of the coordinate system used to express the tensor, i.e. by three coordinate invariants. Since any function of the invariants is also coordinate invariant many different ways of expressing the invariants are possible. In this paper we will adopt one of the representations used by Bibby (1986) in his analysis of the DC apparent resistivity tensor. The coordinate invariants that we will use are the maximum (Φmax) and minimum (Φmin) tensor values, simple functions of the tensor components given in the Appendix, and the skew angle β given by the expression
β= tan-1 (13)
This angle can be thought of as a rotation and is a measure of the tensor’s asymmetry. Note that β
depends on the tensor’s skew (Φ12 − Φ21), which is invariant under rotation but changes sign if the coordinate system is reflected.
Figure 1. Graphical representation of the phase tensor. The lengths of the ellipse axes, which represent the principal axes of the tensor, are proportional to the principal (or singular) values of the tensor. If the phase tensor is non-symmetric 2-D, a third coordinate invariant represented by the angle β is needed to characterize the tensor. The direction wich became geoelectrical strike of the major axis of the ellipse, given by the angle α − β, defines the relationship of the tensor
to the observer’s reference frame or coordinate system (x1, x2) (CaldwelJ, Bibby, and Brown, 2004).
Examples for Phase Tensor Analysis and Galvanic Distortion Removal of Acquired MT Data
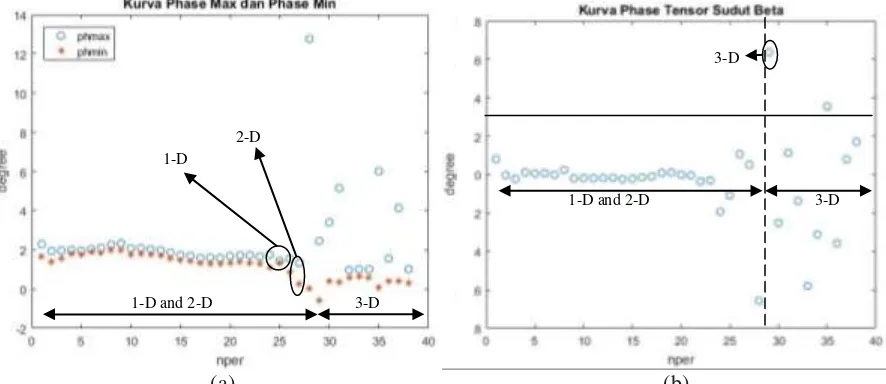
The invariant parameters of the phase tensor, such as the ellipticity (Φmax and Φmin) and slope angle of phase tensor (β) determine the dimensionality of the impedance tensor. If the structure of 1-D, then
Φmax and Φmin will be equal, so the phase tensor form will be a circle with β is zero or near zero, for
(a) (b)
Figure 2. Curve of invariant parameters of phase tensor, (a) Curve of Φmax and Φmin and (b) Beta curve.
The results of the above phase tensor analysis show that the 1-D and 2-D structures are shown at frequencies of 320 Hz to 0.2 Hz (the period of 0.0031s to 5.4s) and 3-D structures are shown at less from frequencies 0.11 Hz (period 9.588s). Then from the invariant parameters (Φmax, Φmin and β) above can describe the representation graph as described earlier in Figure 1.
Figure 3. Graphical representation (elliptic phase shape) and strike direction of phase tensor analysis at (a) frequency 1.83 Hz (period 0,5450s) and (b) frequency 0.2 Hz (period 5.4s).
In Figure 3 (a) The phase tensor form almost resembles a circle so that in that period or frequency it has dimensionality with a 1-D structure.While in Fig. 3 (b) showing the non-symmetrical ellipse 2-D to the ellipse axis this because β ≠ 0, so it needs to be rotated to the ellipse axis with the angular value generated by calculation of α-β is -10o.
1-D
2-D
1-D and 2-D
3-D
3-D
1-D and 2-D 3-D
(a) (b)
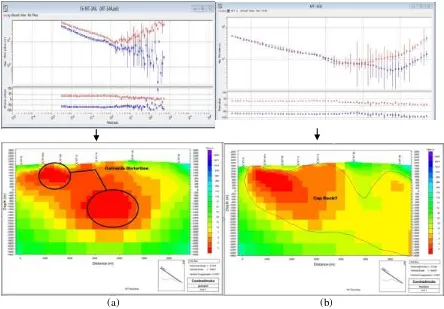
Figure 4. (a). Distorted (before rotated) dan (b) Undistorted (after rotated to angular -10o )
In the above MT sounding data shows the change of data after rotated to α - β is -10o. Previously the MT sounding (a) data showed distorted at low periods, then after the sound curve the MT sounding at low period did not show distorted after rotation.
Conclusion
The phase tensor analysis provides dimensionality information of 1D and 2-D structures at frequencies of 320 Hz to 0.2 Hz (periods of 0.0031s to 5.4s) and 3-D structures at less than 0.11 Hz (period 9.588s) and tensor impedance must be rotated at an angle α - β is -10o. Tensor Phase Analysis can be used for the removal of galvanic distortion at high frequencies or low period.
References
Bahr, K., 1988. Interpretation of the magnetotelluric tensor: regional induction and local telluric
distortion, J. Geophys., 62, 119–127.
Caldwell, T.G., Bibby, H.M. & Brown, C., 2004. The magnetotelluric phase tensor, Geophys. J. Int., 158, 457–469.
Groom, R.W. & Bailey, R.C., 1989. Decomposition of the magnetotelluric tensors in the presence of
local threedimensional galvanic distortion, J. geophys. Res., 94, 1913–1925.
Groom, R.W. & Bailey, R.C., 1991. Analytical investigations of the effects of near surface
three-dimensional galvanic scatterers on MT tensor decomposition, Geophysics, 56, 496–518.
McNeice, G.W. & Jones, A.G., 2001. Multisite, multi frequency tensor decomposition of
magnetotelluric data, Geophysics, 66, 158–173.
Smith, J.T., 1995. Understanding telluric distortion matrices, Geophys. J. Int., 122, 219–226.
Weaver, J.T., Agarwal, A.K. & Lilley, F.E.M., 2000. Characterization of the magnetotelluric tensor