Preprint submitted to Current Biology (2017).
Published in final edited form as:
Current Biology. 2017. DOI: 10.1016/j.cub.2017.10.034
Altered structural connectivity of the left
visual thalamus in developmental dyslexia
Christa Müller-Axt1,*, Alfred Anwander2,Katharina von Kriegstein1,3,4
1
Research Group Neural Mechanisms of Human Communication, Max Planck Institute for Human Cognitive and Brain Sciences, Leipzig, Germany
2
Department of Neuropsychology, Max Planck Institute for Human Cognitive and Brain Sciences, Leipzig, Germany
3
Department of Psychology, Humboldt University of Berlin, Berlin, Germany 4
Faculty of Psychology, Technical University of Dresden, Dresden, Germany
*Corresponding author:
Christa Müller-Axt
Max Planck Institute for Human Cognitive and Brain Sciences Research Group Neural Mechanisms of Human Communication Stephanstr. 1a, 04103 Leipzig, Germany
Phone: +49 341 9940-2306 Email: [email protected]
http://www.cbs.mpg.de/employees/muelleraxt
Summary
Developmental dyslexia is a highly prevalent reading disorder affecting about 5-10% of children [1]. It is characterized by slow and/or inaccurate word recognition skills as well as by poor spelling and decoding abilities [2]. Partly due to technical challenges with investigating subcortical sensory structures, current research on dyslexia in humans by-and-large focuses on the cerebral cortex [3-7]. These studies found that dyslexia is typically associated with functional and structural alterations of a distributed left-hemispheric cerebral cortex network [e.g., 8, 9]. However, findings from animal models and post-mortem studies in humans suggest that dyslexia might also be associated with structural alterations in subcortical sensory pathways [10-14, reviewed in ref. 7]. Whether these alterations also exist in dyslexia in-vivo and how they relate to dyslexia symptoms is currently unknown. Here we used ultra-high resolution structural magnetic resonance imaging (MRI), diffusion MRI and probabilistic tractography to investigate the structural connections of the visual sensory pathway in dyslexia in-vivo. We discovered that individuals with dyslexia have reduced structural connections in the direct pathway between the left visual thalamus (LGN) and left middle temporal area V5/MT, but not between the left LGN and left primary visual cortex. In addition, left V5/MT-LGN connectivity strength correlated with rapid naming abilities – a key deficit in dyslexia [15]. These findings provide the first evidence of specific structural alterations in the connections between the sensory thalamus and cortex in developmental dyslexia. The results challenge current standard models and provide novel evidence for the importance of cortico-thalamic interactions in explaining dyslexia.
Results and Discussion
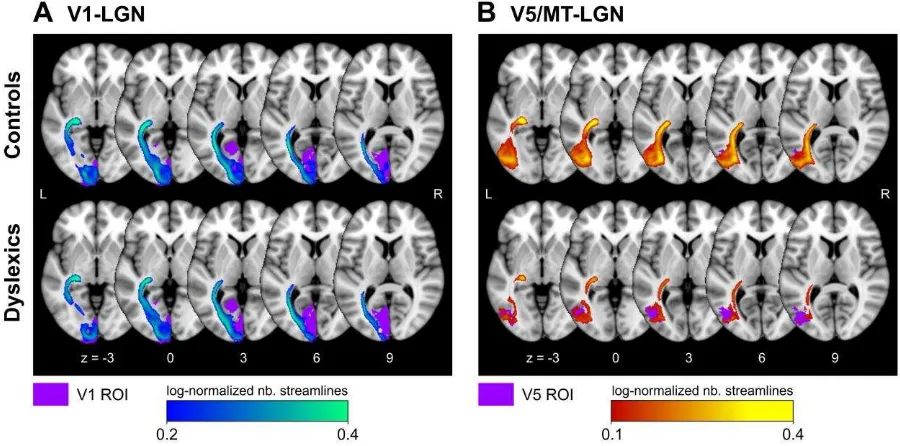
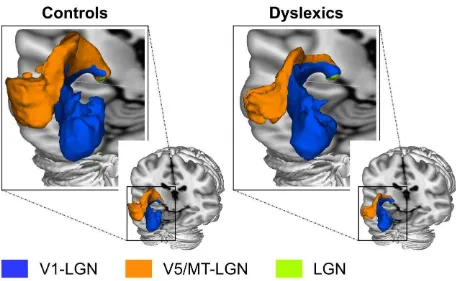
We derived the left V1 and V5/MT masks from a volume-based probabilistic atlas (see Methods). Both the V1-LGN (Figure 2A) and the V5/MT-LGN (Figure 2B) connection could be reliably reconstructed by probabilistic tractography in all participants (N=24; see Methods). The direct V5/MT-LGN connection was clearly separate from the V1-LGN connection and was consistently located dorsal to the V1-LGN connection in both groups (Figure 3).
Figure 3. Three-dimensional representation of the left V1-LGN and V5/MT-LGN group averaged tracts in controls (n=12) and dyslexics (n=12) in MNI standard space. The group averaged tracts were thresholded to the same values as in Figure 2.
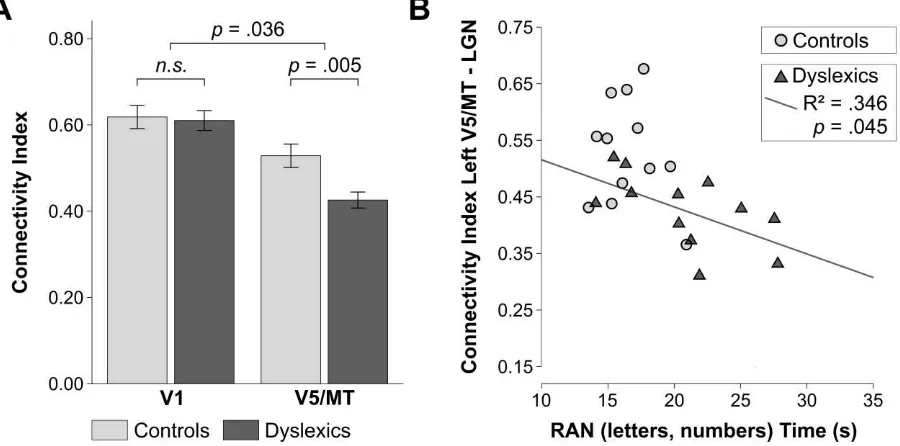
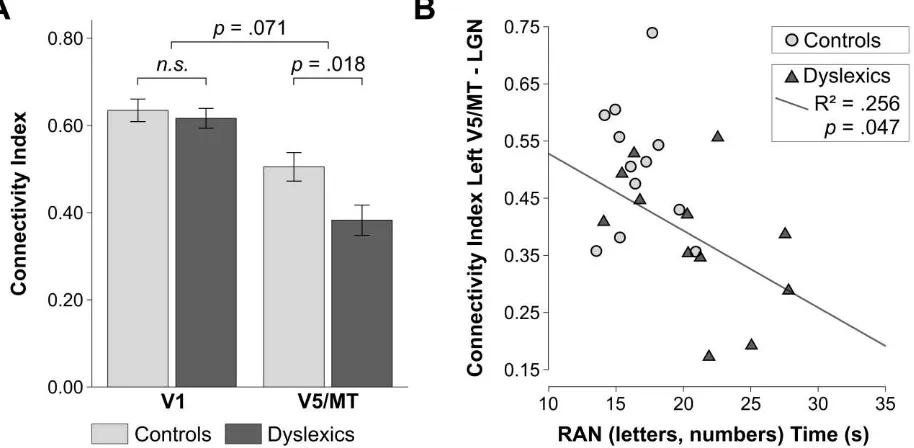
4.28, P = .05, η2 = .16]. In addition, the analysis revealed a significant interaction between group and cortical seed area [F(1, 22) = 4.97, P = .036, η2 = .07]. Planned comparisons (one-tailed independent t-tests; Bonferroni corrected) showed that individuals with dyslexia had significantly lower connectivity indices for the connection left V5/MT-LGN as compared to controls [t(22) = 3.13, P = .005, ds = 1.28] (Figure 4A). Conversely, there was no difference in the connectivity indices for the left V1-LGN connection between controls and dyslexics [t(22) = .24, P = .82,ds = .10].
Figure 4. Structural connectivity of the LGN in the left hemisphere in controls (n=12) and dyslexics (n=12), and its behavioral relevance for a key dyslexia symptom. A. LGN connectivity indices in the left hemisphere in controls and dyslexics obtained from probabilistic tractography using a volume-based atlas for defining cortical seed areas V1 and V5/MT. Error bars represent ± 1 SEM. B. The strength of V5/MT-LGN connectivity correlated negatively with the time needed to rapidly name letters and numbers in dyslexic but not in control participants. Rapid naming abilities were measured with the standard diagnostic test for RAN [27].
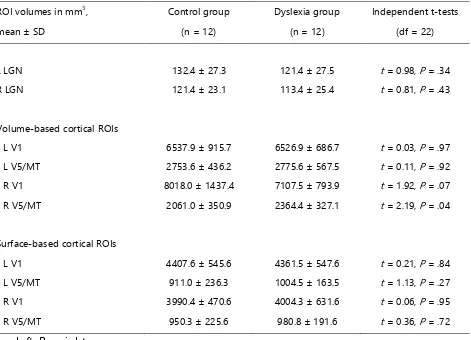
the volume of the respective seed mask. Secondly, and even more importantly, there was no significant difference in the mean volume of the LGN target masks [t(22) = .98, P = .34] nor the V5/MT seed masks [t(22) = -.11, P = .92] between groups (Table S2). The finding of reduced structural connections in the direct left V5/MT-LGN pathway in dyslexics adds two fundamental novel contributions to the field. First, while Livingstone et al. [10] have shown histological alterations at the level of the LGN in several post-mortem cases with dyslexia, we here showed that the connections between the LGN and the cerebral cortex were reduced in dyslexics in-vivo. This finding is particularly interesting, because it parallels findings in animal models, where the induction of cortical microgyria, which are similar to those discovered in post-mortem brains of dyslexics, led to a severe reduction in thalamo-cortical and cortico-thalamic connections [13, reviewed in ref. 7]. Second, our study revealed a specific reduction in left-hemispheric cortico-subcortical connections between visual area V5/MT and the LGN in dyslexics, while the connections between V1 and the LGN were spared. Such a specific reduction is informative about the possible functional roles of structural alterations in the early visual pathway for dyslexia symptoms.
connections had more severe rapid naming deficits. There was no significant correlation between the strength of left V5/MT-LGN connections and participants’ reading comprehension scores, neither in dyslexic [R = -.213, P = .507] nor in control participants [R = .076, P = .814]. The behavioral correlation between the strength of left-hemispheric V5/MT-LGN connections and a dyslexia diagnostic score (i.e. rapid naming ability) implies a behavioral relevance for V5/MT-LGN alterations for a core dyslexia symptom. Rapid naming performance is one of the strongest predictors of reading ability, and deficits in rapid naming ability present a core symptom of dyslexia in childhood throughout adolescence and in adulthood [28-30, reviewed in ref. 15].
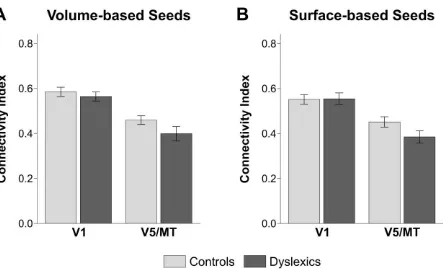
One feature of studies with modest sample sizes is that the results are prone to variation based on minute analytical changes [31]. In a next step, we therefore aimed to reproduce the results of our tractography analysis using a surface-based approach [32] to define visual cortical areas V1 and V5/MT (see Methods). While volume-based atlases are widely used in neuroimaging research, surface-based atlases are thought to yield a higher anatomical mapping accuracy [32, 33]. We found qualitatively the same results as with the volume-based atlases, i.e. a significant reduction of left-hemispheric V5/MT-LGN connections in dyslexics and a significant correlation of the connectivity strength of this pathway with rapid naming abilities in dyslexics only (see Figure S1).
The observed correlation between left V5/MT-LGN connectivity strength and rapid naming abilities in dyslexics was not predicted by purely cortical models of dyslexia [see e.g. 7]. The result, however, converges well with recent findings in the auditory modality [16, 40-42]. Most important in the context of the present study, an fMRI study showed lower responses of the left auditory sensory thalamus (i.e., the medial geniculate body, MGB) in dyslexics as compared to controls for recognizing phonemes in contrast to other speech features [16]. Crucially, the amount of this task-dependent left MGB modulation predicted rapid naming abilities for letters and numbers in dyslexics. This previous fMRI and the present study together suggest that rapid naming difficulties in dyslexia are associated with aberrant function of the sensory thalamus and its connections – both in the visual and the auditory modality. The findings also imply that dyslexia might be best explained by a combination of cortical and subcortical sensory accounts of developmental dyslexia [e.g., 16, 40-43] into a comprehensive cortico-subcortical framework.
rather low spatial resolution of diffusion-weighted MRI data and because probabilistic tractography does not give information about the direction of resolved connections. Although the findings give first insight in the potential functional role of subcortical sensory alterations in the visual pathway of dyslexics, the exact nature of how these alterations lead to dyslexia symptoms remains speculative. We favor two potential explanations. First, successful reading and rapid naming involve rapid attentional shifts towards successive visual stimuli [e.g., 47, 48]. Such attentional shifts are known to be controlled by fronto-parietal areas of the dorsal processing stream [49], for which area V5/MT serves as one of the main input structures [reviewed in ref. 34]. Thus, reduced V5/MT-LGN connectivity in dyslexics could result in deficient attention mechanisms through inefficient interactions with these attention-related dorsal stream areas. Second, we have previously hypothesized that dyslexia might be characterized by inefficient top-down modulation of the sensory thalamus to fast-varying predictable stimuli such as speech [16]. This hypothesis was based on findings in the auditory modality [15], but we speculate that similar processes might occur in the visual modality for the fast-varying predictable articulatory movements associated with speech. A potential dysfunction of such top-down modulation of the visual sensory thalamus could explain deficits in speechreading in dyslexia [e.g., 50, 51]. The RAN is a multi-componential measure, which includes access and retrieval of phonological features [30]. Although phonology is often seen as a purely auditory process, it is likely that the brain uses any possible cues to represent speech in the brain including the always associated articulatory movements [e.g., 52, 53]. Thus, we speculate that the RAN scores might be related to the reduced V5-LGN connectivity in dyslexics through a deficit in accessing visual articulatory speech features [16].
(Supplementary Table S2); and the interaction between group and cortical seed area in the surface-based analysis (but not the volume-based analysis) was marginally significant (P = .071). Future studies with a higher sample size will likely help to reveal potential hemispheric differences in thalamo-cortical connectivity in dyslexia.
Conclusions
This study is the first to show structural alterations in visual subcortical sensory pathways in developmental dyslexia. Additionally, it gives important insight into the functional relevance of cortico-thalamic connections for developmental dyslexia, both because of the specificity of the reduction for the LGN-V5/MT connection as well as the behavioral correlation with a key symptom of dyslexia. Together with the few previous studies on subcortical sensory structures and function in dyslexia [10, 11, 16, 40-42], the results imply that the currently predominant approach to investigate dyslexia brain mechanisms predominantly at the cerebral cortex level might not be sufficient for a full understanding of key symptoms of the disorder [e.g., 6, reviewed in refs. 8, 9]. Our study emphasizes the need and paves the way for unraveling the contributions of subcortical sensory pathways to dyslexia with sophisticated neuroimaging approaches with high spatial resolution. We expect that in the future such approaches will lead to a better understanding of dyslexia symptoms within a comprehensive cortico-subcortical framework.
Authors Contributions. C.M.A. and K.v.K. designed the experiment. C.M.A and A.A. performed the experiment and analyzed the data. C.M.A. and K.v.K. wrote the manuscript.
References
1. Shaywitz, S.E. (1998). Current concepts - Dyslexia. New Engl J Med 338, 307-312. 2. Lyon, G.R., Shaywitz, S.E., and Shaywitz, B.A. (2003). A definition of dyslexia.
Annals of Dyslexia 53, 1-14.
3. Peterson, R.L., and Pennington, B.F. (2012). Developmental dyslexia. Lancet 379, 1997-2007.
4. Norton, E.S., Beach, S.D., and Gabrieli, J.D. (2015). Neurobiology of dyslexia. Curr Opin Neurobiol 30, 73-78.
5. Shaywitz, S.E., and Shaywitz, B.A. (2005). Dyslexia (specific reading disability). Biol Psychiatry 57, 1301-1309.
6. Boets, B., Op de Beeck, H.P., Vandermosten, M., Scott, S.K., Gillebert, C.R., Mantini, D., Bulthe, J., Sunaert, S., Wouters, J., and Ghesquiere, P. (2013). Intact but less accessible phonetic representations in adults with dyslexia. Science 342, 1251-1254.
7. Ramus, F. (2004). Neurobiology of dyslexia: a reinterpretation of the data. Trends Neurosci 27, 720-726.
8. Vandermosten, M., Boets, B., Wouters, J., and Ghesquiere, P. (2012). A qualitative and quantitative review of diffusion tensor imaging studies in reading and dyslexia. Neurosci Biobehav R 36, 1532-1552.
9. Richlan, F. (2012). Developmental dyslexia: dysfunction of a left hemisphere reading network. Front Hum Neurosci 6, 120.
10. Livingstone, M.S., Rosen, G.D., Drislane, F.W., and Galaburda, A.M. (1991). Physiological and anatomical evidence for a magnocellular defect in developmental dyslexia. Proc Natl Acad Sci U S A 88, 7943-7947.
11. Galaburda, A.M., Menard, M.T., and Rosen, G.D. (1994). Evidence for aberrant auditory anatomy in developmental dyslexia. Proc Natl Acad Sci U S A 91, 8010-8013.
12. Herman, A.E., Galaburda, A.M., Fitch, R.H., Carter, A.R., and Rosen, G.D. (1997). Cerebral microgyria, thalamic cell size and auditory temporal processing in male and female rats. Cereb Cortex 7, 453-464.
14. Rosen, G.D., Mesples, B., Hendriks, M., and Galaburda, A.M. (2006). Histometric changes and cell death in the thalamus after neonatal neocortical injury in the rat. Neuroscience 141, 875-888.
15. Norton, E.S., and Wolf, M. (2012). Rapid Automatized Naming (RAN) and Reading Fluency: Implications for Understanding and Treatment of Reading Disabilities. Annu Rev Psychol 63, 427-452.
16. Diaz, B., Hintz, F., Kiebel, S.J., and von Kriegstein, K. (2012). Dysfunction of the auditory thalamus in developmental dyslexia. Proc Natl Acad Sci U S A 109, 13841-13846.
17. Jednorog, K., Marchewka, A., Altarelli, I., Monzalvo Lopez, A.K., van Ermingen-Marbach, M., Grande, M., Grabowska, A., Heim, S., and Ramus, F. (2015). How reliable are gray matter disruptions in specific reading disability across multiple countries and languages? Insights from a large-scale voxel-based morphometry study. Hum Brain Mapp 36, 1741-1754.
18. Andrews, T.J., Halpern, S.D., and Purves, D. (1997). Correlated size variations in human visual cortex, lateral geniculate nucleus, and optic tract. J Neurosci 17, 2859-2868.
19. Briggs, F., and Usrey, W.M. (2011). Corticogeniculate feedback and visual processing in the primate. J Physiol 589, 33-40.
20. Van Essen, D.C., Anderson, C.H., and Felleman, D.J. (1992). Information processing in the primate visual system: an integrated systems perspective. Science 255, 419-423.
21. Sincich, L.C., Park, K.F., Wohlgemuth, M.J., and Horton, J.C. (2004). Bypassing V1: a direct geniculate input to area MT. Nat Neurosci 7, 1123-1128.
22. Jayakumar, J., Roy, S., Dreher, B., Martin, P.R., and Vidyasagar, T.R. (2013). Multiple pathways carry signals from short-wavelength-sensitive ('blue') cones to the middle temporal area of the macaque. J Physiol 591, 339-352.
23. Warner, C.E., Goldshmit, Y., and Bourne, J.A. (2010). Retinal afferents synapse with relay cells targeting the middle temporal area in the pulvinar and lateral geniculate nuclei. Front Neuroanat 4, 8.
25. Arrigo, A., Calamuneri, A., Mormina, E., Gaeta, M., Quartarone, A., Marino, S., Anastasi, G.P., and Aragona, P. (2016). New Insights in the Optic Radiations Connectivity in the Human Brain. Invest Ophthalmol Vis Sci 57, 1-5.
26. Skottun, B.C. (2015). The need to differentiate the magnocellular system from the dorsal stream in connection with dyslexia. Brain Cogn 95, 62-66.
27. Denckla, M.B., and Rudel, R.G. (1976). Rapid "automatized" naming (R.A.N): dyslexia differentiated from other learning disabilities. Neuropsychologia 14, 471-479.
28. Semrud-Clikeman, M., Guy, K., Griffin, J.D., and Hynd, G.W. (2000). Rapid naming deficits in children and adolescents with reading disabilities and attention deficit hyperactivity disorder. Brain and Language 74, 70-83.
29. Miller, C.J., Miller, S.R., Bloom, J.S., Jones, L., Lindstrom, W., Craggs, J., Garcia-Barrera, M., Semrud-Clikeman, M., Gilger, J.W., and Hynd, G.W. (2006). Testing the double-deficit hypothesis in an adult sample. Ann Dyslexia 56, 83-102.
30. Wolf, M., and Bowers, P.G. (1999). The double-deficit hypothesis for the developmental dyslexias. J Educ Psychol 91, 415-438.
31. Button, K.S., Ioannidis, J.P.A., Mokrysz, C., Nosek, B.A., Flint, J., Robinson, E.S.J., and Munafo, M.R. (2013). Power failure: why small sample size undermines the reliability of neuroscience (vol 14, pg 376, 2013). Nat Rev Neurosci 14, 365-376.
32. Wang, L., Mruczek, R.E., Arcaro, M.J., and Kastner, S. (2015). Probabilistic Maps of Visual Topography in Human Cortex. Cereb Cortex 25, 3911-3931.
33. Van Essen, D.C. (2005). A Population-Average, Landmark- and Surface-based (PALS) atlas of human cerebral cortex. Neuroimage 28, 635-662.
34. Born, R.T., and Bradley, D.C. (2005). Structure and function of visual area MT. Annu Rev Neurosci 28, 157-189.
35. Cornelissen, P., Richardson, A., Mason, A., Fowler, S., and Stein, J. (1995). Contrast Sensitivity and Coherent Motion Detection Measured at Photopic Luminance Levels in Dyslexics and Controls. Vision Res 35, 1483-1494.
36. Gori, S., Seitz, A.R., Ronconi, L., Franceschini, S., and Facoetti, A. (2016). Multiple Causal Links Between Magnocellular-Dorsal Pathway Deficit and Developmental Dyslexia. Cereb Cortex 26, 4356-4369.
38. Heth, I., and Lavidor, M. (2015). Improved reading measures in adults with dyslexia following transcranial direct current stimulation treatment. Neuropsychologia 70, 107-113.
39. Raschle, N.M., Chang, M., and Gaab, N. (2011). Structural brain alterations associated with dyslexia predate reading onset. Neuroimage 57, 742-749.
40. Hornickel, J., Skoe, E., Nicol, T., Zecker, S., and Kraus, N. (2009). Subcortical differentiation of stop consonants relates to reading and speech-in-noise perception. Proc Natl Acad Sci U S A 106, 13022-13027.
41. Chandrasekaran, B., Hornickel, J., Skoe, E., Nicol, T., and Kraus, N. (2009). Context-Dependent Encoding in the Human Auditory Brainstem Relates to Hearing Speech in Noise: Implications for Developmental Dyslexia. Neuron 64, 311-319. 42. Banai, K., Hornickel, J., Skoe, E., Nicol, T., Zecker, S., and Kraus, N. (2009). Reading
and subcortical auditory function. Cereb Cortex 19, 2699-2707.
43. Hari, R., and Renvall, H. (2001). Impaired processing of rapid stimulus sequences in dyslexia. Trends Cogn Sci 5, 525-532.
44. Saalmann, Y.B., and Kastner, S. (2011). Cognitive and Perceptual Functions of the Visual Thalamus. Neuron 71, 209-223.
45. Jones, H.E., Andolina, I.M., Grieve, K.L., Wang, W., Salt, T.E., Cudeiro, J., and Sillito, A.M. (2013). Responses of primate LGN cells to moving stimuli involve a constant background modulation by feedback from area MT. Neuroscience 246, 254-264. 46. Sillito, A.M., Cudeiro, J., and Jones, H.E. (2006). Always returning: feedback and
sensory processing in visual cortex and thalamus. Trends in Neurosciences 29, 307-316.
47. Vidyasagar, T.R. (1999). A neuronal model of attentional spotlight: parietal guiding the temporal. Brain Res Brain Res Rev 30, 66-76.
48. Pollatsek, A., Reichle, E.D., and Rayner, K. (2006). Tests of the E-Z Reader model: exploring the interface between cognition and eye-movement control. Cogn Psychol 52, 1-56.
49. Corbetta, M., Akbudak, E., Conturo, T.E., Snyder, A.Z., Ollinger, J.M., Drury, H.A., Linenweber, M.R., Petersen, S.E., Raichle, M.E., Van Essen, D.C., et al. (1998). A common network of functional areas for attention and eye movements. Neuron 21, 761-773.
51. Mohammed, T., Campbell, R., Macsweeney, M., Barry, F., and Coleman, M. (2006). Speechreading and its association with reading among deaf, hearing and dyslexic individuals. Clin Linguist Phon 20, 621-630.
52. Rosenblum, L.D., Miller, R.M., and Sanchez, K. (2007). Lip-read me now, hear me better later: cross-modal transfer of talker-familiarity effects. Psychol Sci 18, 392-396.
53. von Kriegstein, K., Dogan, O., Gruter, M., Giraud, A.L., Kell, C.A., Gruter, T., Kleinschmidt, A., and Kiebel, S.J. (2008). Simulation of talking faces in the human brain improves auditory speech recognition. Proc Natl Acad Sci U S A 105, 6747-6752.
54. Evans, T.M., Flowers, D.L., Napoliello, E.M., and Eden, G.F. (2014). Sex-specific gray matter volume differences in females with developmental dyslexia. Brain Struct Funct 219, 1041-1054.
55. Giraldo-Chica, M., Hegarty, J.P., and Schneider, K.A. (2015). Morphological differences in the lateral geniculate nucleus associated with dyslexia. Neuroimage Clin 7, 830-836.
56. Schneider, W., Schlagmüller, M., and Ennemoser, M. (2007). Lesegeschwindigkeits- und verständnistest für die Klassen 6-12, (Göttingen, Germany: Hogrefe).
57. Kersting, M., and Althoff, K. (2004). Rechtschreibungstest, (Göttingen, Germany: Hogrefe).
58. Raven, J.C. (1998). Advanced progressive matrices, (Oxford, UK: Oxford Psychologists Press).
59. Marques, J.P., Kober, T., Krueger, G., van der Zwaag, W., Van de Moortele, P.F., and Gruetter, R. (2010). MP2RAGE, a self bias-field corrected sequence for improved segmentation and T1-mapping at high field. Neuroimage 49, 1271-1281.
60. Griswold, M.A., Jakob, P.M., Heidemann, R.M., Nittka, M., Jellus, V., Wang, J., Kiefer, B., and Haase, A. (2002). Generalized autocalibrating partially parallel acquisitions (GRAPPA). Magn Reson Med 47, 1202-1210.
62. Talairach, J., and Tournoux, P. (1988). Co-planar stereotaxic atlas of the human brain. 3-Dimensional proportional system: an approach to cerebral imaging., (Stuttgart: Thieme Medical Publishers).
63. Jenkinson, M., Bannister, P., Brady, M., and Smith, S. (2002). Improved optimization for the robust and accurate linear registration and motion correction of brain images. Neuroimage 17, 825-841.
64. Mai, J.K., and Paxinos, G. (2008). Atlas of the Human Brain, (Academic Press). 65. Wright, P.J., Mougin, O.E., Totman, J.J., Peters, A.M., Brookes, M.J., Coxon, R.,
Morris, P.E., Clemence, M., Francis, S.T., Bowtell, R.W., et al. (2008). Water proton T1 measurements in brain tissue at 7, 3, and 1.5 T using IR-EPI, IR-TSE, and MPRAGE: results and optimization. MAGMA 21, 121-130.
66. Dice, L.R. (1945). Measures of the Amount of Ecologic Association between Species. Ecology 26, 297-302.
67. Eickhoff, S.B., Stephan, K.E., Mohlberg, H., Grefkes, C., Fink, G.R., Amunts, K., and Zilles, K. (2005). A new SPM toolbox for combining probabilistic cytoarchitectonic maps and functional imaging data. Neuroimage 25, 1325-1335.
68. Amunts, K., Malikovic, A., Mohlberg, H., Schormann, T., and Zilles, K. (2000). Brodmann's areas 17 and 18 brought into stereotaxic space - Where and how variable? Neuroimage 11, 66-84.
69. Malikovic, A., Amunts, K., Schleicher, A., Mohlberg, H., Eickhoff, S.B., Wilms, M., Palomero-Gallagher, N., Armstrong, E., and Zilles, K. (2007). Cytoarchitectonic analysis of the human extrastriate cortex in the region of V5/MT+: A probabilistic, stereotaxic map of area hOc5. Cereb Cortex 17, 562-574.
70. Wilms, M., Eickhoff, S.B., Specht, K., Amunts, K., Shah, N.J., Malikovic, A., and Fink, G.R. (2005). Human V5/MT+: comparison of functional and cytoarchitectonic data. Anat Embryol 210, 485-495.
71. Schulz, G., Crooijmans, H.J.A., Germann, M., Scheffler, K., Muller-Gerbl, M., and Muller, B. (2011). Three-dimensional strain fields in human brain resulting from formalin fixation. J Neurosci Meth 202, 17-27.
73. Behrens, T.E.J., Berg, H.J., Jbabdi, S., Rushworth, M.F.S., and Woolrich, M.W. (2007). Probabilistic diffusion tractography with multiple fibre orientations: What can we gain? Neuroimage 34, 144-155.
74. Jones, D.K. (2010). Challenges and limitations of quantifying brain connectivity in vivo with diffusion MRI. Imaging in Medicine 2, 341-355.
75. Eickhoff, S.B., Jbabdi, S., Caspers, S., Laird, A.R., Fox, P.T., Zilles, K., and Behrens, T.E.J. (2010). Anatomical and Functional Connectivity of Cytoarchitectonic Areas within the Human Parietal Operculum. J Neurosci 30, 6409-6421.
76. Blank, H., Anwander, A., and von Kriegstein, K. (2011). Direct Structural Connections between Voice- and Face-Recognition Areas. J Neurosci 31, 12906-12915.
77. Cohen, J. (1973). Eta-Squared and Partial Eta-Squared in Fixed Factor Anova Designs. Educ Psychol Meas 33, 107-112.
78. Cohen, J. (1988). Statistical Power Analysis for the Behavioral Sciences, (New York, NY: Routledge Academic).
STAR Methods
Contact for Reagent and Resource Sharing
Further information and requests for resources and reagents may be directed to, and will be fulfilled by the Lead Contact, Christa Müller-Axt ([email protected]).
Experimental Model and Subject Details Participants
Twenty-four adult German speakers were recruited for the current study. The sample included 12 participants with developmental dyslexia and 12 control participants (see Table S1 for participants’ demographic data). Both groups were matched in chronological age, sex, educational level, handedness and non-verbal IQ. In the dyslexia group, 6 participants had a prior diagnosis of developmental dyslexia, while the other 6 participants reported having persistent reading and spelling problems since childhood. Group assignments were confirmed by tests on reading speed and comprehension [56] and spelling [57]. In addition, skills of rapid automatized naming (i.e., RAN for numbers and letters) [27] were assessed. Participants with dyslexia scored lower than controls on the literacy tests as well as on rapid automatized naming for letters and numbers. The scores on the diagnostic tests of dyslexia are summarized in Table S1. Written informed consent was obtained from all participants. The study was approved by the ethics committee of the Medical Faculty, University of Leipzig, Germany.
Method Details
Participant Inclusion Criteria
Participants had to meet the following inclusion criteria: (i) no prior history of neurological and psychiatric disorders, (ii) free of psychostimulant medication, (iii) no coexisting neurodevelopmental disorders other than dyslexia (such as dyscalculia, dyspraxia), (iv) no hearing disabilities, and (v) a non-verbal IQ within the normal range (≥ 85). The first four criteria were assessed via participants’ self-reports. Non-verbal IQ was assessed with the Raven’s advanced progressive matrices test [58].
control subject was excluded because the non-verbal IQ was below the normal range (i.e., < 85).
Acquisition of High Resolution 7T MRI Data
Ultra-high resolution whole-brain anatomical images were acquired on a 7 Tesla Magnetom MRI system (Siemens Healthineers, Erlangen, Germany) using a 24-channel head array coil (NOVA Medical Inc., Wilmington MA, USA). We employed a 3D MP2RAGE sequence [59] with the following imaging parameters: 700 μm isotropic resolution, TE = 3.04 ms, TR = 8250 ms, TI1 = 1000 ms, TI2 = 3300 ms, flip angle1 = 7°, flip angle2 = 5°, FoV = 224 × 224 × 168 mm3, GRAPPA [60] acceleration factor = 2. The MP2RAGE sequence included two read-outs at different inversion times, from which a quantitative map of T1 relaxation times per voxel was calculated. These maps are well suited for brain segmentations as they provide excellent tissue contrast between white and gray matter [59]. The acquisition took approximately 13 minutes.
Acquisition of Diffusion MRI Data
Diffusion-weighted MRI (dMRI) data were acquired on a 3 Tesla Tim Trio MRI system using a 32-channel head coil (Siemens Healthineers, Erlangen, Germany). We employed a twice-refocused spin-echo echo-planar imaging (EPI) sequence [61] with the following imaging parameters: voxel size = 1.72 x 1.72 x 1.7 mm3, TE = 100 ms, TR = 12.9 s, FoV = 220 x 220 mm2, 88 axial slices covering the whole brain, no inter-slice gap. Diffusion-weighted MRI data were acquired for 60 diffusion-encoding gradient directions with a b-value of 1000 s/mm2. In addition, seven interspersed anatomical reference images without diffusion-weighting (b-value = 0 s/mm2) were obtained for off-line motion correction. The dMRI acquisition was accelerated using partial Fourier imaging (factor 6/8) and parallel imaging [GRAPPA; 60] with an acceleration factor of 2. Fat saturation was applied using a spectral saturation pulse. The dMRI sequence took approximately 16 min. In addition, a T1-weighted structural 3D image was acquired as anatomical reference on the same MRI system (MPRAGE, TE = 3.46 ms, TR = 1300 ms, TI = 650 ms, flip angle = 10°, 1 mm isotropic resolution, two averages).
Preprocessing of Diffusion MRI Data
parameters for the dMRI data, we used the seven reference images without diffusion-weighting and rigid-body registration [63], implemented in FSL (version 5.0, FMRIB Software Library, University of Oxford http://www.fmrib.ox.ac.uk/fsl). Motion correction parameters were interpolated for all 67 volumes and combined with a global registration to the T1 anatomy (in Talairach orientation) using rigid-body registration. The estimated motion correction parameters were then used to correct the gradient directions of each dMRI volume. The registered dMRI volumes were resampled to an isotropic voxel resolution of 1.72 mm and the background was masked with the skull-stripped T1-image. Finally, a diffusion tensor was fit to each voxel and fractional anisotropy (FA) maps were computed.
Segmentation of the Lateral Geniculate Nucleus
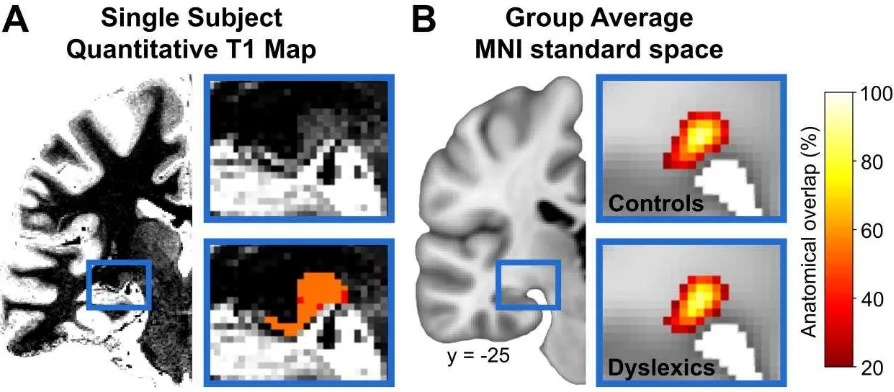
Individual ultra-high resolution 7 Tesla MRI quantitative T1 maps were used to manually segment the left LGN in each participant (Figure 1A). In coronal view, the LGN is ventrally adjoined by the hippocampal sulcus (cerebral spinal fluid, CSF). Dorsolaterally, the LGN is surrounded by the white matter fibers that form the triangular area (zone of Wernicke) [64]. Given the lower T1 relaxation times of the surrounding white matter and the high T1 relaxation times of CSF [65], the LGN can be clearly distinguished on quantitative T1 maps. Manual segmentations were performed in FSLView (http://fsl.fmrib.ox.ac.uk/fsl/fslview) by two independent raters who were both blind to participants’ group assignment.
Standardized Segmentation Procedure
LGN masks only comprised those voxels that were segmented by both raters (Figure 1A).
Inter-rater Reliability
Inter-rater reliability for the manual LGN segmentations was assessed by computing the dice coefficient as twice the amount of shared voxels between both raters’ LGN masks divided by the total number of voxels in both masks: (2 × mask_1 ∩ mask_2) / (mask_1 + mask_2), wherein mask_1 and mask_2 refer to the LGN masks of rater 1 and rater 2, respectively [66]. The obtained coefficient yields a measure of the amount of agreement between the two raters and ranges from 0 (no agreement) to 1 (perfect agreement). The agreement between raters was high – both for the LGN segmentations in control participants (0.86 ± 0.04, mean ± SD) as well as in dyslexic participants (0.85 ± 0.04).
Registrations to Individual dMRI Data
Conjoined LGN masks were registered to the individual dMRI data using a combination of linear and non-linear registrations computed with FSL. To facilitate registration accuracy, we used the individual co-registered skull-stripped uniform images of the MP2RAGE sequence rather than the quantitative T1 maps as input for these registrations. The T1-weighted structural images (aligned with the dMRI data) served as registration target. The LGN masks were then warped into the individual space of the dMRI data by applying the obtained linear and non-linear registration parameters. All registrations were visually inspected for misalignments. Finally, the registered individual LGN masks were thresholded at an intensity of 0.4 (after linear interpolation to the target image) to preserve the volumes of the conjoined LGN masks. The group-specific LGN mask volumes after registration and thresholding are summarized in Table S2.
Registrations to MNI Standard Space
Definition of Cortical Regions of Interest
We employed both a volume-based and a surface-based approach to define the cortical regions of interest (ROI) left V1 and V5/MT. Both approaches are described in detail below.
Volume-based Definition of Left V1 and V5/MT
We derived volume-based probabilistic atlases of left V1 and V5/MT from the Juelich Histological Atlas [67], as implemented in FSL. Both probabilistic atlases were in MNI standard space with a voxel size of 1 mm3.
The unthresholded probabilistic atlases of area V1 [68] and V5/MT [69, 70] cover large spatial extents due to the inter-individual anatomical variability of these areas. We therefore used the following procedure to find appropriate thresholds for the probabilistic atlases to confine the final left V1 and left V5/MT ROIs to anatomically plausible volumes: we first thresholded the probabilistic atlases at different percentages of overlap in steps of 5% from 5% to 95%. We then transformed all of these differently thresholded V1 and V5/MT atlases to each participant’s dMRI data. We therefore registered the MNI 1 mm brain template to the individual T1-weighted structural images, which were aligned with the diffusion-weighted images. Linear and non-linear registration was performed with FSL using default parameters. The probabilistic atlases were then warped to the individual dMRI data by applying the obtained linear and non-linear registration parameters. Next, the gray-matter areas of the registered V1 and V5/MT maps were computed using voxels inside the brain with FA < 0.2 to guarantee a good quality mask for tractography. Finally, the remaining mean gray matter volumes of the atlases across all participants for each initial threshold were compared to anatomical volume estimates of left V1 and left V5/MT that have been reported in the literature, and the threshold that most closely corresponded to the reported volume estimate of the respective brain area was selected.
Using a functional localizer, Bridge et al. [24] reported a volume of 2500 mm3 for area V5/MT. We therefore chose a threshold of 10 % for the probabilistic atlas of left V5/MT, which resulted in a mean volume of left V5/MT = 2765 ± 495 mm3 across participants in dMRI data space. The group-specific volume-based left V5/MT ROI volumes are summarized in Table S2 (volume-based cortical ROIs).
The comparably great difference in chosen threshold for left V5/MT (10%) and left V1 (60%) atlases can be explained by a greater inter-individual structural variability in V5/MT location compared to V1 location. The maximum anatomical overlap in the probabilistic atlas of left V5/MT is 54% as compared to 100% for left V1.
Surface-based Definition of Left V1 and V5/MT
Surface-based atlases of left V1 and V5/MT were derived from a recently published and cross-validated atlas based on fMRI [32]. We used the provided maximum probability maps (i.e., indicating the most probable region for any given point) instead of the full probability maps (i.e., indicating the likelihood that a given point is part of any region) in order to avoid probability and thus volume thresholding. As the surface-based atlas features separate maximum probability maps of both ventral and dorsal left V1, these two maps were conjoined to obtain a surface-based map covering entire left V1.
Probabilistic Tractography
We computed voxel-wise estimates of the fiber orientation distribution [72] from the preprocessed dMRI data using FSL. We estimated the distribution of up to two fiber orientations for each voxel, given the b-value and resolution of the dMRI data [73]. Probabilistic tractography was performed in individual dMRI data space using FSL with default parameters. This produces an estimate of the probability and strength of the most likely location of a pathway [73]. We used modified Euler streamlining with the visual cortical areas (i.e., left V1 or V5/MT) as seeds and the participant-specific left LGN as both waypoint and termination mask to compute the connectivity between the LGN and the respective cortical area. All analyses were done separately for each pair of seed and target region. Tractography was only computed from the cortical region to the LGN to better detect possible non-dominant connections to the cortex, which might be missed by the algorithm when seeding in the LGN. In branching situations, probabilistic tractography has the tendency to miss the non-dominant connection (false negative results), which can be reduced by seeding in cortical areas [74].
Connectivity Index
For each participant and pair of seed and target region, we computed a connectivity index, I, which was determined from the number of sample streamlines from each seed that reached the target [75]. As this number strongly depends on the number of voxels in the respective seed mask, we normalized the connectivity index, I, according to the following equation:
� =��� 5000 × ���� ��������
� ,
Tracking Consistency
To evaluate whether connections were consistently resolved in each participant, they had to meet three criteria: first, we evaluated the spatial consistency of the resolved connections across participants by visual inspection. This was done to assure that the reconstructed pathways followed the known anatomical literature priors [see e.g. 25]. Second, for the binary decision whether a specific connection was strong enough to be reliably detected by tractography, we regarded a connection between two brain areas as detected if at least 10 of the generated sample streamlines in a given seed region reached the target [76]. Finally, we computed the mean and standard deviation (SD) of the connectivity indices (i.e., log-normalized streamline counts) for both the left-hemispheric V1-LGN and V5/MT-LGN connection separately for each group. A connection of a participant was considered inconsistent if his or her connectivity index was > 2.5 SDs away from the group mean connectivity index for the respective connection. All three criteria were fulfilled for each participant and each connection considered in this study.
Group Averaged Tracts in MNI Standard Space
The output images of the probabilistic tractography for each connection (visitation maps) were normalized by logarithmic transformation (of all values > 0) and division by the logarithm (log) of the total number of generated streamlines in each seed mask. This was the same normalization procedure as described in detail in the Methods for the connectivity indices. The resulting images contained the log-normalized number of streamlines per voxel, scaled between 0 and 1. The log transformation helped to approach a Gaussian normal distribution of the initially not normally distributed visitation values and is mandatory for the normalization to the MNI 1 mm brain template, which includes linear interpolation. In MNI space, each connection was averaged within controls and dyslexics to derive group averaged tracts for left-hemispheric V1-LGN and V5/MT-LGN connections (Figure 2 and Figure 3).
Quantification and Statistical Analysis
Supplemental Data
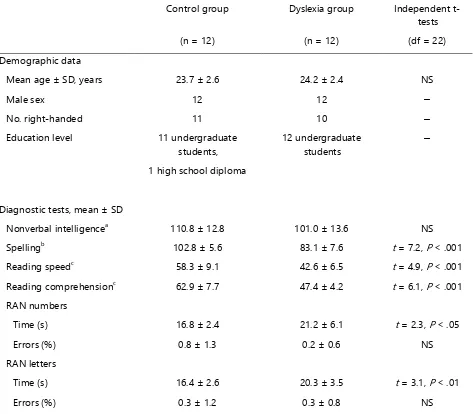
Table S1. Demographic data and diagnostic tests for controls and dyslexics, related to Figure 1, and Figure 4B.
Raven matrices, scores based on standard scores (mean = 100, SD = 15). b
Spelling test, scores based on standard scores (mean = 100, SD = 10). c
Table S2. ROI volumes for controls and dyslexics in dMRI data space, related to Figure 1A, Figure 2, Figure 4, Figure S1, and Figure S2.
ROI volumes in mm3, Control group Dyslexia group Independent t-tests
Figure S1. Results of the tractography analysis using a surface-based definition of cortical seed areas V1 and V5/MT (see Table S2), related to Figure 4.
V5/MT-LGN connections correlated negatively with the time needed to rapidly name letters and numbers in dyslexic [R = .506, P = .047] but not in control participants [R = -.141, P = .331].
Figure S2. Results of the exploratory analysis on right-hemispheric LGN connectivity (see Table S2), related to Figure 4A, and Figure S1A.