16
Component Analysis on The Eight-Month Naturally Coastal Contaminated
Outdoor Porcelain Insulator
Waluyo
1, Parouli M. Pakpahan
2, Suwarno
2, Maman A. Djauhari
31
Doctoral Student, School of Electrical Engineering and Informatics (STEI) ITB, Bandung Academic Staff, Electrical Engineering Department, ITENAS, Bandung
Email: [email protected]
2
Academic Staff, School of Electrical Engineering and Informatics (STEI) ITB, Bandung
3
Academic Staff, Department of Mathematics, ITB, Bandung
ABSTRACT
This manuscript presents the experimental results of eight months naturally coastal contaminated outdoor porcelain insulator. The conducted experiments were leakage current and applied high voltage measurements, in the hermetically sealed chamber, where temperature, humidity, pressure and applied voltage could be adjusted and measured simultaneously. The leakage current waveforms were analyzed using FFT and the relation to other parameters were analyzed using correlation coefficient and principal component analysis. On high humidity, the leakage current waveforms tended to approach pure sinusoides, and the amplitudes tended to rise. Based on the correlation coefficient, the relative humidity influenced to leakage current amplitudes and phase angle as 0.60 and -0.68 respectively. Whereas, using PCA, the humidity close to power factor, and the phase angle close to THD and applied voltage. However, the phase angle opposites to the humidity. The extracted for 2 and 3 components are 74.5% and 85.3% respectively.
Keywords: correlation coefficient, harmonic, humidity, insulator, leakage current, phase angle, PCA
INTRODUCTION
Overhead transmission or distribution lines are widely used in present power system to transmit electric power from generation stations to customer points. Their proper function depends to a large extent on the insulation system with the supporting structures [1]. The performance of outdoor insulators, as main insulating materials, is influenced by many parameters. Some of parameters are environmental contamination, humidity, temperature, pressure and applied voltage.
The pollution flashover process of insulators is greatly influenced by the insulator’s surface properties. Two main surface conditions are hydrophilic and hydrophobic. A hydrophilic surface is generally associated with ceramic insulators, such as porcelain, whereas a hydrophobic surface is associated with polymeric insulators. Under wetting conditions, hydrophilic surfaces will wet out completely so that an electrolyte film covers the insulator [2].
For better understanding of insulator pollution, wetting and the flashover process, some terms should be studied. Some terms related to this case are the local climate and environmental conditions surrounding the insulator with emphasis on wetting, pollution sources and type of pollution, and leakage current flowing over the surface of insulator [2].
Note: Discussion of this paper must be submitted before June, 1st 2008. The
proper discussion will be published in Electrical Engineering Journal volume 8, number 2, September 2008.
The performance of insulator under contaminated conditions is the underlying factor that determines insulation design for outdoor application. Conta-mination has a role to play in every outdoor insulator application. This fact was recognized since the very beginning of outdoor power delivery. There are instances where discrepancies between laboratory predictions and field experience arise. Thus, it is important to have a good understand the advantages and limitations of laboratory testing, in order to develop more sensible tests for ceramic and nonceramic insulators [3].
One of typical source of insulator pollutants is marine or coast [4]. Indonesia has the longest of coastal line in the world. Usually, a coastal region is passed through by electric power transmission or distribution lines, including switchyard. Thus, it is important to take a sample of polluted porcelain insulator from a place near a coast for research.
17
analysis of multivariate statistical tool. Thus, it can be understood each variable influence to another.
EXPERIMENTAL AND ANALYSIS METHODS
These experiments were conducted on a 20 kV coastal contaminated outdoor porcelain insulator. The contaminated insulator has been installed at PLN switchyard of Pangandaran, West Java, just around 600 m from the beach, as sample of coastal contamination, on December 15th, 2006, and then taken on August 21st, 2007.
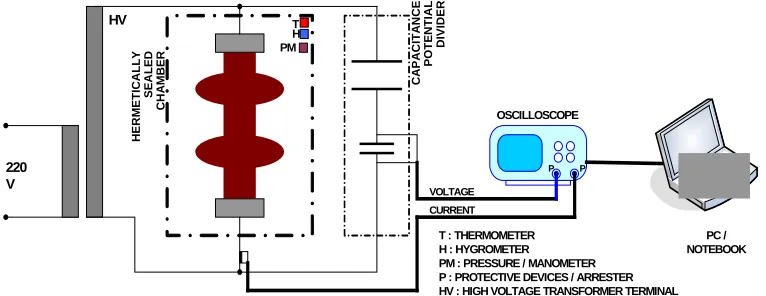
The insulator was tested in a hermetically sealed chamber, where temperature, humidity, pressure and applied voltage could be adjusted and measured simultaneously. The size of the chamber was 120 cm x 120 cm x 150 cm (WxDxH). The measurements of leakage current and applied high voltage waveforms used a 100 MHz two-channel storage digital oscilloscope. The measured data could be recorded and transferred to a computer using USB (Universal Serial Bus) and OpenChoice Desktop software. They could be saved in softcopy form. The data could be read and saved in Excel and Bitmap forms. The schematic diagram of experimental setup is shown on Figure 1.
Furthermore the data of leakage current waveforms were analyzed by fast Fourier transform using OriginPro V7.5 software. The total harmonic distortion (THD) is defined as the total ratio of the harmonic components and the fundamental which can be expressed as below [5].
Thus, the frequency spectra were obtained on some conditions of insulator. These implementations used the Danielson-Lanczos method [6]. Whereas the
relation of leakage currents to environmental parameters were analyzed using matrix of correlation coefficient of multivariate statistical tools. The correlation coefficient is derivation of covariance matrix to understand how much level of correlation among parameters base on these research results, as follows [7,8]
Thus, the components of correlation matrix as below.
(
)
The values of correlation matrix components are between -1 until 1. If a value close to -1, it represents that one parameter highly influences to another, but it is reciprocal property. Otherwise, if a value close to 1, it reveals that one parameter highly proportional influences to another. Finally, if a value close to zero, it is minor in dependency.
Another way to assess among parameter correlations is using principal component analysis (PCA) [9,10,11]. If a set of data is presented in matrix X, the main algorithm of PCA involves some steps as below.
- Determine the mean components of matrix X, those related by
- Determine covariance matrix using equation of
T
X
X
C
=
*
(5)- Determine eigen value and eigen vector of covariance matrix using equation of
Q
Q
C
=
λ
(6)where λ are eigen values and Q are eigen vectors. Base on the eigen values, it is plotted their scatters in two and three dimensions. Thus, the nearness of
P P PM : PRESSURE / MANOMETER P : PROTECTIVE DEVICES / ARRESTER HV : HIGH VOLTAGE TRANSFORMER TERMINAL
VOLTAGE CURRENT
PM
18
parameters indicates the correlation level on such parameters.
RESULTS AND DISCUSSION
Actually, there were many data on these experiments, with various humidity, temperature, pressure and applied voltage amplitudes. However, in this manuscript it is revealed some typical waveforms of result data. Generally, the data could be obtained in two forms of file, spreadsheet data and bitmap drawing files.
In this manuscript, it is presented two significant conditions, dry and wet, that indicated by low and high relative humidities.
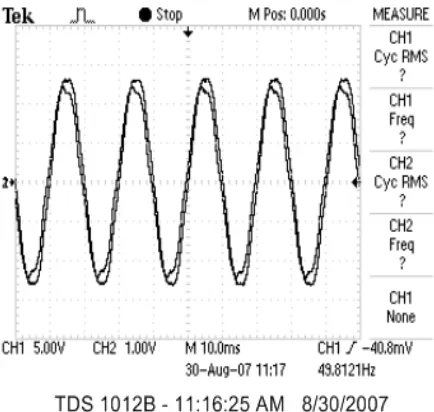
In dry hermetically sealed chamber condition, the waveform of typical leakage current measurement in bitmap form is shown on Figure 2. This waveform was obtained on condition of relative humidity, temperature, pressure and maximum applied voltage were 71%, 42.4oC, 0.2 kPa and 55.4 kV respectively.
Figure 2. Bitmap form of applied voltage and leakage current waveforms of dry polluted insulator
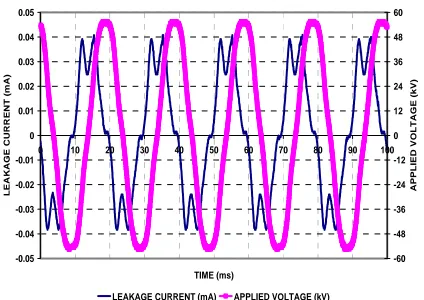
Whereas Figure 3 is Excel graphical form of applied voltage and leakage current waveforms of polluted insulator on that condition. The applied voltage is pure sinusoidal waveform, that the magnitude values are mentioned on the right side. Otherwise, the magnitude values of leakage current wave are indicated on the left side. Thus, in dry condition, the pollutants stuck on porcelain insulator surface do not influence leakage current significantly. In this case, the phase difference between leakage current and applied voltage waveforms is 74.9 degree. This is very capacitive. Based on this leakage current waveform, it will be analyzed the frequency spectrum using fast Fourier transform.
-0.05
LEAKAGE CURRENT (mA) APPLIED VOLTAGE (kV)
Figure 3. Excel graphical form voltage and leakage current waveforms of dry polluted insulator
Figure 4 shows the frequency spectrum of leakage current waveform of Figure 3. On this condition, the first to thirteenth odd harmonics are 80.15%, 0.97%, 17.94%, 5.2%, 0.27%, 1.6%, 0.39% respectively compared to leakage current amplitude. The third harmonic is very small, so that it still operates normally. Otherwise, the total harmonic distortion (THD) is 23%, so that it is also normal condition.
On other condition, Figure 5 shows bitmap form of leakage current and applied voltage waveforms on polluted insulator due to 99%, 26oC, -0.8 kPa and 10.9 kV maximum applied voltage. Furthermore, Figure 6 is its Excel graphical form. This is as sample of wet condition.
0
Figure 4. Frequency spectrum of leakage current waveforms of Figure 3
19
Figure 5. Bitmap form of voltage and leakage current waveforms of wet polluted insulator
Based on this leakage current waveform, it will be analyzed the frequency spectrum using fast Fourier transform.
LEAKAGE CURRENT (mA) APPLIED VOLTAGE (kV)
Figure 6. Excel graphical form of voltage and leakage current waveforms of wet polluted insulator
Figure 7 represents the frequency spectrum of leakage current waveform on Figure 6. The first to thirteenth odd harmonics are 95.15%, 1.11%, 5.1%, 0.97%, 0.52%, 0.77% and 0.36% respectively compared to leakage current amplitude. The total harmonic distortion (THD) is only 6%, due to the leakage current waveform tends to close pure sinusoidal wave. This is the most conductive condition among previous conditions, indicated by small total harmonic distortion.
0
Figure 7. Frequency spectrum of leakage current waveforms of Figure 6
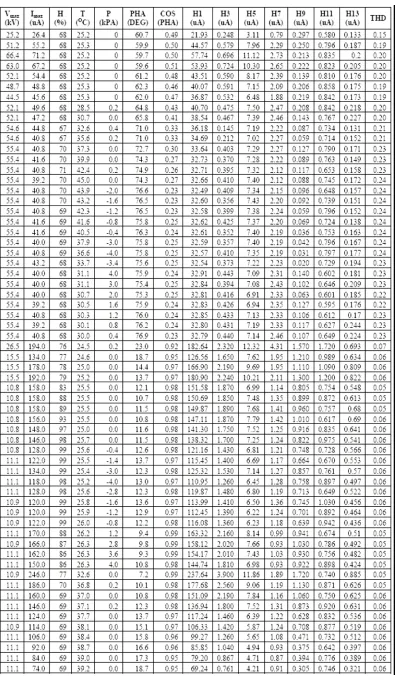
Table 1 reveals the complete summary experimental data on the measurements of coastal polluted porcelain insulator. First to last columns are maximum applied voltage (kV), maximum leakage current (micro ampere), relative humidity (%), temperature (centigrade), pressure (kPA), phase difference between leakage current and applied voltage waves (degree), cosine of phase difference, first to thirteenth odd harmonics (micro ampere), and total harmonic distortion (THD) respectively. The positive pressure means the chamber was compressed, and the negative pressure means the chamber was sucked, using electric pumps. Generally, the phase difference between leakage current and applied voltage will reduce as the relative humidity increases. The levels of correlation among parameters on coastal polluted porcelain insulator are indicated by Table 2.
20
21
Otherwise, the leakage current amplitude influences to phase angle very significantly, that is -90%. The
phase angle will reduce as the leakage current amplitude increases. Base on above explanation, the leakage current of polluted insulator is dominantly influenced by relative humidity. Furthermore, the leakage current magnitude influenced to phase angle very significantly. This indicates that on high relative humidity, the polluted insulator had resistive-capacitive non-linear characteristic property. This was occurred due to porcelain insulator property susceptible to pollution and humidity.
Generally, the leakage current amplitude will reduce as temperature rises. Technically, a high temperature existence would reduce the relative humidity, that the leakage current magnitude would consequently reduce. The high temperature also raised the phase angle. In other word, in high temperature, the insulators would be more capacitive rather than in low temperature, due to reducing of relative humidity. However, the rate of capacitive property to the temperature was higher on polluted insulator rather than that on new-clean insulator, yielded in previous measurements. Nevertheless, usually the magnitude values of phase angle were higher on the new-clean porcelain insulator rather than that on the polluted one.
Practically, on this range, the pressure did not influence to leakage current or phase angle. This is indicated by correlation coefficient of leakage current and phase angle correlated to pressure parameter as very low value, close to zero.
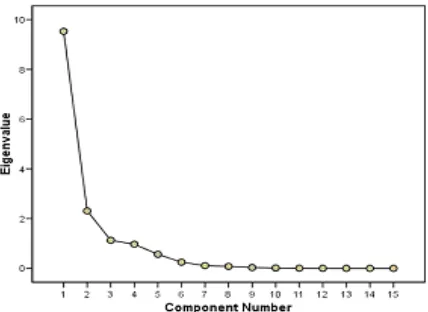
Otherwise, the data are analyzed by principal component analysis (PCA). PCA extracts the data to give most information, base on eigen values. In this case, it is presented in first two and three principal components. Figure 8 shows scree plot of eigen values for summary experimental data. The line of first to last eigen values is occured a sharp bend, so that this scree plot of data is very good, no indication of outlier.
The value of KMO (Keiser-Meyer-Olkin) measure of sampling adequacy is 0.761, more than 0.5, as indication that the used data have been adequate for analysis using PCA.
Figure 9 shows the scatter plot of first two principal components. The extracted information in this scatter plot is 78.94%. It is shown, that relative humidity is close to power factor (COS_PHA). This means, the relative humidity (H) rise so that it cause the power
factor increase significantly. Reciprocally, it reduces phase difference between leakage current and applied voltage waves (PHA). This case is indicated by the phase angle opposites far away from relative humidity (H). Little bit far from power factor, it is shown leakage current amplitude (Imax), first, third, ninth and thirteenth (H1, H3, H9 and H13) harmonics. This indicates that those harmonics are correlated to the amplitude of leakage current very significantly. The harmonics rose as the leakage current amplitude increased.
Figure 8. Scree plot for summary experimental data
Figure 9. Scatter plot of first two principal components
22
visible for higher applied voltage amplitude. Consequently, the phase difference between leakage current and applied voltage waves will increase. Besides that, the consequent of capacitive increment is also the increasing of harmonic content. This is indicated by THD, that it would rise as the phase angle increased.
Pressure (P) occupy a point that close to the zero point of coordinate, and relative far from other parameters. This indicates that pressure was low dependency to other parameters.
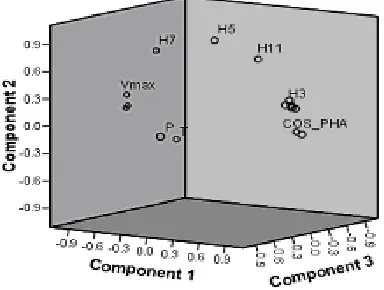
Figure 10 shows the scatter plot of first three principal components. On this scatter plot, the extracted information is 86.46%. This is higher than previous one. The power factor is closer to the relative humidity. This is proof that the relative humidity influence to power factor very significantly.
Figure 10. Scatter plot of first three principal components
Little bit further from the power factor, there are leakage current amplitude and the previous certain harmonics (H1, H3, H9, H13). These parameters were also influenced by relative humidity considerably. Otherwise, the phase angle is also opposite of power factor and relative humidity. This means, the phase angle would reduce as the relative humidity increased. Besides that, the phase angle and THD are close to applied voltage amplitude. These phenomena support the previous first two principal component analysis. Thoroughly, the principal component analysis supports the previous of correlation coefficient matrix.
CONCLUSION
On the polluted porcelain insulator, the humidity influenced to both leakage current magnitude and phase angle very significantly. This was higher than applied voltage, although the leakage current existence due to applied voltage. This was triggerred by coastal pollutant stuck on the porcelain insulator surface.
As addition, the total harmonic distortion would reduce as the relative humidity increased. Thus, the high relative humidity made the polluted porcelain insulator would be more resistive rather than capacitive.
Generally, the leakage current reduced as the temperature rose, due to relative humidity decreased. In this range, the pressure did not influence to leakage current magnitude and phase angle practically. The most harmonics were high correlated to leakage current magnitude.
REFERENCES
[1] Fernando, M.A.R. Manjula, supervised by
Gubanski, Performance for Non-ceramic
Insulators in Tropical Environments, PhD
Dissertation, Department of Electric Power Engineering, Chalmers University of Technology, Goteborg-Sweden, pp.1-2, 1999. [2] Vosloo, Wallace L., supervised by Holthhausen,
A Comparison of the Performance of High-Voltage Insulator Materials in a Severely Polluted Coastal Environment, PhD Dissertation,
Department of Electrical and Electronic Engineering, University of Stellenbosch, South Africa, March, pp.9-10, 2002.
[3] Gorur, R.S., Cherney, E.A., Burnham, J.T.,
Outdoor Insulators, Ravi S. Gorur, Inc., Phoenix,
Arizona, USA, pp.145, 1999.
[4] Vosloo, W.L., Macey, R.E., Toureil, C. de, The
Practical Guide to Outdoor High Voltage Insulators, Crown Publications CC.,
Johannesburg, South Africa, pp.36-37, 2004. [5] Suwarno, “Leakage Current Waveforms of
Outdoor Polymeric Insulators and Possibility of Application for Diagnostics of Insulator Con-ditions”, Journal of Electrical Engineering &
Technology, The Korean Institute of Electrical Engineering, Vol.1,No.1,pp.114-119, 2006.
[6] OriginLab Co., Origin V75 User's Manual, OriginLab Corporation, MA,USA, pp.601-611, 2003.
[7] Anderson, T.W., An Introduction to Multivariate Statistical Analysis, Second Edition, John Wiley
& Sons, pp.18,489, 1984.
[8] Whittaker, J., Graphical Models in Applied
Multivariate Statistics, John Wiley & Sons,
pp.17,48-51, 1996.
[9] Hannawati A., Thiang, Prasetyo Y., Odor
23
[10] Mardia, K.V., Kent, J.T., Bibby, J.M.,
Multivariate Analysis, Academic Press,
London, UK, pp.213-228, 2000.
[11] Lab. Perencanaan dan Optimasi Sistem Industri,