LABELING RESIDENTIAL COMMUNITY CHARACTERISTICS FROM COLLECTIVE
ACTIVITY PATTERNS USING TAXI TRIP DATA
Yang Zhou1, 3,*, Zhixiang Fang2
1
Wuhan Land Use and Urban Spatial Planning Research Center, 55Sanyang Road, Wuhan, China 2
State Key Laboratory for Information Engineering in Surveying, Mapping and Remote Sensing, Wuhan University, Wuhan, China –[email protected]
3
School of Remote Sensing and Information Engineering, Wuhan University, Wuhan, China - [email protected]
Commission VI, WG VI/3
KEY WORDS: Taxi trip data, activity space, residential community, land use classification, mobility patterns, O/D allocation
ABSTRACT:
There existing a significant social and spatial differentiation in the residential communities in urban city. People live in different places have different socioeconomic background, resulting in various geographically activity patterns. This paper aims to label the characteristics of residential communities in a city using collective activity patterns derived from taxi trip data. Specifically, we first present a method to allocate the O/D (Origin/Destination) points of taxi trips to the land use parcels where the activities taken place in. Then several indices are employed to describe the collective activity patterns, including both activity intensity, travel distance, travel time, and activity space of residents by taking account of the geographical distribution of all O/Ds of the taxi trip related to that residential community. Followed by that, an agglomerative hierarchical clustering algorithm is introduced to cluster the residential communities with similar activity patterns. In the case study of Wuhan, the residential communities are clearly divided into eight clusters, which could be labelled as ordinary communities, privileged communities, old isolated communities, suburban communities, and so on. In this paper, we provide a new perspective to label the land use under same type from people’s mobility patterns with the support of big trajectory data.
*
1. INTRODUCTION
The daily activity space of individuals directly shed a light on people’s lifestyle, the quality level of living, and as well as individual preferences. People live in different places may have different mobility patterns out of both geographical and socioeconomic reasons. The variation of activity space between people of different social groups or living in different residential communities reveals important aspects of social separation and isolation, thus has gained rising attention by city planner and policy makers in recent years(Wang et al. 2012).
Significant differences are found in the usage of time and space between individuals of different social groups. Zhou & Deng (2010) found that people from different classes have different spatio-temporal patterns according to a household survey involved 800 families in Guangzhou. For example, people from lower class have small activity space around the inner city or around their residential communities, while people from upper class have more time spending on outdoor activities and the travel space is much wider. Zhang & Chai (2011) focused on the middle and low income groups in Beijing, and found that their daily activity patterns show a trend of fragmentation in time and disparity in space.
In the development of urbanization and prosperity of commodity housing in Chinese cities, the economic status has become a determining factor resulting the residential segregation (Wu 2002). The commercial development accelerates sociospatial differentiations when people are able to choose where to live regarding to their social background. A direct consequence is that people from the same social class gathered to live in same community consciously. Wang et al. (2012) grouped three typical enclaves existed in current Chinese cities according to the social composition of residents: institutionally privileged enclaves, economically privileged enclaves, and ordinary neighbourhoods. By identifying three prespecified sample areas, they found that people live in these three types of communities not only share differences in place of residence, but also separate from each other at activity space. Zhang et al. (2014) had similar findings using family survey data in Beijing. These research further extend the differentiation of activity space happened on individuals to communities at a collective level.
With the support of big geo-data, to get the characteristics between locations under different land use classification or even on the same land use type from the spatial interaction and mobility patterns have drawn rising attentions in recent studies. Liu et al. (2016) proposed an unsupervised land use classification method by grouping the spatial interactions between parcels using taxi trip data in Shanghai. Kong et al. (2017) focused on the classification of public facilities, such as hospitals, using the mobility interactive patterns of visitors extracted from taxi data. These research show strong evidence that moving patterns across the urban fabric and spatial interactive patterns between two places could be used to label the physical or socioeconomic characteristics of land uses from a bottom-up perspective.
Researchers also take the advantage of the big human-sensed data to study people’s activity space patterns in different locations. For example, mobile phone dataset was used to study the individual mobility patterns (Xie et al. 2011) and aggregated activity distance patterns around home anchor points in a city (Xu et al. 2015) and in different cities (Xu et al. 2016). However, compared to the existing studies that focus more on
the dynamic patterns at a wide range, whether it is possible to label the characteristics of residential communities from the activities patterns derived from people live in that neighbourhood is remain an open question.
Following this line, we try to understand the characteristics of residential communities by considering the aggregated mobility and activity patterns derived from taxi trips under the geographic context in this paper. Specifically, we first present a method to allocate the O/D (Origin/Destination) points of taxi trips to the land use parcels where the activities take place in. Then we employed several indices to describe the collective activity patterns, including both activity intensity, travel distance, travel time, and activity space of residents by taking account of the geographical distribution of O/Ds of all taxi trips related to that residential community. Then we cluster the residential communities with similar activity patterns via agglomerative hierarchical clustering algorithm. Finally, we explore the differences between each cluster and try to label the characteristics of communities with specific activity patterns.
The contributions of this study are two folds. Firstly, by grouping the residential communities with similar activity patterns at a collective level, we highlight the spatial distributions of residential communities of different types in different areas in Wuhan. Secondly, land use type data is usually not hard to achieve for city planners. Detailed information inside the same land use type, for example what differences lie in residential communities in the whole city, are more valuable but always hard to label. By focusing on residential communities in this paper, we provide a new perspective to label the land use under same type from people’s mobility patterns when lacking of other source data.
The reminder of this paper is organized as follows: section 2 briefly describes the study area and data used in this research; section 3 presents how we measure the aggregated activity patterns in residential community using taxi trip data; the result of the case study is reported in section 4; finally we draw our conclusions and discuss the future work in section 5.
2. STUDY AREA AND RESEARCH DATA
2.1 Study area
As the largest city in central China, Wuhan is divided into three cities, Wuchang, Hankou, and Hanyang by Yangtze River and its branch Han River. The central districts of Wuhan has 7 districts covering 888km2 in total and the main urban area inside the 3rd ring expressway is 520km2. The per capita net floor space of urban residents in 2012 is 33.5m2 (The Wuhan Statistical Bureau, 2013).
2.2 Data description
Figure 1. The land use data of Wuhan.
3. METHODOLOGY
3.1 O/D allocation
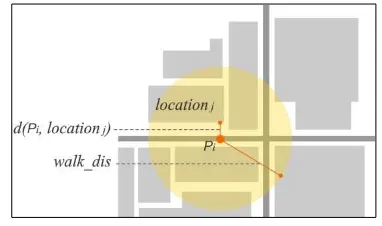
Since the O/D points of taxi trips are located on the road network, the real depart or visit land use parcel is unknown. Thus, we first allocate the O/D points �� onto the land use polygon location ��������� so as to get activity patterns derived from taxi trips inside each land use parcel.
Figure 2. Allocating taxi O/D points to land use polygons.
The actual activity place are located within a walking distance from the pick-up and drop-off locations in common sense. By searching with a distance from ��, we get a candidate polygons set where the activities may take place in, as shown in Figure 2. The shorter the distance between the point and the land use polygon, the higher probability that the activity happened in the location, and vice visa. Thus we decide the probability of an O/D point
�
� belongs to ��������� in the candidate set is calculated as equation (1):����→ ����������=� �����, ����������� (1)
where ����_��� is the searching radius, and ����, ����������
is the distance from point to polygon location. Here we use the Hausdorff distance which calculates the shortest distance from
�� to every points of the polygon edges to measure
����, ����������.
There are two rules to perform function �(∙), the minimum distance rule and the distance decay rule. Under the minimum distance rule, the point is assigned to the nearest polygon, see equation (2). Under the distance decay rule, we assign the point according to the distance decay ratio, see equation (3). We’ll discuss the effectiveness of the two rules later in the case study.
�(�) =�1,�= min(�) ����<����_���
0,��ℎ������ (2)
�(�) = 1− �
����_��� (3)
where x is the distance ����, ���������� in equation (1).
The O/D points PiO and ��� are treated separately so as to differential the arrival and depart activities happened in different locations respectively. In this stage, every polygon with all land use types are involved when generate the candidate set, then we calculate ����→ ���������� for all locations.
3.2 Collective activity patterns
The residential communities are differential from each other at the level of how residents live in these communities use the urban space temporally and spatially. Here we use the activity patterns, including the activity volume, travel distance and travel time, and activity space at the aggregated level, to demonstrate how people travel differently.
Each land use polygon is treated as an activity location. For every ���������, we have ����������� and ����������� to store all the trips depart from and arrive at it when �� is chosen as PiO
and ��� in equation (1), respectively. The intensity �_��, weighted average travel distance �_�� and travel time �_�� of the trips belongs to ��������� is defined as equations (4 – 6).
�_��=∑��∈������(��→ ���������) (4)
�_��=1
�∑��∈������(��→ ���������)���� (5)
�_��=1
�∑��∈������(��→ ���������)��� (6)
Standard distance proposed by (Bachi 1962) are proven to be effective when activity points are sparsely distributed. Here we take the mean point in the original equation as the central point of land use location, and the modified calculation is presented as (7):
���=�2 ∑ ����→����������×� �
�=1
� (7)
����_����=���� (����������) (8)
Therefore, for every location, we have a ten dimension vector from equations (4 – 8) to depict all the arriving and departure activity patterns.
Figure. 3 Four ways to depict the activity space: (a) standard ellipse based on home and work place; (b) standard circle; (c) minimum convex polygon; (d) standard distance ellipse.
3.3 Clustering by collective activity patterns
The agglomerative hierarchical clustering algorithm is a bottom-up algorithm because it does not require any prespecified number of clusters. It treats each observations as a singleton cluster at the first step, and then merge pairs of clusters successively considering the similarity until all clusters are agglomerated into one big cluster containing all observations. The algorithm detail could be referred in (Han et al. 2011). By only keeping the residential land use type, we employ the agglomerative hierarchical clustering algorithm to cluster the residential communities with similar activity patterns.
4. RESULTS
4.1 O/D allocation
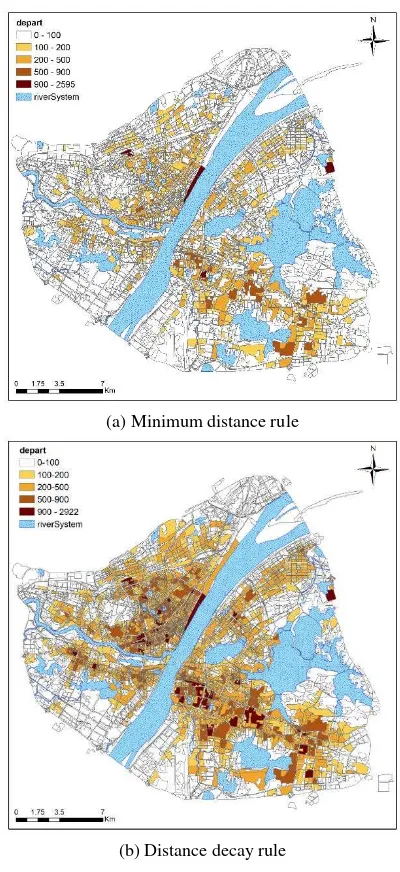
In the O/D allocation process, we set ����_���= 200m, which is the same as the walking distance used for taxi passengers in Kong et al. (2017) , to create the buffer around the taxi pick-up and drop-off locations. Then we calculate the activity intensity of each land use parcel all over the city. Figure 4 shows an example of the geographical distribution of depart activity intensity in 9/7/2012. When adopting the minimum distance rule (see Figure 4(a)), there are a lot of land use polygons have particularly low intensity or even none trips, especially in areas close to the third ring. The distribution of the intensities is quite uneven, which results in a problem that the larger the area of the polygon, the higher the intensity is. This is because the minimum distance allocation does not take the GPS errors and human behaviour randomness into account.
The results of distance decay rule (as shown in Figure 4(b)) performs better and makes more sense than the minimum distance rule. The areas with highest intensity are the business centers inside the city, such as Wuguang, Jiedaokou, Wangjiadun, and Guanggu. Apart from that, the three railway stations also attract high density of trips. Compared to residential communities, public facilities such as universities
show a high intensity of activities taken by taxi. This is because the fall term always starts in the early September in universities, there is a high possibility that students and parents take taxies to depart from or arrive at universities. Hankou district has the more activity hotspots than the other two districts, while Hanyang district has the lowest visiting intensity by taxi.
(a) Minimum distance rule
(b) Distance decay rule
Figure 4. The depart activity intensity in all land use parcels in 9/7/2012 when adopting different allocation rules.
4.2 Clustering patterns of residential communities
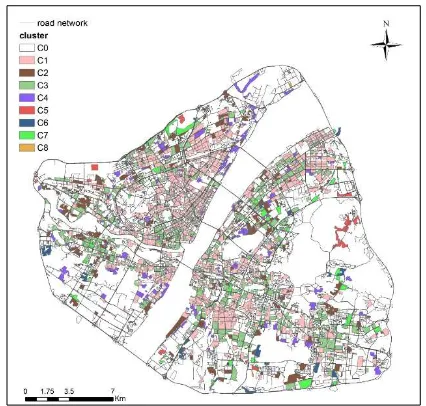
The hierarchical clustering tree is plotted as Figure 5. We take the value at the red line to cut the tree and finally get 8 clusters, from C1 to C8. The statistical values and the spatial distribution of the clustering results are mapped in Figure 6 and Figure 7 respectively. The C0 in Figure 7 is marked as errors.
depart home. The two activity space measurements, i.e. ��� and area_SDEj, have a very similar tendency in each cluster, which means that the two indices have almost same effects when depicting activity space patterns. The average value of travel distance �_�� and travel time �_�� between each cluster have little differences also.
Figure 5. The hierarchical clustering tree and the cut line (red).
Most residential communities belong to C1 and C3, which could be classified as ordinary communities. The ��� and area_SDEj in C3 are slightly larger than in C1. The residents live in these communities are mainly middle class householders. Among the eight clusters, the C8 cluster has the lowest activity intensity �_��, which only contains four residential communities located near the boundary of the main city. The travel cost and activity space are the highest in C5, in which the residential communities are distributed in the suburban. The geographical factor such as lakes have huge impact on the travel patterns of residents living in this cluster. Although communities in C5 and C8 are both located in the margin of the city, people live in communities in C5 have much higher travel cost, which implies a lack of efficient transportation vehicles around these areas. The communities in these two clusters could be labelled as suburban communities.
Figure 6. Statistical values of the clustering patterns
Compared to ordinary communities, the intensity �_�� of C2 are lower than that of C1 and C3, while the activity space (both ��� and area_SDEj) are larger. This implies that taxi is not an always choice for people living in C2, but whenever they travel by taxi, they are likely to go to a remote place. There is a high possibility that people live in communities of this cluster have a high ownership of private car, hence they are little dependent on
taxis for travel. And they are probably have a high income level that the taxi fee is not a foremost factor when making choices. We identify communities in C2 to be privileged communities, including the institutionally privileged communities that located inside or beside the government bureaus/institutions, such as dependent’s area of Wuhan University, and economically privileged communities such as Lidao Garden community.
Figure 7. The geographical distribution of eight clusters of residential communities.
In contract with C2, the resident in C4 are very old communities or communities under demolition, which have very low intensity �_�� and small activity space. Therefore, the communities in C4 are labelled as old isolated communities. Compared to C4, C6 and C7 have higher activity space, but moderate intensity. Further survey is needed to label the communities in these two clusters precisely.
Above all, the analysis results show that people live different places vary significantly in terms of activity patterns. The activity patterns including intensity, travel cost, and activity space are useful when labelling the different characteristics of residential communities. The huge differences between the eight clusters provide another evidence that there exists a significant social classification in the resident space inside the urban.
5. CONCLUSIONS AND FUTURE WORK
used to label the land use under same type (i.e. residential) from people’s mobility patterns when lacking of other source data.
In the future work, we will further look into the differences in each residential community regarding the temporal patterns of activities, such as when the activity happens and how does the activity change across time during a day. Additionally, we will incorporate the spatial interactions between locations in order to learn more about how different residential groups share their time as well as usage of urban space.
ACKNOWLEDGEMENTS (OPTIONAL)
This work was supported by National Natural Science Foundation of China (No. 41231171).
REFERENCES
Bachi, R., 1962. Standard distance measures and related methods for spatial analysis. Papers in Regional Science, 10(1), pp.83–132.
Han, J., Kamber, M. & Pei, J., 2011. Data mining: Concepts and Techniques, Elsevier/Morgan Kaufmann, Amsterdam/Burlington.
Kong, X. et al., 2017. Investigating Public Facility
Characteristics from a Spatial Interaction Perspective: A Case Study of Beijing Hospitals Using Taxi Data. ISPRS International Journal of Geo-Information, 6(2), p.38. Available at: http://www.mdpi.com/2220-9964/6/2/38.
Liu, X. et al., 2016. Incorporating spatial interaction patterns in classifying and understanding urban land use.
International Journal of Geographical Information Science, 30(2), pp.334–350. Available at:
http://www.scopus.com/inward/record.url?eid=2-s2.0-84948064862&partnerID=40&md5=6cfd4cbb29876d655 1a0692721148768.
Schönfelder, S. & Axhausen, K.W., 2003. Activity spaces: Measures of social exclusion? Transport Policy, 10(4), pp.273–286.
The Wuhan Statistical Bureau, 2013. Wuhan Statistical Yearbook P. Jianqiao, ed., Wuhan, China: China Statistics Press.
Wang, D., Li, F. & Chai, Y., 2012. Activity Spaces and Sociospatial Segregation in Beijing. Urban Geography, 33(2), pp.256–277.
Wu, F., 2002. Sociospatial differentiation in urban China :
evidence from Shanghai ’ s real estate markets. Environment and Planning A, 34, pp.1591–1616. Xie, R. et al., 2011. Mining Individual Mobility Patterns from
Mobile Phone Data. In TDMA’11. Beijing,China, pp. 37– 44.
Xu, Y. et al., 2016. Another Tale of Two Cities : Understanding
Human Activity Space Using Actively Tracked Cellphone Location Data. Annals of the Association of American Geographers, 106(2), pp.489–502.
Xu, Y. et al., 2015. Understanding aggregate human mobility patterns using passive mobile phone location data: a home-based approach. Transportation, 42(4), pp.625–
646. Available at: http://dx.doi.org/10.1007/s11116-015-9597-y.
Zhang, Y. & Chai, Y., 2011. The Spatio-temporal Activity Pattern of the Middle and the Low-income Residents in Beijing, China. Scientia Geographica Sinica, 31(9), pp.1056–1064.
Zhang, Y., Chai, Y. & Guo, W., 2014. Community
Differentiation of Residents’ Daily Activity Spaces in Beijing City. Areal Research and Development, 33(5), pp.65–71.
Zhou, S. & Deng, L., 2010. Spatio-temporal Pattern of Residents’ Daily Activities Based on T-GIS: A Case Study in Guangzhou, China ZHOU. ACTA