2D EVOLUTION PATTERN AND 3D RECONSTRUCTION OF TWO
LARGE RIFTS IN FILCHNER ICE SHELF FROM SATELLITE IMAGES
H. Xiaoa, b S. Liua, b* R. Lia, b* X. Tonga, b
a College of Surveying and Geo-Informatics, Tongji University, 1239 Siping Road, Shanghai, China
b Center for Spatial Information Science and Sustainable Development, Tongji University, 1239 Siping Road, Shnghai, China
[email protected]; (liusjtj, rli, xhtong)@tongji.edu.cn
Commission III, WG III/9
KEY WORDS: Rifts, ZY-3, Filchner Ice Shelf, Calving, Antarctica
ABSTRACT:
The floating ice shelves surrounding the Antarctic Ice Sheet is important for the stability of the grounded ice-sheet. Fracturing and calving event of an ice shelf can damage the structural integrity and contributes to an increase in ice discharge to the ocean. In this study, we focus on two large newly-developed traverse rifts in the frontal region of Filchner Ice Shelf which may lead to next major calving in the region. Two-dimensional evolution of the two rifts were investigated in detail using multisource remote sensing data, Two abrupt extensions in 2006 and 2011 were found with a rate of more than 1 km d-1. Moreover, a stereo pair of ZY-3 images was utilized for the first time to reconstruct the 3D rift model where an average rift depth of 48 m and ice mélange rise of ~10 m were measured.
1. INTRODUCTION
Mass loss from Antarctic Ice Sheet occurs primarily through its ice shelves by basal melting and iceberg calving with the latter one accounting for nearly half (Rignot et al., 2013). Fracturing processes which represent the crux of the calving process can weaken the retarding and stabilizing force of the floating ice shelves exerted on the inland ice sheet, contributing to more efficient ice drainage of the tributary glaciers and hence a rising global sea level (De Angelis and Skvarca., 2003).
The precursor to iceberg calving is large fractures called rifts which are defined as cracks with a visible opening, usually oriented at right angles to the flow direction (Holt et al., 2013). Rifts are important because the spacing of them strongly determines the dimensions of individual icebergs, as well as the frequency and magnitude of iceberg calving events (Glasser et al., 2009). Rifts are typically filled with a collection of different ice types called ice mélange which have been suggested to play an important role in controlling rift propagation rates (Bassis et al., 2005; Larour et al., 2014). Thus, the important role of the ice mélange necessitates the investigation of rift depth (or rift bottom elevation which is approximately the proxy for mélange thickness). However, field expeditions are hampered by the remote location of large rifts and the often dangerous environment associated with snow-bridged surface crevasses. So far, depth retrieval of rifts is mainly based on spaceborne and airborne altimetry or airborne stereo image pairs (Fricker et al., 2005; Massom et al., 2015). In recent years, the availability of high resolution orbital stereo images like Chinese ZY-3 has provided possibilities for accurate terrain elevation extraction and their potential for 3D reconstruction of large ice rifts is promising and should be well exploited (Tang et al., 2015).
The ZY-3 satellite carries three panchromatic cameras which acquire three along-track stereo images with a time interval of
*Corresponding author
~29 s, avoiding radiometric variation in images caused by temporal change and sun elevation difference. The ground sampling distances of the forward, nadir and backward images are 3.5 m, 2.1 m and 3.5 m, respectively. An accuracy of 10.8 m (horizontal) and 6.1 m (vertical) can be achieved without GCPs (Tang et al., 2015).
2. STUDY AREA
Filchner Ice Shelf (FIS) is a part of the Ronne-Filchner Ice Shelf with a total area of about 104253 km2. The last major calving event in FIS took place in mid-April of 1986 and resulted an area loss of ~11500 km2, which was broken into three large tabular icebergs inflicted by the Grand Chasm (Neuburg et al., 1959). The volume of the mass loss was estimated as 4850 km3, about 40 times the average annual discharge along the front of FIS (Ferrigno and Gould., 1987).
Special attention should be paid to two large and newly-developed transverse-to-flow rifts (referred to as Rift 1 and Rift 2 hereinafter) in central FIS front. Rift 1 was also reported as a rift feature “F6” interpreted from MODIS images acquired in 2011 by Walker et al. (2013), without parameters such as length and change rate that were available for other ice shelf features reported.Rifts 1 and 2 were about 72 km from the FIS front in 2013. Despite the ~7.5 km offset between Rift 1 and Rift 2, the two rifts have the potential to coalesce in future and may eventually lead to a major calving event similar to the calving event in 1986 (Ferrigno and Gould., 1987), and the expected area to calve off is a tremendous 12000 km2.
Therefore, the purposes of this research include (1) to investigate the 2D propagation of Rift 1 and Rift 2, and (2) to 3D reconstruct Rift 1’s geometry using a stereo pair of ZY-3 images.
The International Archives of the Photogrammetry, Remote Sensing and Spatial Information Sciences, Volume XLII-2/W7, 2017 ISPRS Geospatial Week 2017, 18–22 September 2017, Wuhan, China
This contribution has been peer-reviewed.
3. DATASETS
The data used for 2D propagation interpretation included Landsat ETM+, OLI L1GT images at 15m spatial resolution and ASTER L1T images with resolution of 15 m (2001-2016). Besides, nine scenes of Envisat ASAR images acquired in 2006 after being geocoded and filtered were also used.
In addition, Chinese ZY-3 images were used for 3D reconstruction of Rift 1. The ZY-3 satellite was first time programmed on February of 2014 to adjust its sensor parameters to the Antarctic setting and collected a set of Antarctic stereo images for a number of selected sites, including a stereo pair on 28th February 2014 in this specific study area. These images are referred to as the sensor-corrected (SC) product which involves radiometric correction and sub-CCD mosaicking.
4. METHODOLOGY 4.1 2D Evolution Analysis of the Rifts
Two parameters including length and width of the rifts are measured. The length is measured between two ends along the rift. The width is measured at different profiles as it propagated towards the ice shelf front. The widths and lengths of the rifts in images acquired at different times are measured to reveal the rifts’ two-dimensional evolution pattern.
4.2 3D Reconstruction of the Rift Geometry
Due to the low-contrast and flat topography of the ice shelf surface, image de-noising and enhancement are conducted beforehand to depress noise and improve contrast gradient. In this research, haze removement, CLAHE (Contrast Limited Adaptive Histogram Equalization), histogram matching, wiener filter and wallis adaptive filter are sequentially applied to the ZY-3 stereo imagery (Fahnestock and Schowengerdt., 1983; Lim, 1990; Zuiderveld, 1994).
All overlapping ZY-3 images (forward, nadir and afterward) are used for bundle adjustment (BA) with affine models to correct the relative geometric bias, and then the estimated parameters are employed to calculate the ground coordinates (Li, 1998; Tong et al., 2010). Tie points are uniformly distributed in the area for a better BA performance. After that a stereo pair can be formed by using a combination of either forward-nadir or nadir-aft images with a smaller intersection angle of 23.5o to ensure that the rift mélange floor is visible in both images. The adaptive Automatic Terrain Extraction (aATE) module in ERDAS 2013 LPS is used for DEM (Digital Elevation Model) derivation, which performs a coarse-to-fine hierarchical matching process.
The generated DEM can be used to estimate a set of key parameters of the rifts, including depth, width, shape of the walls, mélange floor topography, and others, to improve the physical models of ice shelves and support ice shelf stability analysis.
5. RESULTS 5.1 2D Evolution Pattern of Rift 1 and Rift 2
As to the rifts’ elongations, Rift 1 and Rift 2 both experienced a sudden bilateral burst. The length of Rift 1 increased dramatically from ~6.5 km to ~39.5 km between 16th April 2006 and 8th May 2006 within less than 23 days, corresponding to a propagation rate of more than 1.4 km d-1. Similarly, Rift 2 grew at a rate of 1.1 km d-1 from ~11.1 km on 13th January 2011 to ~27.4 km on 6th February 2011. After the sudden bursts, the rifts slowly grew
to the positions where they were well constrained at both ends. By contrast, both of the two rifts were widening at an average steady rate of ~100 m a-1. During the observation period, the maximum widths have already exceeded 1900 and 1800 m for rifts 1 and 2 respectively.
5.2 3D Model of Rift 1
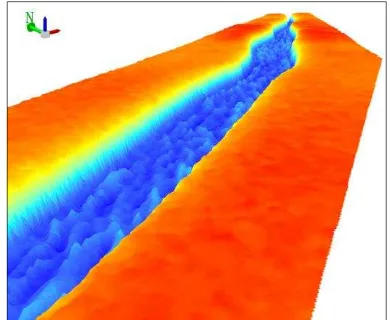
The derived ZY-3 DEM of Rift 1 is color-coded and shown in Fig. 1. 3D view of the ice rift wall and mélange inside can be seen in Fig. 2. The correlation coefficients of the matching process have a mean of 0.46 and 0.74 for ice shelf surface and ice rift area respectively with a standard deviation of 0.09. Matching residuals by comparing to manual results are below 0.8 pixels for both of the ice shelf surface and the ice rift area. Well-marked features like longitudinal flow lines, ice mélange and rift wall topography can be clearly derived from the DEM product.
Fig. 1. Derived ZY-3 DEM of Rift 1 with color-coded elevations. Three traverse profiles across the rift and a centerline along the rift are shown as black lines.
Mean width, depth and bottom elevation of the rift along with other key parameters were plotted against the distance along the centerline of the rift from the derived ZY-3 DEM. A specific measurement at a location is calculated by an average of the corresponding elevations over a transit line across the centerline. The rift surface is relatively flat with an average elevation of 72 m. The average rift floor depth is 48 m.
Fig. 2. 3D view of the rift (depth exaggeration 10 times).
The International Archives of the Photogrammetry, Remote Sensing and Spatial Information Sciences, Volume XLII-2/W7, 2017 ISPRS Geospatial Week 2017, 18–22 September 2017, Wuhan, China
This contribution has been peer-reviewed.
The maximum width of the rift reached ~1300 m and gradually decrease as it approaches to the rift’s tips. While the depth of the rift is about 40 m at its westernmost part and about 50 m at the central and eastern part. Three traverse elevation profiles across the rift were drawn to gain an insight into the depth of the rift (see Fig. 1 for location).
6. CONCLUSIONS
Two newly-developed large traverse rifts (Rift 1 and Rift 2) with length of more than 50 km are investigated in detail. Rift 1 had an abrupt change in 2006 with a propagation rate of more than 1.4 km d-1 and Rift 2 had a similar event five years later in 2011 with an extending rate of 1.1 km d-1. Both of them were widening at an average rate of ~100 m a-1 over the entire observation period. A reconstructed 3D model Rift 1 from ZY-3 images shows that the rift was 48 m deep on average in 2014. Continuous monitoring of the two rifts is needed in the future to better understand the calving mechanism in this region.
ACKNOWLEDGES
This work has been supported by National Key Basic Research Program of China (No. 2012CB957701). We also thank USGS and for providing the Landsat and ASTER datasets and ESA for Envisat ASAR images.
REFERENCES
Bassis, J. N., Coleman, R., Fricker, H. A., Minster, J. B., 2005. Episodic propagation of a rift on the Amery ice shelf, East Antarctica. Geophysical Research Letters, 32(6), 347-354.
De Angelis, H., Skvarca, P., 2003. Glacier surge after ice shelf collapse. Science, 299(5612), 1560-1562.
Fahnestock, J. D., Schowengerdt, R. A., 1983. Spatially variant contrast enhancement using local range modification. Optical Engineering, 22(3), 378-381.
Ferrigno, J. G., Gould, W. G., 1987. Substantial changes in the coastline of Antarctica revealed by satellite imagery. Polar Record, 23(146), 577-583.
Fricker, H. A., Bassis, J. N., Minster, B., Macayeal, D. R., 2005. ICEsat's new perspective on ice shelf rifts: The vertical dimension. Geophysical Research Letters, 32(23), 23-8.
Glasser, N. F., Kulessa, B., Luckman, A., Jansen, D., King, E. C., Sammonds, P. R., Scambos, T. A., Jezek, K. C., 2009. Surface structure and stability of the Larsen C ice shelf, Antarctic Peninsula. Journal of Glaciology, 55(191), 400-410(11).
Holt, T. O., Glasser, N. F., Quincey, D. J., Siegfried, M. R., 2013. Speedup and fracturing of George VI Ice Shelf, Antarctic Peninsula. The Cryosphere, 7(3), 797-816.
Larour, E., Khazendar, A., Borstad, C. P., Seroussi, H., Morlighem, M., Rignot, E., 2014. Representation of sharp rifts and faults mechanics in modeling ice shelf flow dynamics: Application to Brunt/Stancomb-Wills ice shelf, Antarctica.
Journal of Geophysical Research Earth Surface, 119(9), 1918– 1935.
Li, R. 1998. Potential of High-resolution Satellite Imagery for National Mapping Products. Journal of Photogrammetric Engineering and Remote Sensing, Vol.64, No.12, pp.1165-1169.
Lim, J. S., 1990. Two-dimensional signal and image processing. Prentice Hall.
Massom, R. A., Giles, A. B., Warner, R. C., Fricker, H. A., Legrésy, B., Hyland, G., Young, N., Fraser, A. D., 2015. External influences on the Mertz Glacier Tongue (East Antarctica) in the decade leading up to its calving in 2010. Journal of Geophysical Research Earth Surface, 120(3), 490-506(17).
Neuburg, H. A. C., Thiel, E., Walker, P. T., Behrendt, J. C., Aughenbaugh, N. B., 1959. The Filchner Ice Shelf. Annals of the Association of American Geographers, 49(2), 110-119.
Rignot, E., Jacobs, S., Mouginot, J., Scheuchl, B., 2013. Ice-shelf melting around Antarctica. Science, 341(6143), 266-70.
Tang, X., Zhou, P., Zhang, G., Wang, X., Jiang, Y., & Guo, L., Liu, S., 2015. Verification of ZY-3 satellite imagery geometric accuracy without ground control points. IEEE Geoscience & Remote Sensing Letters, 12(10), 1-5.
Tong, X., Liu, S., Weng, Q., 2010. Bias-corrected rational polynomial coefficients for high accuracy geo-positioning of QuickBird stereo imagery. ISPRS Journal of Photogrammetry & Remote Sensing, 65(2), 218-226.
Walker, C. C., Bassis, J. N., Fricker, H. A., Czerwinski, R. J., 2013. Structural and environmental controls on Antarctic ice shelf rift propagation inferred from satellite monitoring. Journal of Geophysical Research Earth Surface, 118(4), 2354-2364.
Zuiderveld, K., 1994. Contrast limited adaptive histogram equalization. Graphics Gems, 474-485.
The International Archives of the Photogrammetry, Remote Sensing and Spatial Information Sciences, Volume XLII-2/W7, 2017 ISPRS Geospatial Week 2017, 18–22 September 2017, Wuhan, China
This contribution has been peer-reviewed.