THE BENEFIT OF HYDRODYNAMIC MODEL AS AN ASSESSMENT OF THE
HYDRO-ENVIRONMENT ENGINEERING IN DECISION SUPPORT SYSTEM FOR THE
SUSTAINABLE MARICULTURE DEVELOPMENT IN INDONESIA
SURYA HERMAWAN
Civil Engineering Department Petra Christian University, Surabaya, Indonesia, shermawan@petra.ac.id
DANIEL TJANDRA
Civil Engineering Department Petra Christian University, Surabaya, Indonesia, danieltj @petra.ac.id
JOKO PURNOMON
Civil Engineering Department Petra Christian University, Surabaya, Indonesia, jpurnomo@petra.ac.id
ABSTRACT
Indonesia has a great potential for developing the mariculture industry. However, during the operation faced a lot of problems due to hydrodynamic environment engineering fields. The main case was the misplaced location of the mariculture development with respect to the weak sea current in the vicinity area. Meanwhile, the accomplishment of sustainable practices and management systems to preserve coastal environments is still in its infancy.At this manuscript, the assessment utilize 2-dimensional numerical models in Decision Support System at the Ekas Bay for the developoment floating net cage grouper mariculture in Lombok, Indonesia. Simulations were carried out by applying the open source of Delft3D modeling system which was fully integrated with modeling framework for the simulation, among others of flow and waves. The significant results of this investigation with respect to physical characteristics of the marine environment of Ekas Bay show that the current magnitude can generally be categorized as weak. A current speed of less than 0.05 m/s is of course too weak to cover the minimum requirement for the flushing of a mariculture farm, and provides a possible explanation for previous business failures in the region. The results of applying Decision Support System showed that this area is not an appropriate location for future floating net cage grouper mariculture development considering its physical characteristics including current speed and wave height. These outcomes prove that hydrodynamic model can be used as an initial assessment for decision maker for future development of sustainable mariculture industry in Indonesia.
Keywords: hydrodynamic model, mariculture, assessment, decision support system, Indonesia
1. INTRODUCTION
Regarding the code of conduct on responsible fisheries issued by the Food and Agriculture Organization of the United Nations (FAO, 2011), the new perspective goal of mariculture development is to ensure ecological sustainability in conjunction with a rational use of the resources shared by mariculture and other activities. As the second largest archipelagic state in the world with about 81,000 km of coastline, corresponding to approximately 14% of the world's coastlines, Indonesia has a great potential for developing the mariculture industry and known as the largest aquaculture producer of marine finfish in Southeast Asia (De Silva and Philips, 2007; Ministry of Marine Affairs and Fisheries, 2009). The expansion of the mariculture and fishery sector is expected to improve the country's welfare, especially for fishermen and fish farmers that are currently living under the poverty level.
However, during the operation faced a lot of problems due to hydrodynamic environment engineering fields. The main case was the misplaced location of the mariculture development with respect to the weak sea current in the vicinity area. Meanwhile, the accomplishment of sustainable practices and management systems to preserve coastal environments is still in its infancy. Therefore, it is vital to improve aquaculture technology and to develop management tools. This problem can be determined by an implementation of the numeric mathematical model of the sea current flow which illustrates the physical process of domain area.
grouper cultures is affected by constraints in policy, resources, institutions, socio-economic factors, technology and finance (Sugama, 2010). Farhan and Lim (2010) recommended the use of Decision Support Systems (DSS) to meet the flexibility of dynamic environments. Such systems can be used to cope with the complexity of coastal management issues, and support decision-makers in the integration of socio-economic and bio-geophysical properties of the environments and in political decisions. Several authors emphasize the need for the continuing development of planning tools for the management of mariculture activities using an integration of Geographic Information Systems (GIS), field measurements and results of the application of numerical models (Silvert, 1994, 2010; Mayerle& Windupranata, 2006 ; Martinez et al. 2008; Longdill et al. 2008; Boroushaki, 2008; Kapetsky, Manjarrez, Soto, 2007; Szutser, 2010; Van der Wulp et al. 2010; Mayerle et al. 2011; Hermawan et al. 2012).
In this manuscript, the hydrodynamic model is used as warming up model for the simulation at North coast Java which is funded by Directorate General of Higher Education Indonesia in 2018. The application of a DSS under development at the Research and Technology Centre West coast of the University of Kiel Germany for the sustainable environmental and socio-economic management of floating net cage is assessed.
2. MATERIAL AND METHOD
2.1 STUDI AREA
The investigations carried out at Ekas Bay (8o55’N 116o25E) which was located south of the Lombok Island,
Southwest Kabupaten (Regency) Lombok Timur, Sub district Jerowaru. The total area of the bay was 5,640 hectares, but only 3,400 hectares with potential for mariculture (CCMRS-IPB, 2004; Wibowo, 2007). The remaining areas of about 1,900 hectares are shallow or dry during low tide (CCMRS-IPB, 2004; Wibowo, 2007). Ekas Bay has a tropical climate. The average amount of rainfall is 1,882 mm/year within 15 rainy days per month. This area is generally influenced by westerly and easterly winds. At peak strength between June and September the wind blows from the east with a maximum speed of 7.7 m/s.
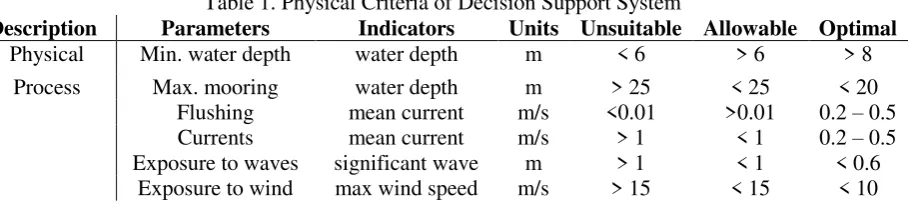
The bathymetry of coastal water of the Eastern Lombok Regency is categorized into near shore coastal areas and steep coastal ramps. This bay lies north to south with a narrow width at the southern part of the bay. This part is a barrier to protect energy which comes inside the bay (see Figure 1). According to measurements from CCMRS-IPB (2004), the water depth ranges between 0 and 70 m where shallow areas are mostly found in the northern part of the bay. As can be seen in Figure 1, the surrounding coastal areas in the vicinity of Ekas Bay mostly have depths of less than 10 m at the eastern, northern and western parts of Ekas Bay. Regarding the CCMRS-IPB (2004) survey, the depth at the northern part was about 0 – 37m. In the middle region, there was crevice/cranny between 26 to 37 m. Meanwhile, the west coast bathymetry was more slightly sloping than the east coast. At the narrow part of Ekas Bay, there were 3 troughs of about 43 m to 56 m.
As can be seen in Table 1, the information required for the development floating net cages (FNC) grouper mariculture of the models and application of the DSS was collected from existing data, several projects, government agencies, published data, and from numerical model simulations. Physical criteria properties of seawater were taken from global model data. Current velocities and waves were taken from model simulations (see Table 1).
Table 1. Physical Criteria of Decision Support System
Description Parameters Indicators Units Unsuitable Allowable Optimal
Physical Min. water depth water depth m < 6 > 6 > 8
Flow models were developed to simulate water levels and current velocities in Ekas Bay. Simulations were carried out with the two-dimensional depth integrated model developed by Delft Hydraulics in Netherlands (WL|DELFT HYDRAULICS, 2009).The hydrodynamic and wave models require bathymetric data along near shore areas in Indonesia which is usually obtained from nautical charts issued by the Badan Koordinasi Survey dan Pemetaan Nasional (National Coordinating Agency for Survey and Mapping). GEBCO (General Bathymetric Chart of the Oceans) data is issued by the British Oceanographic Data Centre, U.K (IOC/IHO/BODC, 2003). It is usually adopted to provide information in deeper areas. For tidal variations and wind characteristics for diving, the numerical models are extracted from Total Modal Driver (see Egbert and Erofeeva, 2002). The wind data is obtained from the NCEP/NCAR reanalysis database (NOAA/OAR/ESRLPSD, 2009).
2.2.2 Domain Decomposition
Domain decomposition was used in the development of the regional models. The approach implemented in Delft3D-Flow is based on a subdivision of the domain decomposition into non-overlapping domains, with the possibility for grid refinement in both the horizontal and vertical direction (WL|DELFT HYDRAULICS, 2009).
2.2.3 Nesting Sequences and Local Models
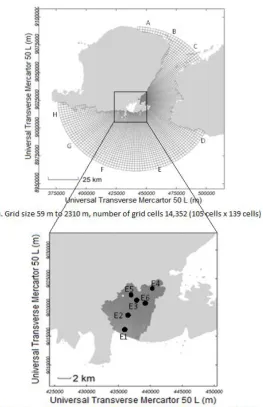
Nesting sequences were set up in order to provide adequate open sea boundary conditions for Ekas Bay sites. The bathymetry of the models was obtained from several sources. In the near-shore area, nautical charts was digitized. In the deeper regions, depths were taken from GEBCO online database. Astronomical tides derived from the global ocean tide model TPXO 6.2. were imposed along the open sea boundaries of the large-scale models. In this study, thirteen harmonic components (M2, S2, N2, K2, K1, O1, P1, Q1, MF, MM, M4, MS4, and MN4) were used to drive the models. Due to the large extensions of the open sea boundaries, several segments were considered. In order to determine the appropriate set-up for local models, sensitivity investigations with respect to time steps and bed roughness were carried out. The resulting nesting sequences for the domains in questions are shown in Figure 2.
The DD grid development in the Ekas Bay model is shown in Figure 2. Only two models were considered. The regional model of Ekas Bay comprises 14,352 grid cells (105 cells x 139 cells) with grid spacing ranging from 59 m to 2310 m. The grid of the local model is constructed with sizes varying between 17 m and 145 m, and 23,200 cells (181 cells x 130 cells). There are 6 observation points (E1, E2, E3, E4, E5, and E6) allocated to the local model. Attention was given to the conditions at observation points E1 and E3.
2.3 Wave Models
efficient representation of complex areas. The wave models developed in this study adopt grids which are coarser than the ones used in the flow model simulations.
Figure 2: Ekas Bay Nesting Sequence: Large Scale and Regional Models
The wave models for Ekas Bay were carried out for six-hourly wind analysis data from the NCEP database in the period 2005 – 2009. Thus, the identification of the wind events regarding wave model results in the Ekas Bay regional model is shown in Figure 3. Figure 3 visualizes wind rose and wind class generation in the sea surrounding Ekas Bay. It shows 64% are in the range of 1 – 6 m/s, and the major wind directions are south and southwest (38.3% and 32.1% of the wind directions respectively). It shows the Ekas Bay area is in the category of moderate breeze (5.5 – 7.9 m/s) with respect to the Beaufort scale, only 1.1 % of wind data shows wind speeds above 12 m/s. Maximum wind velocity over this period is 19.6 m/s and the direction 206o.
3. RESULTS
3.1 FLOW AND WAVE
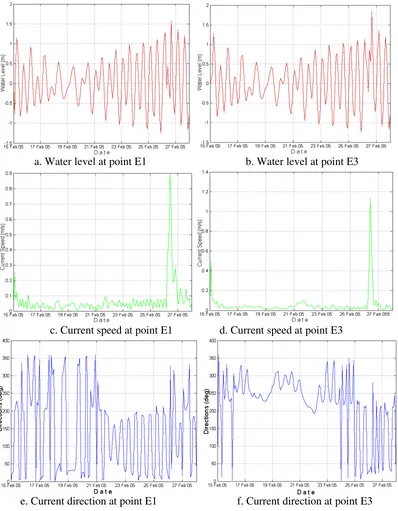
The results of numerical simulation in the Ekas Bay study area are provided in Figure 4 and Figure 5. Simulated oscillations of water levels at two observation points are in the range 0.2 – 2.6 m which covers neap to spring flood and ebb condition. The present findings seem to be consistent with results by CCMRS-IPB (2004) which found that the maximum fluctuation of water level in the vicinity Ekas Bay was 2.6 m. However, the current speed estimation at the two observation points shows that the current characteristics at E1 and E3 are different. We find an extreme current speed of 0.9 m/s and 1.1 m/s, respectively at E1 and E3 which coincides with maximum wind speed. In general, the current magnitude shows a discrepancy of between 0.08 – 0.1 m/s (see Figure 4c and Figure 4d). This result therefore needs to be interpreted with caution, because while it is in agreement with CCMRS-IPB (2004) which revealed that the current speed was about 0.10 m/s during September – December, from April to August the current velocities were in the range 0.05 – 0.40 m/s.
a. Water level at point E1 b. Water level at point E3
c. Current speed at point E1 d. Current speed at point E3
e. Current direction at point E1 f. Current direction at point E3
Height of wave at observation point E1 Figure 5: Wave model results in the vicinity of Ekas Bay
As can be seen in Figure 5, the simulated wave height results at Ekas Bay covering a period of five years show that the maximum value is higher than 2 m. The average of wave heights are in the range of 0.5 – 1 m (see Figure 5). This findings support previous literature by Wibowo (2007). The significant results of this investigation with respect to physical characteristics of the marine environment of Ekas Bay show that the current magnitude can generally be categorized as weak. A current speed of less than 0.05 m/s is of course too weak to cover the minimum requirement for the flushing of a FNC farm, and provides a possible explanation for previous business failures in the region. In contrast, during extreme wind conditions it provides very high magnitudes. Maximum heights of wave and wind criteria do not suit the development of FNC grouper culture. These findings have significant implications for the future practice of FNC grouper culture development in this area.
3.2 DECISION SUPPORT SYSTEM
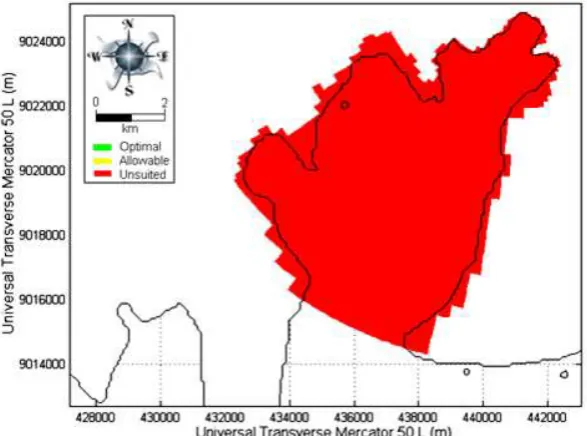
In order to assess the results of hydrodynamic flow and wave models with respect to the criteria of FNC grouper mariculture development in Decision Support System, we conclude that Ekas Bay is generally categorized as too weak, while maximum wave height and wind criteria do not meet the criteria for the development of FNC grouper culture. The result, as shown in Figure 6, indicates that the suitabiliy map in the vicinity of Ekas Bay based on exposure to currents presents the domain as unsuited area. The current speed characteristic in this area can be compared to Figure 4c and 4d.
4. DISCUSSION AND CONCLUSION
4.1 DISCUSSION
The system has been successfully applied to several coastal areas in Indonesia. Applications were done to sites in the Seribu Islands in the Java Sea and in Batam in the Riau Archipelago, Pegametan Bay and Celukanbawang in Bali and Saleh Bay in Lombok. Extensive measurements and monitoring programs were done in the Pegametan Bay, Bali in cooperation with experts of the Gondol Research Institute for Mariculture, Indonesia (van der Wulp et al. 2010, Mayerle et al. 2011).
In order to analyze Ekas Bay, the results of applying SYSMAR DSS showed that this area is not an appropriate location for future FNC grouper culture development considering its physical characteristics including current speed and wave height. This finding confirms bathymetry information taken from Indonesian nautical chart no. 262 which confirms that the location of fish farms there is inappropriate. Meanwhile, Krisanti and Imran (2006) revealed that there were 52 FNC located at Awang village (western part of Ekas Bay). Their analysis showed that the carrying capacity of these FNC culture was exceeded. They concluded that the number of cages (farm scales) in this region should be limited because this activity contributed to waste disposal into sea water in this region. This finding was anticipated by Aslianti (2002), who detected diseases in grouper cultures in Ekas bay. Thus, in order to provide other sources of income, other cultures including seaweed, which does not add waste, and increasing sustainability of aquaculture should be introduced and applied.
On the other hand, the suggestion to stop the activities of this culture means most fisherman would lose their income (Krisanti and Imran, 2006). There are two villages which contribute to grouper culture, lobster and pomfret fish in this area including Awang village on the west side and Ekas village on the east side. About 50% of fishing households in Awang village are now involved, part or fulltime in lobster and grouper culture (Pet et al. 2012) with the MMAF promotes East Lombok, including Ekas Bay, as a blue economy zone of marine industry towards a sustainable marine and fisheries development for the prosperity of the Indonesian citizens (Sunoto, 2014, 2012). However since 2009, there is no data about the extent of grouper production in this area except Sunoto (2014, 2012) who reported 12.6 tons. On the other hand, according to Directorate of Aquaculture Statistic MMAF (2013), the production of grouper in this province was increasing from 2008 to 2012.
4.2 CONCLUSION
The use and implementation of a DSS for sustainable aquaculture development in Indonesia, with respect to the EAA concept which was introduced by FAO in 2010, is very complex and a number of concerns should be taken into account. We find that the hydrodynamic models prove can be used as an assessment tools for future development mariculture in Indonesia.
ACKNOWLEDGEMENTS
The Author gratefully acknowledges the support and generosity of the Directorate General of Higher Education, Ministry of Education and Culture of Indonesia (DGHE) at scheme PTUPT, The Centre for International Migration and Development (CIM), and the Deutsche Gesellschaft für Internationale Zusammenarbeit (GIZ). the German Academic Exchange Service or Deutsche Akademische Austauschdienst (DAAD), the Research and Technology Center Büsum / Forschungs-und Technologiezentrum Westküste (FTZ) – Büsum and the International Center, Career Center of Christian-Albrechts-University in Kiel Germany.
REFERENCES
Aslianti, T., Slamet, B., Prasetya, G.S., (2002). Application of Humpback Grouper Culture, Cromoliptes altivelis at Ekas Bay, East Lombok Regency. In Indonesian Language. Balai Besar Riset Budidaya Laut Gondol PO BOX 140. Singaraja 81101 Bali, Badan Riset Kelautan dan Perikanan, Jakarta.
Bakosurtanal (Badan Koordinasi Survey dan Pemetaan Nasional)., (2011). National Coordinator for Survey and Mapping Agency, Indonesia. Nautical chart number 42, 262, and 334.
Boroushaki, S., Malczewski, J., (2008). Implementing An Extension Of The Analytical Hierarchy Process Using Ordered Weighted Averaging Operators With Fuzzy Quantifiers In Arcgis, Computers &Geoscience 34: 399-410.
CCMRS – IPB., (2004). Center for Coastal and Marine Resources Studies (CCMRS-IPB), PKSPL IPB (Pusat Kajian
De Silva, S.S., Phillips, M.J., (2007). A Review of Cage Aquaculture: Asia (excluding China).in Halwart, M., Soto, D., Arthur, J.R., Cage Aquaculture – Regional Reviews and Global Overview. FAO Fisheries Technical Paper No. 498: 18–48.
Egbert, G, D., Erofeeva, S, Y., (2002). Efficient Inverse Modeling of Barotropic Ocean Tides, J. Atmos. Tide extracted from Total Model Driver . Oceanic Technol.19(2):183-204.
http://www.esr.org/polar_tide_models/Model_TPXO62.html#EgbertErofeeva_2002.
FAO., (2011). Code of Conduct for Responsible Fisheries. Food and Agriculture Organization of The United Nations, Rome, 2011 http://www.fao.org/docrep/013/i1900e/i1900e.pdf
Farhan, A.R., Lim, S., (2013). Improving Vulnerability Assessment Towards Integrated Coastal Zone Management (ICZM): A Case Study of Small Islands in Indonesia. Coast Conserv 17 : 351 – 367.
Holthuijsen, LH & Booij, N (2007).Experimental wave breaking in Swan.In J Mckee Smith (Ed.), Proceedings of the 30th International Conference Coastal Engineering, San Diego, USA (pp. 392-402). Singapore: World Scientific Publishing Co. Pte.Ltd..
IOC/IHO/BODC.(2003). General Bathymetric Chart of the Oceans.British Oceanographic Data Centre, Liverpool, U.K.http://www.gebco.net/data_and_products/gebco_digital_atlas/.
Kapetsky, J.M., Aguilar-Manjarrez, J., (2007). Geographic Information Systems, Remote Sensing and Mapping for The Development and Management of Marine Aquaculture. Rome: FAO Fisheries and Aquaculture Department. 141pp
Krisanti, M., Zulhamsyah, I., (2006).Carrying Capacity of Ekas Bay for Floating Net cages Grouper Culture Activity in Ekas Bay. In Indonesian Language.Journal Pertanian Indonesia 11(2).
Longdill, P.C., Healy, T.R., Black, K.P., (2008). An Integrated GIS Approach for Sustainable Aquaculture Management Area Site Selection, Ocean & Coastal Management Vol. 51: 612 - 624.
Martínez, O.P., 2002. GIS-based models for optimisation of marine cage aquaculture in Tenerife, Canary Islands.Institute of Aquaculture, University of Stirling, Scotland. 336 pp. (Ph.D. thesis) http://www.aquaculture.stir.ac.uk/GISAP/Projects/Oscar.htm
http://www.aquaculture.stir.ac.uk/GISAP/Projects/Wastes.htm
Mayerle, R., Windupranata, W. (2006). A Decision Support System for the Sustainable Environmental Management of Marine Fish Farming.Second International Symposium on Cage Aquaculture Asia (CAA2), Hangzhou, China.
Ministry of marine affairs and fisheries (MMAF) Indonesia., (2009). Indonesian Fisheries Book 2009. 84pp.
Ministry of marine affairs and fisheries (MMAF) Indonesia., (2013). Information price of Grouper in June 2013.In Indonesian Language. http://wartaekonomi.co.id/berita11314/budidaya-laut-peluang-usaha-berprospek-cerah.html
NOAA/OAR/ESRLPSD., (2009).NCEP/NCAR Reanalysis 2 data.http://www.cdc.noaa.gov/ Global six hourly reanalysis data with the resolution 1.87 degrees (192 x 94 grid) for wind and sea level pressure.
Ris, R.C. and L.H. Holthuijsen, 1997, Modelling of current induced wave-blockingin a spectral wave model, 8th International Biennal Conference on Physics of Estuaries and Coastal Seas, J. Dronkersand M.B.A.M. Scheffers (eds.), The Hague, 139-144.
Silvert, W.,(1994). A Decision Support System for Regulating Finfish Aquaculture.Ecological Modelling 75/76: 609-615.
Silvert, W., (2010).Decision Support for Stakeholders.Proceeding International environmental modelling and software society (iEmSs) 2010, Ottawa, Canada.
Sugama, K., (2010). Public Policy for Sustainable Development of Grouper Aquaculture in Indonesia.Directorate of Seed Development - Directorate General of Aquaculture Indonesia. 8 pp
Sunoto (2014, 2012).Towards a Sustainable Marine and Fisheries Development for the Prosperity of the Indonesia Citizen, Ministry Advisor of Ministry Marine Affairs and Fisheries.In Indonesian language.Presentation slide.41 pp. Szuster, W.B., Albasri, H., (2010). Site Selection for Grouper Mariculture in Indonesia, International Journal of Fisheries
and Aquaculture 2(3): 87-92.
Wulp, S.A, Van der., Niederndorfer, K.R., Hesse,K-J., Runte, K-H., Mayerle, R., Hanafi, A., (2010). Sustainable Environmental Management for Tropical Floating Net Cage Mariculture, A Modeling Approach, XVIIth World Congress of the International Commission of Agricultural Engineering (CIGR). Quebec City. Canada.
Wibowo, H. T., (2007). Nitrogent Contained and Mariculture Development in Ekas Bay. Thesis.In Indonesian Language.Institut Pertanian Bogor.Bogor Agricultural University Indonesia.60pp.