BEGINNING ARCGIS®
FOR DESKTOP DEVELOPMENT USING .NET
INTRODUCTION . . . xxi
⊲ PART I
THE BASICS
CHAPTER 1 Why Geospatial Is Special . . . 3CHAPTER 2 Introduction to ArcGIS for Desktop Applications Customization . . . 35
⊲ PART II
.NET PROGRAMMING FUNDAMENTALS
CHAPTER 3 .NET Programming Fundamentals, Part I . . . 63CHAPTER 4 .NET Programming Fundamentals, Part II . . . 103
⊲ PART III ARCOBJECTS PROGRAMMING
CHAPTER 5 Understanding ArcObjects Object Model Diagrams . . . 139CHAPTER 6 Accessing Maps and Layers . . . 165
CHAPTER 7 Working with Tables and FeatureClasses . . . 197
CHAPTER 8 Subsets of Records . . . 227
CHAPTER 9 Constructing and Using the Geometry of Features . . . 257
CHAPTER 10 Rendering Geospatial Data and Using Hyperlinks and MapTips . . . . 295
CHAPTER 11 Labeling, Exporting ActiveView, and Working with Elements . . . 327
CHAPTER 12 Geoprocessing with Tools and Models . . . 365
CHAPTER 13 Feature Data Management . . . 403
CHAPTER 14 Advanced Topics in ArcObjects Programming and Deployment . . . . 429
APPENDIX Answers to Chapter Exercises . . . 467
BEGINNING
ArcGIS
®
for Desktop Development
BEGINNING
ArcGIS
®
for Desktop Development
Using .NET
John Wiley & Sons Ltd, The Atrium, Southern Gate, Chichester, West Sussex, PO19 8SQ, United Kingdom
For details of our global editorial offi ces, for customer services and for information about how to apply for permission to reuse the copyright material in this book please see our website at www.wiley.com.
The right of the author to be identifi ed as the author of this work has been asserted in accordance with the Copyright, Designs and Patents Act 1988.
All rights reserved. No part of this publication may be reproduced, stored in a retrieval system, or transmitted, in any form or by any means, electronic, mechanical, photocopying, recording or otherwise, except as permitted by the UK Copyright, Designs and Patents Act 1988, without the prior permission of the publisher.
Wiley also publishes its books in a variety of electronic formats. Some content that appears in print may not be available in electronic books.
Designations used by companies to distinguish their products are often claimed as trademarks. All brand names and product names used in this book are trade names, service marks, trademarks or registered trademarks of their respective owners. The publisher is not associated with any product or vendor mentioned in this book. This publication is designed to provide accurate and authoritative information in regard to the subject matter covered. It is sold on the understanding that the publisher is not engaged in rendering professional services. If professional advice or other expert assistance is required, the services of a competent professional should be sought.
Limit of Liability/Disclaimer of Warranty: The publisher and the author make no representations or warranties with respect to the accuracy or completeness of the contents of this work and specifi cally disclaim all warranties, including without limitation warranties of fi tness for a particular purpose. No warranty may be created or extended by sales or promotional materials. The advice and strategies contained herein may not be suitable for every situation. This work is sold with the understanding that the publisher is not engaged in rendering legal, accounting, or other professional services. If professional assistance is required, the services of a competent professional person should be sought. Neither the publisher nor the author shall be liable for damages arising herefrom. The fact that an organization or Web site is referred to in this work as a citation and/or a potential source of further information does not mean that the author or the publisher endorses the information the organization or Web site may provide or recommendations it may make. Further, readers should be aware that Internet Web sites listed in this work may have changed or disappeared between when this work was written and when it is read.
Trademarks: Wiley, Wrox, the Wrox logo, Wrox Programmer to Programmer, and related trade dress are trademarks or registered trademarks of John Wiley & Sons, Inc. and/or its affi liates, in the United States and other countries, and may not be used without written permission. ArcGIS is a registered trademark of Esri in the United States and other countries. All other trademarks are the property of their respective owners. John Wiley & Sons, Ltd. is not associated with any product or vendor mentioned in this book.
A catalogue record for this book is available from the British Library. 978-1-118-44254-8 (paperback)
978-1-118-44253-1 (ebook) 978-1-118-44255-5 (ebook) 978-1-118-44252-4 (ebook)
To the best mother and father in the whole world, Nosratolah and Soghra
To the best wife in the solar system, Ana
ABOUT THE AUTHOR
POURIA AMIRIAN holds a Ph.D. in Geospatial Information Systems (GIS).
Dr. Amirian is a developer and GIS/IT lecturer with extensive experience developing and deploying small to large-scale Geospatial Information Systems. At the moment he is a research fellow of Strategic Research in Advanced Geotechnologies
VP CONSUMER AND TECHNOLOGY
PUBLISHING DIRECTOR
Michelle Leete
ASSOCIATE DIRECTOR—BOOK CONTENT MANAGEMENT
Martin Tribe
ASSOCIATE PUBLISHER
Chris Webb
ASSOCIATE COMMISSIONING EDITOR
Ellie Scott
ASSOCIATE MARKETING DIRECTOR
Louise Breinholt
MARKETING MANAGER
Lorna Mein
SENIOR MARKETING EXECUTIVE
Kate Parrett
EDITORIAL MANAGER
Jodi Jensen
SENIOR PROJECT EDITOR
Sara Shlaer
PROJECT EDITOR
Tom Dinse
TECHNICAL EDITOR
Alexey Tereshenkov
PRODUCTION EDITOR
Daniel Scribner
PROOFREADER
Louise Watson, Word One
INDEXER
John Sleeva
COVER DESIGNER
LeAndra Young
COVER IMAGE
©Anahid Basiri
ACKNOWLEDGMENTS
EVEN THOUGH THE AUTHOR’S NAME is the one that graces the cover of a book, no book is the result of one person’s efforts, and I’d like to thank a few of the people involved in this one. First and fore-most, thanks to John Wiley & Sons for giving me the opportunity to write and providing me such a brilliant team for publishing this book. They were the only people willing to take a risk on an unknown author for the fi rst book on GIS published by Wrox, and for that I will be forever grateful. Thanks to the staff of John Wiley & Sons — specifi cally Tom Dinse, Debbye Butler, Daniel Scribner and Louise Watson, whose watchful eyes saved me from potentially embarrassing mistakes. Thanks also to Chris Webb for getting me started with the book and Ellie Scott for keeping me on track. All of them did a great job of dealing with the frequent changes I made to the book as I was writing. I’d like to thank my technical editor, Alexy Treshenkov, whose efforts made this book far better than it would have been otherwise.
I’d also like to thank Dr. Adam Winstanley, head of the Department of Computer Science at the National University of Ireland, Maynooth (NUIM), Dr. Martin Charlton from the National Centre for Geocomputation (NCG) Ireland, and Dr. Jan Rigby, program manager of StratAG (Strategic Research in Advanced Geotechnologies).
My gratitude, also, to those who helped create the .NET Framework, ArcObjects, tools, APIs, libraries, standards, specifi cations and all the other fun stuff that helps bring the geospatial to the mainstream and make GIS development and programming exciting today.
I would like to thank everyone who bought this book! I sincerely hope you have as much fun read-ing it as I did writread-ing it, and I hope that you fi nd it to be worth your hard-earned money and that it proves to be an educational and eye-opening experience.
It is time for expressing my feelings that never can be told using words. I am the luckiest person in the whole world because I have the greatest parents. I want to thank them for countless reasons: for always listening patiently, for their constant support, and for always being by my side. Also, I am so grateful to my father- and mother-in-law for all they do for Ana and me. I owe my life to my wife; my unprecedented wife Dr. Anahid Basiri, who saved my life with her love, passion, and patience. In addition to being the fi rst reader of the book, Ana also took the photograph that is on the cover of this book. This is an image of the International Neuroscience Institute (INI).
CONTENTS
INTRODUCTION xxi
PART I: THE BASICS
CHAPTER 1: WHY GEOSPATIAL IS SPECIAL 3
A Tour of Geospatial Data
4
Why Geospatial Is Special
8
Various Kinds of GIS Software
10
Server GIS 11
Desktop GIS 13
Developer GIS 17
Mobile GIS 18
Geospatial Data Models and Storage
19
Raster 19 Vector 20
Geospatial Data as Text or Binary File 20
Geospatial Data in Georelational Models 21
Geospatial Data Inside Spatial DBMS 21
Geospatial Data in XML Structures 23
Esri Geodatabase
30
Personal Geodatabase 30
File Geodatabase 30
ArcSDE Geodatabase 31
Summary 32
CHAPTER 2: INTRODUCTION TO ARCGIS FOR
DESKTOP APPLICATIONS CUSTOMIZATION 35
Four Ways to Customize ArcGIS for Desktop
36
Customizing the User Interface
37
Scripting 41
Desktop Add-Ins
48
ArcObjects SDK
55
xvi
CHAPTER 3: .NET PROGRAMMING FUNDAMENTALS, PART I 63
The .NET Framework
63
The C# Language
64
A Brief History of C# 64
Basic Concepts 65
Variables and Data Types 66
Nullable Data Types 71
Operations on Variables 71
Arrays 75 Decision-Making 76 Iteration 78
Object Manipulation 81
Data Type Conversion 83
Enumerations 85 Methods 89
Introduction to Object-Oriented Programming in C#
93
Object-Oriented Programming in Action 94
Defi ning Properties 96
Defi ning Methods 98
Defi ning Constructors 98
Summary 100
CHAPTER 4: .NET PROGRAMMING FUNDAMENTALS, PART II 103
Overview of Object-Oriented Programming Concepts
104
Abstraction 104 Encapsulation 104 Inheritance 105 Polymorphism 106Reference Types and Value Types
108
Assignment Operations 108
Comparison Operations 109
Passing Parameters between Method Calls 109
Brief Explanation of All .NET Types
111
Namespaces and Assemblies
112
Debugging Using Visual Studio
113
Structured Exception Handling
117
Casting Objects
120
CONTENTS
The ArrayList 122
Generics 123
Reading and Writing Files
123
Summary 135
PART III: ARCOBJECTS PROGRAMMING
CHAPTER 5: UNDERSTANDING ARCOBJECTS OBJECT MODEL
DIAGRAMS 139
What Is ArcObjects?
140
Interface-Based Programming in Brief
140
Understanding Object Model Diagrams
144
Types of Classes in ArcObjects 145
Relationships between Classes 147
Members of Interfaces 149
Interface Inheritance 151
Wormhole 153
Additional Tips for Using Object Model Diagrams 153
Where to Start with ArcObjects 155
How to Find an Associated Member 156
Summary 163
CHAPTER 6: ACCESSING MAPS AND LAYERS 165
Introduction to Maps and Layers In ArcObjects
165
General Properties of All Layers
175
Working with FeatureLayers
179
Working with RasterLayers
183
Adding an Existing *.lyr File to a Map
184
Adding *.lyr Files Using GxDialog
186
Saving *.lyr and *.mxd Files
191
Summary 194
CHAPTER 7: WORKING WITH TABLES AND FEATURECLASSES 197
Accessing Tables and FeatureClasses
197
Adding and Deleting Fields 204
Adding Existing FeatureClasses, Tables, and Rasters to a Map 207 Deleting an Existing FeatureDataset, FeatureClass,
Table, or Raster 215
Creating Tables and Rows 215
xviii
Using Object Model Diagrams for Selecting Features and Rows
228
Working with Existing Selections
229
Selecting Rows and Features
233
Accessing a Subset of Records 237
Simple Statistics of Features 245
Some Important Points about Using Cursors 251
Displaying Subsets of Geospatial Data
254
Summary 255
CHAPTER 9: CONSTRUCTING AND USING THE
GEOMETRY OF FEATURES 257
Object Model Diagram for the Geometry
of Features and Graphics
258
Displaying Geometries on the Screen
260
Creating and Drawing Points 261
Creating and Drawing Multipoints 264
Creating and Drawing Polylines 268
Creating and Drawing Polygons 272
Creating a New Feature and Editing
an Existing Feature’s Geometry
276
Working with Spatial Operators
281
Examining Spatial Relationships 281
Common Geoprocessing Operations 284
Determining the Nearest Points and Distance 287
Length, Area, Centroid, and Envelope of Geometries
292
Summary 293
CHAPTER 10: RENDERING GEOSPATIAL DATA AND
USING HYPERLINKS AND MAPTIPS 295
Geospatial Data Display
296
Color and ColorRamp Classes 296
Symbols 298
Renderers for Vector and Raster Geospatial Data 300
Going beyond Simple Display
318
Simple and Advanced MapTips 319
CONTENTS
CHAPTER 11: LABELING, EXPORTING ACTIVEVIEW,
AND WORKING WITH ELEMENTS 327
Labeling 328
Labeling with the Default Labeling Engine 329
Labeling with the Maplex Labeling Engine 334
Exporting the ActiveView
336
Working with Elements
346
Adding GraphicElements 348
Adding FrameElements 352
Summary 361
CHAPTER 12: GEOPROCESSING WITH TOOLS AND MODELS 365
ArcObjects and the Geoprocessing Framework
365
Running Geoprocessing Tools
366
Running Custom Tools 375
Opening a Tool’s Dialog Box in Code
384
Geoprocessing in the Background
389
Bach Processing 397
Can I Manage the Execution of Geoprocessing Tools? 399
Summary 400
CHAPTER 13: FEATURE DATA MANAGEMENT 403
Use of GUID in ArcObjects
404
Working with the Geodatabase Model
406
Creating Geodatabases 407
Creating FeatureDatasets and FeatureClasses 408
Working with Features
418
Creating New Features 418
Modifying Existing Features 422
Summary 426
CHAPTER 14: ADVANCED TOPICS IN ARCOBJECTS
PROGRAMMING AND DEPLOYMENT 429
Sharing State and Functionality between Components
430
Event Handling in ArcObjects
432
Application Extension
435
Add-In Deployment
450
xx
Distributing and Installing an Add-In 453
Custom Component Deployment
456
Creating an Installer for Custom Component 459
Summary 465
APPENDIX: ANSWERS TO CHAPTER EXERCISES 467
INTRODUCTION
WELCOME TO Beginning ArcGIS for Desktop Development Using .NET. If you have always wanted to start your journey in the world of ArcObjects, this book is your perfect one-stop resource. Whether you are a new ArcGIS user with no background in programming or a programmer with a little experience in the ArcGIS platform, this book helps you be more productive. This book starts with the basics and brings you thoroughly up to speed. You fi rst discover all you need to know about .NET programming for developing ArcObjects: variables, fl ow control, object-oriented programming, and interface-based programming. Then the book helps you build skills
for developing ArcObjects and creating Desktop Add-Ins; reading object model diagrams; querying data; working with symbology, the geometry of geospatial data, and geoprocessing; and fi nally, deploying code.
WHO THIS BOOK IS FOR
This book is for anyone who wants to learn how to customize and extend Esri’s ArcGIS for Desktop applications using .NET. It is intended for anyone who wants to learn ArcObjects step by step. With the knowledge gained after reading this book, you will be able to build different kinds of add-ins and traditional ArcObjects developments in Visual Studio.
No prior background in programming is assumed, and anyone familiar with ArcGIS should be able to follow the examples. It does help, however, if you have a basic understanding of .NET and COM. The book starts with programming in .NET and ends by covering deployment topics. Each chapter is built on the knowledge gained in previous chapters.
This book is also for anyone who knows how to customize and develop ArcGIS using Visual Basic for Application (VBA) or Visual Basic 6. If this is your interest, you’ve gained a lot from the new capabilities of the 10.X versions of ArcGIS.
All example code in this book is presented in C#, which can be easily converted to Visual Basic.NET. If you are a hard-core fan of VB.NET don’t worry. All the source code used in this book is available for download in both C# and VB.NET at www.wrox.com (for more information, see the “Source Code” section later in this introduction).
WHAT THIS BOOK COVERS
xxii
This book uses the latest version of ArcGIS, which is ArcGIS 10.1. All the code examples are tested to work in version 10.0 as well. The focus of this book is on creating a new model of ArcGIS customization: the Desktop Add-In (or add-in for short). Unfortunately, the add-in model is not available for previous versions of ArcGIS (8.x and 9.x). However, if you have one of the older versions, you can still use this book to create traditional ArcObjects projects (Extending ArcObjects Template in Visual Studio).
HOW THIS BOOK IS STRUCTURED
This book is divided into three parts. The following explains each of these three parts in detail, and what each chapter covers.
Part I: The Basics
Throughout Chapters 1 and 2, you will see different approaches for customizing ArcGIS for Desktop applications.
➤ Chapter 1, “Why Geospatial Is Special”: This chapter shows you some unique
characteristics of geospatial data. Then it explains the different kinds of GIS software and provides a high-level survey of the ArcGIS platform. The chapter fi nishes with an overview of the major approaches for storing and managing geospatial data.
➤ Chapter 2, “Introduction to ArcGIS for Desktop Applications Customization”: Chapter 2 looks at different approaches for customizing ArcGIS for Desktop applications. It introduces techniques for customizing the user interface, Python scripting, Desktop Add-Ins, and extending ArcObjects. For each approach, I present at least one Try It Out example to show you how the different approaches fi t together.
Part II: .NET Programming Fundamentals
In Chapters 3 and 4, you gain the necessary knowledge of .NET programming to put ArcObjects to work.
➤ Chapter 3, “.NET Programming Fundamentals, Part I”: Chapter 3 explains the basic elements of C# that are necessary for successful ArcObjects development. The chapter covers topics such as variables, arrays, operators, decision making, iteration, object manipulation, enumeration, and the basics of object-oriented programming. When you complete this chapter, you will have good knowledge of implementing properties, methods, and constructors for classes.
INTRODUCTION
Part III: ArcObjects Programming
Throughout the chapters in this part, you learn ArcObjects programming from the ground up. ➤ Chapter 5, “Understanding ArcObjects Object Model Diagrams”: Part III starts with one
of the fi rst things you have to know in the ArcObjects world — object model diagrams. Chapter 5 shows you how to read and interpret the different symbols of object model diagrams that are part of ArcObjects developer help. In addition, this chapter describes the technique of interface-based programming.
➤ Chapter 6, “Accessing Maps and Layers”: You put your knowledge of reading object model diagrams to work and use various classes in ArcObjects to access various properties of maps and layers. You also create your fi rst add-in button to get basic information about existing Data Frames and layers in the main window of ArcMap.
➤ Chapter 7, “Working with Tables and FeatureClasses”: Tables and FeatureClasses are the most common structures for storing geospatial data in the ArcGIS platform. You learn how to access existing tables and FeatureClasses inside a map and how to add and delete a fi eld in a table. Finally, this chapter looks at the topic of creating tables and records.
➤ Chapter 8, “Subsets of Records”: Querying geospatial data and working with selections are explored in this chapter. It also explores cursors and calculating simple statistics out of numeric fi elds.
➤ Chapter 9, “Constructing and Using the Geometry of Features”: This chapter explains how to create different types of geometries for different types of features. As a related topic, this chapter explores the most common types of geoprocessing analysis, such as buffer, overlay, and union using the ArcObjects Geometry library.
➤ Chapter 10, “Rendering Geospatial Data and Using Hyperlinks and MapTips”: This chapter presents an overview of setting symbology for vector and raster layers and explores some types needed when working with Renderer classes. The contents of this chapter can be divided into two parts: The fi rst part discusses how to change the appearance of geospatial data, and the second part deals with how to make features to go beyond display through hotlinks, hyperlinks, and MapTips.
xxiv
➤ Chapter 12, “Geoprocessing with Tools and Models”: Chapter 12 focuses on the geoprocessing framework. Geoprocessing is a core and indispensable part of any GIS software. Users of ArcGIS perform geoprocessing via ArcToolbox. This chapter provides an overview of using the geoprocessing framework in code and shows you how to execute tools and models as well as background geoprocessing.
➤ Chapter 13, “Feature Data Management”: This chapter provides an overview of the most widely needed topics in geospatial data management in ArcObjects for vector data. Topics such as spatial reference systems, exporting features, creating geodatabases, and assigning domains to fi elds are explained.
➤ Chapter 14, “Some Advanced Topics in ArcObjects Programming and Deployment”: This chapter explains some advanced topics such as sharing state and functionality between components, creating application extensions, and wiring ArcObjects events. In addition this chapter illustrates how to create setup projects and confi gure them to make an easy-to-use installer package. A custom behavior is sometimes needed during the setup procedure, such as reading and writing registry keys. This chapter demonstrates how to create this custom behavior in order to perform appropriate actions.
The fi nal part of the book is the Appendix:
➤ Appendix, “Answers to Exercises”: Answers to all the questions asked at the end of each chapter are presented in this appendix.
WHAT YOU NEED TO USE THIS BOOK
To use the examples in this book, in addition to ArcGIS Desktop 10.0 or ArcGIS for Desktop 10.1, you need at least .NET 3.5 sp1 (service pack 1), which is installed with ArcGIS for Desktop 10.0 and 10.1. You also need an Integrated Development Environment (IDE) to be able to write code. You can use any IDE from Microsoft that supports .NET 3.5 sp1. The following is a list of available IDEs that can be used to develop add-ins for ArcGIS Desktop 10.0 and ArcGIS for Desktop 10.1:
➤ Supported IDEs for version 10.0:
➤ All editions of Visual Studio 2008 including Express ➤ All editions of Visual Studio 2010 except Express ➤ Supported IDEs for version 10.1:
➤ All editions of Visual Studio 2010
INTRODUCTION
REQUIRED SOFTWARE PACKAGES FOR THIS BOOK
TITLE PACK AGE
GIS software ArcGIS for Desktop 10.1 or ArcGIS Desktop 10.0
Integrated Development Environment
For ArcGIS for Desktop 10.1: all versions of Visual Studio 2010 For ArcGIS Desktop 10.0: all versions of Visual Studio 2008 and all versions of Visual Studio 2010 except Visual Studio 2010 Express Software Development Kit ArcObjects SDK for .NET
CONVENTIONS
To help you get the most from the text and keep track of what’s happening, I use a number of conventions throughout the book:
WARNING Boxes like this one hold important, not-to-be-forgotten information directly relevant to the surrounding text.
NOTE Boxes like this one indicate notes, tips, hints, tricks, and asides to the cur-rent discussion.
TRY IT OUT
The Try It Out is an exercise you should work through, following the text in the book.
1.
They usually consist of a set of steps.2.
Each step has a number.3.
Follow the steps through with your copy of the source code.How It Works
xxvi
As for styles in the text:
➤ I italicize important words when I introduce them.
➤ I show URLs and code within the text in a special monofont typeface, like this:
persistence.properties.
I present code in two different ways:
I use a monofont type for most code examples.
I use bold to emphasize code that is particularly important in the present context or to show changes from a previous code snippet.
SOURCE CODE
As you work through the examples in this book, you may choose either to type in all the code manually, or to use the source code fi les that accompany the book. All the source code used in this book is available for download at www.wrox.com. Specifi cally for this book, the code download is on the Download Code tab at:
www.wrox.com/remtitle.cgi?isbn=1118442547
You can also search for the book at www.wrox.com by ISBN (the ISBN for this book is 978-1-118-44254-8) to fi nd the code. A complete list of code downloads for all current Wrox books is available at www.wrox.com/dynamic/books/download.aspx.
At the beginning of each chapter, I provide the name of the folder on Wrox.com that contains the code for that chapter. Throughout each chapter, you also fi nd references to the names of code fi les as needed in listing titles and text.
Most of the code on www.wrox.com is compressed in a .ZIP, .RAR archive, or similar archive format appropriate to the platform. Once you download the code, decompress it with an appropriate compression tool.
NOTE Because many books have similar titles, you may fi nd it easiest to search by ISBN; this book’s ISBN is 978-1-118-44254-8.
ERRATA
INTRODUCTION
save other readers hours of frustration, and at the same time, you will be helping us provide even higher quality information.
To fi nd the errata page for this book, go to
www.wrox.com/remtitle.cgi?isbn=1118442547
Click the Errata link. On this page, you can view all errata that has been submitted for this book and posted by Wrox editors.
If you don’t spot “your” error on the Book Errata page, go to www.wrox.com/contact/
techsupport.shtml and complete the form there to send us the error you have found. We’ll check the information and, if appropriate, post a message to the book’s errata page and fi x the problem in subsequent editions of the book.
P2P.WROX.COM
For author and peer discussion, join the P2P forums at http://p2p.wrox.com. The forums are a web-based system for you to post messages relating to Wrox books and related technologies and interact with other readers and technology users. The forums offer a subscription feature to e-mail you topics of interest of your choosing when new posts are made to the forums. Wrox authors, editors, other industry experts, and your fellow readers participate in these forums.
At http://p2p.wrox.com, you will fi nd a number of different forums that will help you, not only as you read this book, but also as you develop your own applications. To join the forums, just follow these steps:
1.
Go to http://p2p.wrox.com and click the Register link.2.
Read the terms of use and click Agree.3.
Complete the required information to join, as well as any optional information you wish to provide, and click Submit.4.
You will receive an e-mail with information describing how to verify your account and complete the joining process.NOTE You can read messages in the forums without joining P2P, but in order to post your own messages, you must join.
PART I
The Basics
⊲
CHAPTER 1:
Why Geospatial Is Special
Why Geospatial Is Special
WHAT YOU WILL LEARN IN THIS CHAPTER:
➤ Main reasons that geospatial data are special
➤ Some sources of errors in using and collecting geospatial data
➤ Major types of GIS software
➤ A brief description of the ArcGIS platform
➤ Various geospatial data storage models
➤ Diff erent types of Esri geodatabases
WROX.COM CODE DOWNLOADS FOR THIS CHAPTER
The wrox.com code downloads for this chapter can be found at www.wrox.com/remtitle .cgi?isbn=1118442547 on the Download Code tab. The code is in the Chapter01 folder and is individually named according to the names throughout the chapter.
Geospatial data have played a major role in human life for centuries. Almost all human activities and decisions contain geospatial components. Collecting, managing, processing, and representing various kinds of geospatial components are accomplished by various kinds of geotechnologies, including GIS (Geographical Information System), remote sensing, photogrammetry, cartography, surveying, and GPS (Global Positioning System), to name just a few. Many research organizations have identifi ed geotechnology, nanotechnology, and biotechnology as the three most important emerging fi elds. There is no doubt that the need for geospatial data and use of geotechnologies will continue to grow for years to come.
GIS is the heart of geotechnologies and Esri’s ArcGIS is the most widely used and powerful commercial GIS software. In this chapter, you will learn various categories of GIS software and see how the ArcGIS platform provides software products for each category. After
reading this chapter, you will know what makes the ArcGIS platform compelling to users and developers alike.
NOTE Esri is the worldwide leading supplier of GIS software and services. The company was founded as Environmental Systems Research Institute in 1969 by Jack and Laura Dangermond. Today Esri products (particularly ArcGIS for Desktop applications) have more than 40 percent of the global market share.
A TOUR OF GEOSPATIAL DATA
Nowadays, in order to create a map or collect geospatial data with a handheld GPS device, all the necessary steps are:
1.
Turn on the GPS receiver.2.
Walk around and periodically click the button with the “Mark” label, or simply let the device collect data for you constantly.3.
Connect the GPS receiver to the computer and let the software draw a map for you. Even better, have the small screen of the device itself display the map.Simple stuff, right? Collecting and using geospatial data like this is very common today. Millions of people explore the world on www.OpenStreetMap.org, which collects and updates most of its geospatial data in the mentioned fashion (called crowdsourcing). Geocaching is another fun example of using and collecting geospatial data. Geocaching is a low-cost sport in which a person (called a geocacher) uses a GPS device to fi nd something that was hidden by other geocachers. Technically speaking, geocaching is fun outdoor navigation with GPS devices.
As a more recent simple example of using and collecting geospatial data, consider the W3C
Geolocation Application Programming Interface (API) specifi cation. This API provides the location of a device (desktop, handheld without GPS, handheld with GPS, etc.) through location information servers in standard and transparent fashion directly from the web browser. The Geolocation API is implemented in almost all modern web browsers, including Microsoft Internet Explorer, Mozilla Firefox, Google Chrome, Apple Safari, and Opera. The following Try It Out demonstrates the simplest example of using Geolocation API.
TRY IT OUT
Using the Geolocation API to Get the Current Location
(TheSimplestExample.htm)
1.
Open the text editor of your choice (like Windows Notepad). You also can use any HTML editor, but for this example, a simple text editor suffi ces.2.
Enter the following statements:<!DOCTYPE html> <html lang="en"> <head>
<title>Simple Usage of Geolocation API </title> <script type="text/javascript">
if (window.navigator.geolocation)
A Tour of Geospatial Data
❘
5} else {
alert('Unfortunately your web browser does not support Geolocation API.'); }
function getLocationCallback(location) { var geospatialMessage = '';
geospatialMessage += "Your geographic location is:\n\n";
geospatialMessage += 'Latitude: ' + location.coords.latitude + "\n"; geospatialMessage += 'Longitude: ' + location.coords.longitude + "\n"; alert(geospatialMessage);
}
function errorCallback(error) { alert("something wrong !"); }
</script> </head> <body></body> </html>
3.
Save the fi le with the name of “TheSimplestExample.htm”. In Notepad, make sure that you enter the double quotation marks before and after the name of the fi le in order to save it as an .htm fi le.4.
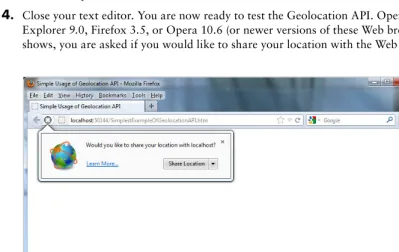
Close your text editor. You are now ready to test the Geolocation API. Open the fi le with Internet Explorer 9.0, Firefox 3.5, or Opera 10.6 (or newer versions of these Web browsers). As Figure 1-1 shows, you are asked if you would like to share your location with the Web page.FIGURE 1-1
How It Works
To see the purpose and use of the Geolocation API, let’s begin by examining the code. The code fi rst checks for support of the Geolocation API in your browser with the following statements:
if (window.navigator.geolocation){
navigator.geolocation.getCurrentPosition(getLocationCallback,errorCallback); } else{
alert('Unfortunately your web browser does not support Geolocation API.'); }
If the browser supports the Geolocation API, the script calls the getCurrentPosition function and passes the names of two other functions. If the browser does not support the Geolocation API, the script alerts the user.
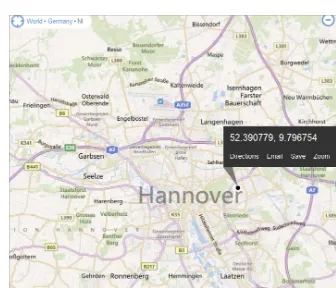
6.
If you enter those numbers in an online mapping application like Microsoft Bing Maps (www.bing .com/maps), you will notice that it is the approximate location of the device that provides location information to your browser, GPS, or any other device. (See Figure 1-3.)A Tour of Geospatial Data
❘
7The fi rst function will be called if the Geolocation API successfully gets the current position of the browser and will report the current position:
function getLocationCallback(location) { var geospatialMessage = '';
geospatialMessage += "Your geographic location is:\n\n";
geospatialMessage += 'Latitude: ' + location.coords.latitude + "\n"; geospatialMessage += 'Longitude: ' + location.coords.longitude + "\n"; alert(geospatialMessage);
}
The second function is called if the Geolocation API fails to locate the current position of the browser.
NOTE Instead of getting the position directly from the getCurrentPosition function, we have to pass the names of two functions as input. The reason for passing the names of two other functions is that behind the scenes, the Geolocation API makes use of many calls to other resources to get the browser’s position. As a result, we have to use the Geolocation API in asynchronous fashion with the help of callback functions.
HOW THE GEOLOCATION API WORKS
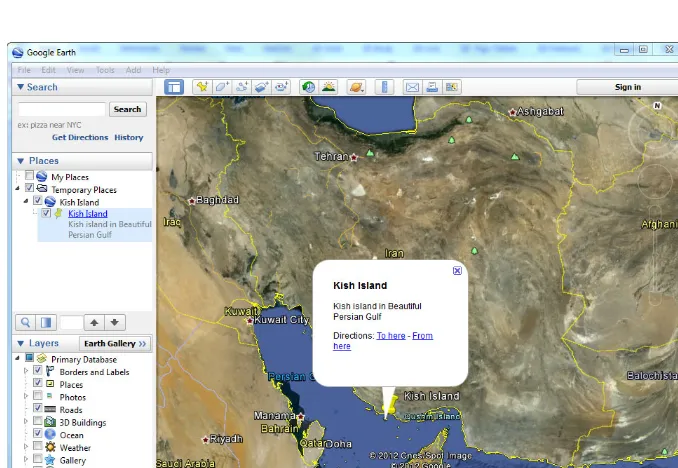
If you understand how geospatial data are used today by the Geolocation API, GPS devices, Google Earth, and so on, you might ask yourself: if collecting and using geospatial data is so simple, why do the techniques, concepts, and sciences like the Geospatial Information Science (GISc), Location Based Services (LBS), and Spatial Decision Support Systems (SDSS) exist at all? In other words, is it all about software? If it is all about software, we can use and collect geospatial data just like any other kind of data. But geospatial data are different kinds of data and special methods and techniques have to be created and developed to handle them. The following sections briefl y discuss what is special about geospatial data.
WHY GEOSPATIAL IS SPECIAL
Today, all human activities and decisions have a geospatial component, and maps are the most widely used type of geospatial component. Most of the time, we are exploring maps in many different kinds of media — such as TV channels, newspapers, mobile apps, websites, and even the small display of a car navigation system to fi nd an address, a best route, a nearest facility, tomorrow’s weather, and so on. In contrast to what they seem at fi rst, using and collecting geospatial data are not so simple.
In its basic form, a geospatial component is a pair of geographic coordinates called latitude and
longitude, which are used to represent the location of a point on the surface of the earth. The latitude and longitude belong to geographic coordinate system space, so they are called geographic coordinates.
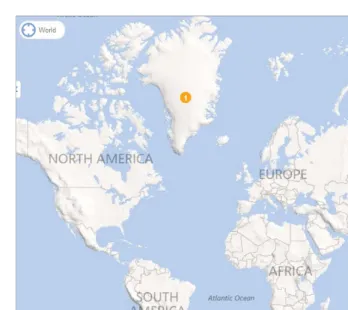
As we already know, earth is not a perfect sphere. Mathematically speaking, among 3D shapes, spheroid provides the best approximation of earth. This approximation injects a variable amount of errors in all geospatial-related activities (from representation to processing) of geospatial data. Spheroid is a 3D shape, so in order to represent it on the 2D plane of display screens (like a map or the screen of any device), the 3D spheroid has to be projected on a fl at coordinate system. This is called projection or map projection. All map projections distort geospatial components in some way. If you take a look at Greenland (with an area of 2,166,086 km2) as it is represented
in Microsoft Bing Maps (www.bing.com/maps), you will notice that it is drawn a little larger than South America (with an area of 17,840,000 km2; see Figure 1-4). This map has a map
projection that distorts the area of geospatial features. In spite of this, most of the time we use and work with a projected coordinate system in which geospatial data are projected on the fl at coordinate system.
Why Geospatial Is Special
❘
9What about processing? Any kind of geospatial processing needs precise geospatial data with a known coordinate system. (As mentioned previously in this section, coordinate systems come in two fl avors: projected and geographic.) Many processing methods of geospatial data can be applied to various spaces, like the human body, for example, as is done for analysis of the human body with medical images. There are also many processing methods that are specifi c to geospatial data, which in most cases are very complex and time consuming. Even with the horsepower of today’s computers, most PCs and laptops aren’t designed to handle the intense workload of geospatial processing. The simple reason for such a huge workload is the high volume and unstructured nature of geospatial data. For example, a polygon can have at least three and at most millions of points as its point collection.
indexing geospatial data for quick retrieval), to make matters even more complicated, one of the unique aspects of geospatial data is the relationships that they can have. In addition to regular relational relationships (like parent-child relationships), geospatial data can have many topological relationships, which is the arrangement for how point, line, and polygon features share their geospatial components or geometry.
In addition to various kinds of errors, huge volumes of data, special types of relationships, complexity of processing, the need for coordinate systems, and various kinds of representation, editing geospatial data usually requires long transactions, which is rare in managing other kinds of data. Simply put, a transaction is a package of units of work on data that must be done in all-or-nothing mode. Editing non-geospatial data in most cases must be done in a fraction of a second (e.g., transactions in fi nancial systems like banks). In contrast, any edit of geospatial data (inserting new features, updating and deleting existing features) might take a few minutes to several months to be completed. For this reason, geospatial data must be managed in quite different information systems. Those are the quick answers to the question asked at the beginning of this section: Why are geospatial data so special?
NOTE For in-depth exploration of why geospatial data are special, read Geographic Information Systems and Science, third edition, by Paul A. Longley, Michael F. Goodchild, David J. Maguire, and David W. Rhind (John Wiley & Sons, Inc., 2011).
As I said at the beginning of this chapter, nearly all activities and decisions of humans contain geospatial components. Collecting, managing, processing, and representing various kinds of geospatial components are accomplished by geotechnologies, which include GIS, remote sensing, photogrammetry, cartography, surveying, and GPS, just to name a few. GIS is the heart of geotechnologies. I think of it this way: If geotechnologies were a human, GIS would be the brain.
NOTE There are a lot of good books on geotechnologies. Most of them focus on a specifi c geotechnology. But if you are more interested in a brief introduc-tion to almost all geotechnologies, then read Basics of Geomatics by Mario A. Gomarasca (Springer, 2009).
GIS consists of six components: hardware, software, people, data, methods, and network. The focus of this book is on the software component. The next section delves into the GIS software topic.
VARIOUS KINDS OF GIS SOFTWARE
Various Kinds of GIS Software
❘
11Server GIS
As the name implies, server GIS is all about serving geospatial resources to its clients over networks (such as the Internet). It is fair to say that currently, the Web is used almost exclusively in server GIS to share geospatial resources. Geospatial resources could be maps (images of geospatial data), geospatial data, processing services, geospatial metadata, and so on. Based on who consumes the geospatial resources, this category has three subcategories: web GIS, GIS web services, and geospatial data access. People use web GIS applications for many purposes. A web GIS application could be as simple as a website with a slippy map that provides search capability and navigation controls such as zoom in/out and pan (like most web mapping applications such as www.OpenStreetMap.org), or as sophisticated as a web application that provides processing and editing of geospatial data and contains tools for data management activities and workfl ows (such as http://gis.hudson.oh.us/HudsonSL/).
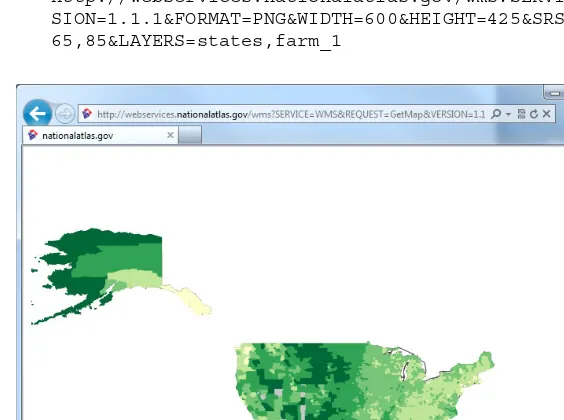
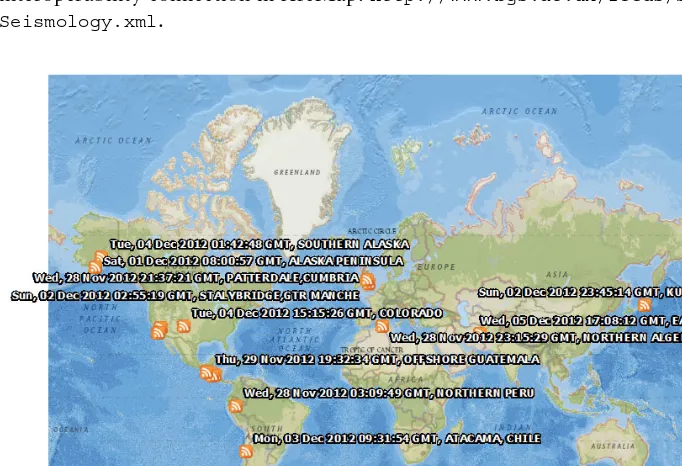
In contrast to web GIS applications, GIS web services are consumed by other applications. Other applications call GIS web services to get access to geospatial resources. Users of those applications may never know about this fact. The Open Geospatial Consortium (OGC) has played an important role in the evolution of GIS web services. Specifi cally, OGC has tried to provide interoperability between GIS software through the development of standards that facilitate sharing and accessing geospatial resources. Among the most widely used standards are Geography Markup Language (GML), Keyhole Markup Language (KML), Web Map Service (WMS), Web Feature Service (WFS), and Web Coverage Service (WCS). GML and KML are XML-based formats and are explained later in this chapter. WMS, WFS, and WCS are GIS web services that provide access to map data (an image of geospatial data), vector geospatial data, and raster geospatial data, respectively. If you enter the following URL into the address bar of your web browser, you will see the image shown in Figure 1-5:
Yes, you are right: It is a map from the national atlas of the United States. The text preceding the question mark (“?”) is the address of the WMS service of National Atlas. Everything after the question mark (called the query string) is a key-value pair in the form of key=value. You can see by looking at the query string that the web browser requests an image of geospatial data with the following characteristics:
➤ Format of the image, requested as Portable Network Graphics (FORMAT=PNG). ➤ Size in pixels with two keys — width and height (WIDTH=600, HEIGHT=425).
➤ Spatial Reference System (SRS) in European Petroleum Survey Group (EPSG) coding scheme (SRS=EPSG:4326). This SRS code is the other name for the World Geodetic System of 1984 (or WGS 84), which is a well-known geographic coordinate system. (Remember latitude and longitude?)
➤ Bounding box of the area in terms of minX, minY, maxX, and maxY (BBOX=-170,20,-65,85).
➤ Layers constituting the map (LAYERS=states,farm_1).
This usage of WMS isn’t suitable for human users — quite the opposite — but other GIS software can use this method easily. GIS web services provide an interface for other GIS software instead of a user interface for human users. Did you notice what programming language or database is used to implement the WMS functionality? Again, it is transparent to users of WMS (both users are software applications). No matter what software infrastructure (operating system, middleware, programming language, and database) is used to implement the service, all that matters is that they can be used in platform-neutral fashion to provide valuable geospatial resources. Using GIS web services provides an effi cient and simple way of sharing and accessing geospatial resources. Today, thousands of organizations all around the world provide GIS web services to make it easy to access and share very large amounts of data.
Various GIS software products can consume GIS web services. Consuming GIS web services is in most cases as simple as adding a geospatial layer to the GIS software. You see an example of this in the “Using a GIS Web Service Inside ArcMap” Try It Out, later in this chapter. Even GIS web services can use other GIS web services to build a composite GIS web service.
NOTE The ability to combine GIS web services brings a new opportunity to make GIS software a composite of autonomous, general purpose, and reusable GIS web services. This is where Service Oriented Architecture (SOA) and cloud computing (Software as a Service, or SaaS) come into play. In the ArcGIS plat-form, ArcGIS online provides huge geospatial resources that are ready to use over the Web inside Esri’s secure cloud. Coverage of ArcGIS online is beyond the scope of this book.
Various Kinds of GIS Software
❘
13replaced by ArcGIS for Server, ArcIMS is worth mentioning. ArcIMS provided an easy way to create and develop web GIS software.
ArcGIS for Server has another subcategory. Let’s call it geospatial data access, which provides access to geospatial data inside databases. Geospatial data access doesn’t store data; rather, it provides the necessary tools and utilities to enable Database Management System (DBMS) software to manage geospatial data. In this case, it doesn’t matter that a DBMS is able or not to handle geospatial data natively; all that matters is that geospatial data access software uses DBMS as a repository of geospatial data. Unlike web GIS and GIS web services, geospatial data access is not an independent product. In other words, it doesn’t provide user interface for human users, and it does not provide an interoperable and public interface for other systems. Geospatial data access works with the other components or software in a GIS system to enable management of geospatial data inside a DBMS. In the ArcGIS platform, ArcSDE plays this role. It is part of ArcGIS for Server software.
NOTE Spatial DBMS is another kind of server GIS explained in the section “Geospatial Data Inside Spatial DBMS,” later in this chapter.
Desktop GIS
Desktop GIS is GIS software installed on the user’s computer that provides a range of capabilities. Conventional desktop GIS provides users all the tools needed to perform geospatial-related activities. The desktop GIS is without a doubt the largest category of GIS software in the professional GIS community, and for this reason we divide it into viewer, virtual globe, and professional subcategories.
Desktop viewers provide simple display and query capabilities. Usually they provide no tools for data editing and processing. But desktop viewers in most cases are free, and they help to create de facto standards, terminology, and formats for specifi c vendors. ArcReader is free downloadable software from Esri that provides easy-to-use tools for working with geospatial data. Use of
ArcReader is limited to geospatial data, which are packaged using ArcGIS for Desktop ArcPublisher extension. In other words, you can’t add your local geospatial data to the map (there is no “add data” button!). ArcGIS Explorer is the other free desktop viewer software from Esri (which has add-data capability). In its latest version (Build 1750), it provides both a 2D and a 3D view of geospatial data as well as adding online geospatial resources such as geoprocessing models. Being able to represent and process data in 3D, ArcGIS Explorer belongs to both viewer and virtual globe subcategories.
3.
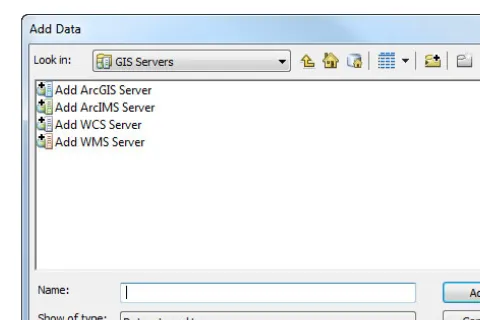
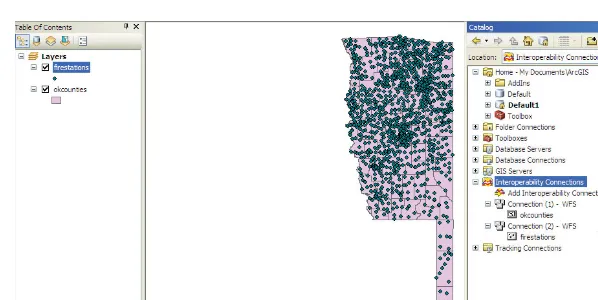
Click the Up One Level arrow several times to get to the Home folder, as shown in Figure 1-7. Professional desktop GIS products are full-featured GIS software and usually contain tools for collecting, editing, and analyzing geospatial data. In addition, professional desktop GIS products provide many tools for making various kinds of visual output and reports from geospatial data. They often include necessary tools for geospatial data management and administration. ArcMap and ArcCatalog are two professional desktop applications included in the ArcGIS for Desktop applications package that provide a full range of geospatial capabilities. ArcMap is the main mapping application of the ArcGIS platform. It is used for collecting, editing, analyzing, visualizing, and publishing geospatial data. ArcCatalog is primarily used for geospatial data management and administration. In the following Try It Out, you learn how ArcMap uses a GIS web service.TRY IT OUT
Using a GIS Web Service inside ArcMap
1.
Ladies and gentleman, start your engines by running ArcMap, and be sure you are connected to the Internet (actually, the Web, the Internet’s major application).2.
Click the Add Data button, shown in Figure 1-6, to open the Add Data dialog box.FIGURE 1-6
FIGURE 1-7
Various Kinds of GIS Software
❘
155.
Double-click Add WMS Server to open the Add WMS Server window. Enter the address of the WMS service for the national atlas of the United States (http://webservices.nationalatlas .gov/wms) into the URL textbox and click the Get Layers button.8.
If you scroll down the layer list and turn on the layer with the name Agriculture-Farms 2007-Average Size of Agriculture-Farms in Acres, you will see the same layer that you saw in your browser in the “Using the Geolocation API to Get the Current Location” Try It Out, earlier in this chapter. Also, if you double-click the layer to open the Layer Properties window, you will notice that the name of the layer is “farm_1” (see Figure 1-11). Where have you seen this name before?How It Works
As mentioned earlier, using the WMS service is as simple as adding a layer. When we enter the URL address of the WMS service and click
the Get Layers button in the Add WMS Server window, ArcMap sends a request to the WMS service and asks about the capabilities of the service. The service responds with a document called a capabilities
7.
A new node for WMS is added to the GIS Servers folder. Double-click it to add all layers to the map. You will see lots of layers added to the map, as shown in Figure 1-10.FIGURE 1-10
Various Kinds of GIS Software
❘
17document. Using the capabilities document, ArcMap recognizes layers which can be served by the ser-vice. From this point, you can use layers from the WMS service as you would any map layers and let ArcMap take care of interaction with WMS.
NOTE As you can see, the capabilities document is intended to be used by soft-ware. But it is a human-readable XML document as well. If you want to retrieve the capabilities document of the mentioned WMS, enter the following URL into the address bar of your web browser:
http://webservices.nationalatlas.gov/wms?request=getCapabilities
Developer GIS
When you want to build specifi c-purpose and highly fl exible GIS software, you have two options: build the software from the ground up, or alternatively, make use of ready-to-use components to build the software. As you now know, geospatial data are special, so in addition to the usual tasks for building any kind of software, there are many special techniques and methods to perform even simple tasks in GIS software. Remember that putting some pushpins or markers on Bing Maps or Google Maps, making mashups, or creating fl ashy layouts is not considered GIS software. When considering geospatial data from different sources with various errors and, most notably, different kinds of coordinate systems, even a simple distance measurement tool can become a nightmare for a team of knowledgeable developers. As a result, many organizations use ready-to-use tools and components to save money and time rather than implementing the software from the ground up. In general, tools and components, along with documentation and additional utility software, are packaged together in a Software Development Kit (SDK). Developer GIS products are SDKs that provide developers the tools they need to customize existing GIS packages or create new GIS applications. The main audiences of this kind of GIS software are brave developers like you and me. An SDK can be used to customize existing software or it can be used to create brand new software. All aspects of serious development of GIS software are considered developer GIS. Many fl avors of GIS software exist, and in turn, there also are many kinds of developer GIS (or SDKs). The following list constitutes a brief explanation of development opportunities in the ArcGIS platform. (Chapter 2 introduces ArcGIS desktop application development.)
➤ In the Esri desktop GIS arena, there are ArcGIS desktop SDKs, an ArcGIS engine SDK, and an ArcGIS Explorer SDK.
➤ ArcGIS for Desktop provides two SDKs (.NET SDK and Java SDK) for customization of ArcGIS for Desktop applications (ArcMap, ArcCatalog, ArcGlobe, and ArcScene). ➤ In the ArcGIS platform, the ArcGIS Engine is considered the main developer GIS for
building brand new GIS applications. It is, in almost all cases, used for creating high-end, specifi c-purpose, and fl exible desktop GIS software.
For exposing all kinds of web mapping functionality over the web, ArcGIS for Server provides GIS web services that can be used to create web GIS applications. This is the pattern to opt for when you’re building web GIS applications. In other words, you fi rst publish a GIS resource (e.g., an ArcMap map document) as a service and then build your web application, which consumes that service. In addition, GIS web services provided by ArcGIS for Server can be used by major web application development platforms and technologies such as JavaScript, .NET, Java, Microsoft SharePoint, Microsoft Silverlight/WPF, and Adobe Flex (generally Esri calls these APIs ArcGIS Web Mapping APIs).
There are also SDKs for using geospatial data on handheld devices that provide access to the device’s hardware and services (like GPS). Esri provides SDKs for all major platforms of handheld devices such as Google Android, Apple iOS, and Microsoft Windows Phone. These SDKs can provide access to GIS web services that are published by ArcGIS for Server and other GIS web services that adhere to OGC standards (just like WMS).
Mobile GIS
Mobile or handheld GIS is simply GIS software that runs on handheld devices such as smartphones and tablet PCs. Mobile GIS software can work in connected and disconnected modes. This
capability makes them the best choice for a full range of fi eld-related activities like fi eld data collection and validation. With the rapid progress of the hardware industry, wireless networks, and the popularity of handheld devices, mobile GIS software might become the dominant category of GIS software in the near future. ArcPad is the main mobile GIS of the ArcGIS platform. There is also ArcGIS for Smartphones and Tablets as well. These products provide many useful tools for navigation, querying, and analyzing geospatial data on a handheld device, and they can edit existing geospatial data.
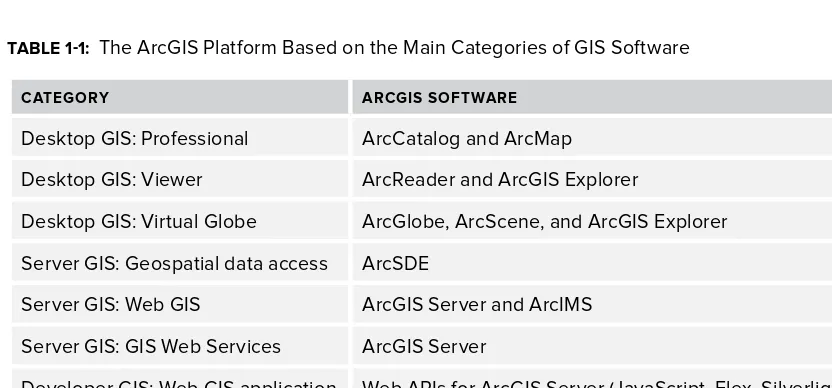
Table 1-1 organizes the ArcGIS platform based on the main GIS software categories.
TABLE 1-1: The ArcGIS Platform Based on the Main Categories of GIS Software
CATEGORY ARCGIS SOFTWARE
Desktop GIS: Professional ArcCatalog and ArcMap
Desktop GIS: Viewer ArcReader and ArcGIS Explorer
Desktop GIS: Virtual Globe ArcGlobe, ArcScene, and ArcGIS Explorer Server GIS: Geospatial data access ArcSDE
Server GIS: Web GIS ArcGIS Server and ArcIMS
Server GIS: GIS Web Services ArcGIS Server Developer GIS: Web GIS application
development
Web APIs for ArcGIS Server (JavaScript, Flex, Silverlight/ WPF, Microsoft SharePoint, .NET, and Java)
Developer GIS: for customizing Desktop GIS
Geospatial Data Models and Storage
❘
19Developer GIS: for Desktop GIS development
ArcGIS Engine
Developer GIS: for mobile device development
SDK for Android, iOS, and Windows Phone
Mobile GIS ArcPad, ArcGIS for Smartphones and Tablets
GEOSPATIAL DATA MODELS AND STORAGE
The term model can get quite confusing, given its use in a number of different contexts. The term
geospatial data model refers to how geospatial data are described and stored in the fi le or database and how data are represented in a computer system. Raster and vector data models are two of the most used methods of representing geospatial data on computers with many different storage models and formats. Note that geospatial data consist of both attribute and geometry elements. Positional data and all their related characteristics (such as coordinate system and accuracy) constitute the geometry element of geospatial data.
NOTE Other kinds of models are available for geospatial data. A conceptual model describes the elements of signifi cance for a specifi c purpose (domains or applications like water management), including attribute characteristics and relationships between attributes. The logical model represents business requirements with defi nitions and examples that prioritize importance and how elements relate to each other. The physical model describes how the logical model is represented in fi les or a database with corresponding sets of constraints.
Raster
In a raster model, space is usually divided into a 2D array of cells (picture elements, or pixels for short) and each cell is assigned a value. When geospatial data are represented in a raster model, all detail about variation of the data within each cell is lost, and instead, the cell is given a single value. That single value is almost always determined by the value that occupies most of the area of the cell. Additional values stored for each cell may be a discrete value, such as a land use code, a continuous value, such as pollution or elevation, or a null value if no data are available.
Two commonly used sources of raster data are satellite images and digital aerial photos. Raster data is stored in various formats, from a standard fi le-based structure of PNG, TIFF, JPEG,
Vector
In a vector model, a point is the basic structure with which all the other geometries can be created. Line and area features historically have been constructed using simple linear connections (straight connections) between their point collections. As a result, line and area objects in GIS are modeled as a collection of connecting line objects (called segments) and the terms polyline and polygon have been coined to describe this fact. Vector models represent more precise and effi cient models for storing and representing geospatial data, but the analysis of this model can be more complicated than for raster models in terms of algorithms and computation resources needed. As with raster data, there are quite a lot of formats and structures for storing vector data. The following sections briefl y explain the most widely used structures for storing geospatial data.
NOTE Technically speaking, in GIS the connecting line between two points is called a segment. Traditionally, segments were stored just as straight lines. But in most modern GIS systems like ArcGIS, segments can be parametric curves as well as straight lines (such as circular arcs, elliptical arcs, and Bézier curves). So the line or area feature in GIS is composed of an ordered set of points (a point collection) and the types of segments used between each pair of points in the point collection.
Geospatial Data as Text or Binary File
Geospatial data can be stored simply in text fi les using comma-separated values (CSV) or similar structures. In fact, almost all GIS packages provide some import/export functionality based on simple text or spreadsheet fi les. In most cases, these structures provide the bare bones of geospatial data and are used only for point geospatial data.
Early GIS systems used a proprietary structure or fi le format for storing and processing geospatial data natively. Being proprietary, many early GIS systems didn’t publish their own proprietary fi le format specifi cations. When there was a need to share geospatial data, they provided a textual format with limited capabilities compared to the native proprietary format, or a different proprietary format that had a published specifi cation.
As an example of such proprietary formats, Autodesk’s DXF (data exchange format) is a
proprietary fi le format intended to provide data interoperability between the Autodesk AutoCAD platform and other software for vector data. Data in DXF can be saved as binary as well as ASCII encodings, which makes it a low-cost choice for import/export functionality for geometry elements of geospatial data. But limited support of spatial reference systems,
attributes, and complex geometries makes it a less useful fi le format for storing and processing geospatial data.
Geospatial Data Models and Storage
❘
21Geospatial Data in Georelational Models
The georelational model is one of the most widely used models for storage, processing, and sharing geospatial data. In this model, geospatial data is divided into two separate but related structures. The geometrical element of features is stored in a binary fi le or set of binary fi les, and corresponding attributes are stored in a RDBMS table. Association between the geometry elements and attribute elements is available using keys (unique keys in each set of features or feature class or identities). In other words, there is a one-to-one relationship between geometries in binary fi le(s) and the records of attribute data in the table.
The Esri shapefi le (shapefi le for short) is the most widely used georelational format for storing and sharing geospatial data. A shapefi le actually consists of at least three fi les with the same name and with different extensions. These three fi les store core data of the georelational model, and other optional fi les can be used to provide further properties and metadata of the geospatial data in shapefi le format. Mandatory fi les in shapefi le are:
➤ .shp: geometry element of geospatial features
➤ .dbf: attribute element of geospatial features; a dBase (a RDBMS) native format ➤ .shx: geometry index of geospatial features to enable quick geospatial data retrieval
Each shapefi le represents a single feature class of points, lines, or polygons. Over time, shapefi le has become widely accepted as a de facto standard for storing geospatial data, and it is still widely used and deployed. Despite its popularity, the shapefi le has serious limitations:
➤ Limited support for Unicode for fi eld name and attribute values ➤ Restricted length of fi eld name (10 characters)
➤ No support for topology
➤ Limited feature storage (2 gigabytes) ➤ Limited number of fi elds (255) ➤ No support for time data
➤ Rounding errors (because numeric attributes are stored in character format rather than in binary format)