Multiomics analysis of microbiota-metabolites
relations and meta-analysis for the effects of
probiotics on children with atopic dermatitis
meta-analysis for the effects of probiotics on children with
atopic dermatitis
Yuri Yamamoto
A dissertation for the degree in the Graduate School of Media and Governance Systems Biology Program
KEIO UNIVERSITY
2018
Multiomics analysis of microbiota-metabolites relations and
meta-analysis for the effects of probiotics on children with
atopic dermatitis
Abstract
The gastrointestinal microbiota colonize the digestive tract and are composed of approximately 1014 microbes and more than 400 species. These microbes are responsible
for maintaining the gastrointestinal environment by facilitating digestion and interacting with the host immune system. In this study, the relationships among microbiota, their host and metabolites are analyzed from the viewpoint of molecular biology and public health. First, the effect of microbiota on atopic dermatitis is reviewed and analyzed. The results of a meta-analysis examining the effects of probiotics on children with atopic dermatitis make it difficult to conclude that probiotics have a suppressing effect on atomic dermatitis (AD) symptoms based on some qualified papers. Among these studies, the differences of patient age and country region produced the strongest effects on AD. On the other hand, it is difficult to discuss the effect of probiotics considering the differences in probiotics, as well as the differing dynamics of microbial profiles, which proved to be a major limitation of this study. Second, metabolic analysis and microbial population analysis of the murine intestinal tract components are conducted to understand the ecosystem among the host, metabolites and microbiota. Metabolic profiles have differences among each part of the intestine. Particularly, sugar shows the largest differences, and sugars are clustered into seven groups.
論文題目
腸内細菌叢
-
代謝物間のマルチオミクス解析と小児アトピー性
皮膚炎プロバイオティクス効果のメタアナリシス
論文要旨
腸内細菌は腸内に生息しており、量にして 1014個、400 種だと言われている。腸内環 境を維持するのにとても重要であると言われており、宿主の消化作用や免疫をサポ ートしていると知られている。本研究では、腸内細菌を分子生物学と公衆衛生学の観 点から解析し、腸内細菌と代謝物、細菌間、宿主との相互作用について調べた。まず、 腸内細菌は小児アトピー性皮膚炎へのプロバイオティクス効果が期待されているの で、宿主に対してどのような効果があるのかを解析した。小児アトピー性皮膚炎患者 に対するプロバイオティクスのメタアナリシスの結果、本研究で扱ったいくつかの論文 の場合には、プロバイオティクスの維持・改善効果があるとは言えないことを示した。 本研究のリミテーションは、使用した論文の臨床試験の対象者の年齢や実施国、さら には投与した菌種が異なるため、一様に議論を行うことが難しい。また、次に SPF マ ウスと GFマウスの腸管を用いた部位別のメタボローム解析と細菌叢解析を行い、腸 内のエコシステム内でどのような代謝物と細菌が存在するのか解析した。結果、メタ ボローム解析では、腸管の部位ごとに代謝物のプロファイルが大きく異なることを示 した。大きく変化していたアミノ酸のと糖のプロファイルを観察したところ、アミノ酸のプ ロファイルは部位ごとに大きな変化はなく、ほとんどのアミノ酸が同じ挙動を示した。 一方で、糖のプロファイルは、糖のサイズによって部位ごとに濃度が大きく変化してい ることが分かった。Contents
1. Introduction ... 1
1.1. Relationship between humans and bacteria ... 1
1.2. Objective... 4
2. The effects of probiotics on children with atopic dermatitis ... 5
2.1. Introduction ... 5
2.1.1. Atopic dermatitis ... 5
2.1.2. SCORAD ... 6
2.1.3. Probiotics, prebiotics, and synbiotics ... 7
2.1.4. Systematic review ... 7 2.2. Methods ... 9 2.2.1. Investigated papers ... 9 2.2.2. Statistical Analysis ... 10 2.3. Results ... 14 2.4. Discussion ... 26
3. Molecular approaches for understanding murinal intestinal microbiota profiles ... 31
3.1. Introduction ... 31
3.2. Material and Methods... 33
3.2.1. Experimental design ... 33
3.2.2. Sample collection and preparation for metabolome analysis ... 33
3.2.3. Instrument parameters for CE-TOFMS ... 36
3.2.4. LC-MS/MS Conditions ... 36
3.2.5. CE-TOFMS Conditions ... 37
3.2.6. Processing of metabolome data... 39
3.2.7. Metabolome data analysis... 39 3.2.8. DNA extraction, PCR amplification, and pyrosequencing of fecal samples
3.3.1. Characteristics of gastrointestinal luminal metabolites in SPF and GF
mice ……….42
3.3.2. Comparison of luminal metabolome profiles among each section of the gastrointestinal tracts ... 47
3.3.3. Comparison of gastrointestinal luminal metabolites between SPF and GF mice ……….53
3.3.4. Features of sugars and amino acids within the gastrointestinal lumen of SPF and GF mice ... 59 3.4. Discussion ... 65 4. Conclusion ... 69 Acknowledgements ... 76 References ... 80 Abbreviations ... 86
List of Tables
Table 2.1Checklist of CONSORT ... 12
Table 2.2Evidence table of review ... 17
Table 2.3CONSORT checklists for evaluating studies’ quality ... 19
Table 2.4Studies included in meta-analysis ... 23
Table 2.5Estimator of changes of SCORAD index mean ... 25
Table 3.1Characteristic luminal metabolites from each section of the gastrointestinal tract ……….57
List of Figures
Figure 1.1 The area of bacteria living ... 3
Figure 2.1 Evaluation sheet for SCORAD ... 13
Figure 2.2 Flow diagram of the process of selecting relevant trials ... 15
Figure 2.3 Includes the forest plots and statistics of shifts of SCORAD ... 24
Figure 3.1 Collected sample position of gastrointestinal tract ... 35
Figure 3.2 Luminal metabolome profiles of the gastrointestine in SPF and GF mice 44 Figure 3.3 Differences of metabolites kinds in SPF and GF mice ... 45
Figure 3.4 PCA of gastrointestinal luminal metabolome profiles in SPF and GF mice. ……….46
Figure 3.5 Differences in luminal metabolites among parts of the gastrointestinal tract in SPF and GF mice ... 52
Figure 3.6 OPLS-DA of the luminal metabolome profiles of the gastrointestine in SPF and GF mice ... 56
Figure 3.7 Composition of gastrointestinal microbiota in SPF mice ... 58
Figure 3.8 Clustered luminal carbohydrate profiles of the gastrointestine in SPF mice ……….61
Figure 3.9 Luminal carbohydrate profiles of the gastrointestine in SPF and GF mice 63 Figure 3.10 Luminal amino acid profiles of gastrointestine in SPF and GF mice ... 64
Figure 4.1 Outline of experiment ... 72
Chapter 1
1.
Introduction
1.1. Relationship between humans and bacteria
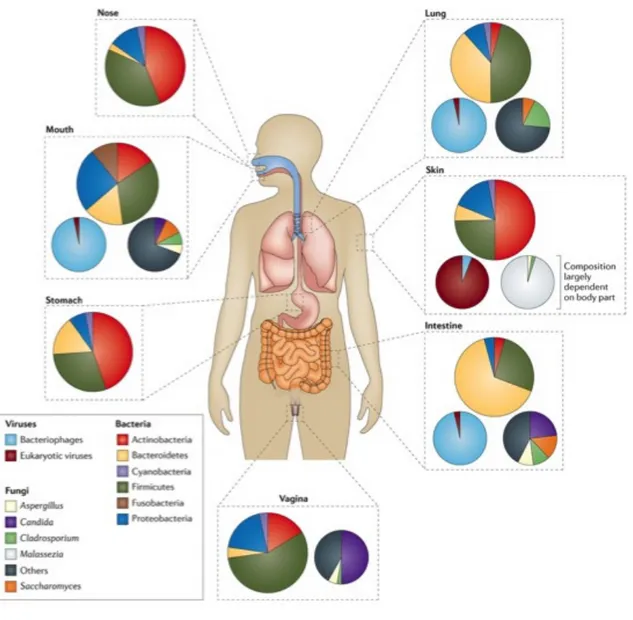
Bacteria are relevant and important to human life. Animals and plants coexist with bacteria in various ways. Animals retain bacteria on their skin to maintain the skin environment and within the intestinal tract for obtaining secondary metabolites such as vitamins (Figure 1.1). In addition, humans produce fermented food and drinks such as yogurt, miso, cheese, kimchi, wine and Japanese sake. The intestinal microbiota are a research target particularly in relation to the immune system and health. Some bacteria have functions in the management of the intestinal tract. The function is dependent on probiotics, prebiotics, and synbiotics. The most notable definition of probiotics is, “a live microbial feed supplement which beneficially affects the host animal by improving its intestinal microbial balance,” defined by Fuller (Fuller, 1989). Another notable definition states, “live micro-organisms which, when administered in adequate amounts, confer a health benefit on the host” as defined by FAO/WHO
prebiotics states, “a non-digestible food ingredient that beneficially affects the host by selectively stimulating the growth and/or activity of one or a limited number of bacteria in the colon” (Gibson and Roberfroid, 1995). Synbiotics is known as the mixture of probiotics and prebiotics.
Figure 1.1 The area of bacteria living
This figure show the area of human body where microbiota live. Large circles: Bacteria, Small circle right: Fungi, Small circles left: Viruses (Marsland and Gollwitzer, 2014)
1.2. Objective
As microbiota function, they have a relationship with the host through metabolites. In this study, the relationships among microbiota, their host and metabolites are analyzed from the viewpoint of molecular biology and public health to understand the effect of intestinal microbiota. In the first section, a systematic review and meta-analysis of the effect of probiotics on children with atopic dermatitis (AD) is conducted. The purpose of this systematic review and meta-analysis is to determine the effects of probiotics on AD children. In the second research study, a luminal metabolic evaluation for each part of the intestinal tract is performed to understand the differences among them. We measured the gastrointestinal luminal metabolites across different parts of the intestinal tract in specific-pathogen-free (SPF) and germ-free (GF) mice by using capillary electrophoresis time-of-flight mass spectrometry (CE-TOFMS) and liquid chromatography-tandem mass spectrometry (LC-MS/MS). The final research study aims to apply the previous study’s method (Stein et al., 2013) to this experimental data to understand the relationship between bacteria.
Chapter 2
2.
The effects of probiotics on children with
atopic dermatitis
2.1. Introduction 2.1.1.Atopic dermatitis
Atopic dermatitis (AD) is one of the most pervasive chronic allergic diseases with itching and redness (Kay et al., 1994). One of the features of this disease is that its prevalence in children is higher than that of adults. It is known that up to 10–20% of children and 1-3% of adults have AD in Europe (Leung and Bieber, 2003). Although many causes have been speculated for AD, including genetic factors, environmental factors, nutrition and intestinal microbiota, the mechanism of this disease is still unclear. As a genetic factor, it has been reported that the genetic mutation of filaggrin may cause the underlying symptoms of AD, while reducing the barrier function of the skin (Hoffjan and Stemmler, 2015). Filaggrin is an essential protein for skin barrier function, in particular, the formation of a horny layer. When the skin barrier becomes
to be one of the causes of AD. Intestinal microbiota are bacteria that live inside animal intestinal tracts, and support the host’s digestive function, and provide nutrition by producing secondary metabolites, as well as maintaining the homeostasis of the host’s intestinal tract (Holmes et al., 2012). Additionally, it became clear that there are relationships between intestinal microbiota and some diseases, including AD (Björkstén et al., 1999; 2001; Kalliomäki et al., 2001).
2.1.2.SCORAD
The primary outcome was the change of SCORAD index (STALDER and TAIEB, 1993) from baseline to post-treatment. SCORAD, which was evaluated by 10 trained clinicians, is the major index for evaluating AD symptoms (Figure 2.1). The worst symptom corresponds to 103 points, and this score is evaluated from by extent, intensity and subjective. The severity of symptom is categorized into six fields: erythema, edema/papulation, oozing/crusts, excoriations, lichenification, and dryness. Considering the characteristic of AD symptom, the score weighting is different between under/over two years.
2.1.3.Probiotics, prebiotics, and synbiotics
Microbiota is used as probiotics for improving our health. The most notable definition of probiotics is, “a live microbial feed supplement which beneficially affects the host animal by improving its intestinal microbial balance,” defined by Fuller (Fuller, 1989). Another notable definition states, “live micro-organisms which, when administered in adequate amounts, confer a health benefit on the host” as defined by FAO/WHO (Group, 2002). Two widely known terms that are also related to probiotics are prebiotics and synbiotics (Schrezenmeir and de Vrese, 2001). One definition of prebiotics states, “a non-digestible food ingredient that beneficially affects the host by selectively stimulating the growth and/or activity of one or a limited number of bacteria in the colon” (Gibson and Roberfroid, 1995). Synbiotics is known as the mixture of probiotics and prebiotics.
2.1.4.Systematic review
For a given research target, a variety of approaches and techniques are used for investigation; however, the quality of researches is dependent upon the study design.
to a medical condition by comparing groups differing in outcome, retrospectively. On the other hand, cohort study compares outcome of two groups differing in condition by following them for a certain period of time. In addition to these designs, there is other kind of study known as intervention study. This study has two methods, nonrandomized and randomized control trials (RCT). A randomized control trial produces more quality data considering its lack of subject bias.
Furthermore, systematic review is one of the highest quality research methods used to collect and examine research data. Systematic review is different from conventional reviews at the point that evaluation is systematically conducted. Systematic review is an essential process of evidence-based medicine. The method for integrating this data and evaluating the result is called meta-analysis (Sacks et al., 1987). Meta-analysis enables to overcome the problem of subject size and the obstacle of bias among clinical trials. Summarizing the relation between outcomes of clinical trials related to AD children and probiotics is important for understanding the effect of probiotics and their mechanisms. Recently, Kim reported a meta-analysis for the relationship between AD and the effect of probiotics (Kim et al., 2014). They
moderating severe AD in patients of all ages. However, as the interaction with the host intestinal environment was not considered, the children and home country were focused on in order to take into account the diversity of host intestinal microbiota. The children’s profiles have less diversity than the adults’ profiles (Kostic et al., 2013). The purpose of this systematic review and meta-analysis was to determine the effects of probiotics on AD children.
2.2. Methods
2.2.1.Investigated papers
PubMed and Cochrane Library were searched in June of 2015 with the following keywords: “Dermatitis, Atopic”[Mesh] OR atopic dermatitis AND
“Probiotics”[Mesh], OR “Lactobacillus”[Mesh], OR “Bifidobacteriales
Infections”[Mesh], OR “Lactococcus”[Mesh], OR “Saccharomyces”[Mesh], OR
“ Streptococcus thermophilus ” [Mesh], OR “ Bacillus Subtilis ” [Mesh], OR
“Enterococcus faecalis”[Mesh], OR “Clostridium”[Mesh].The type of article was
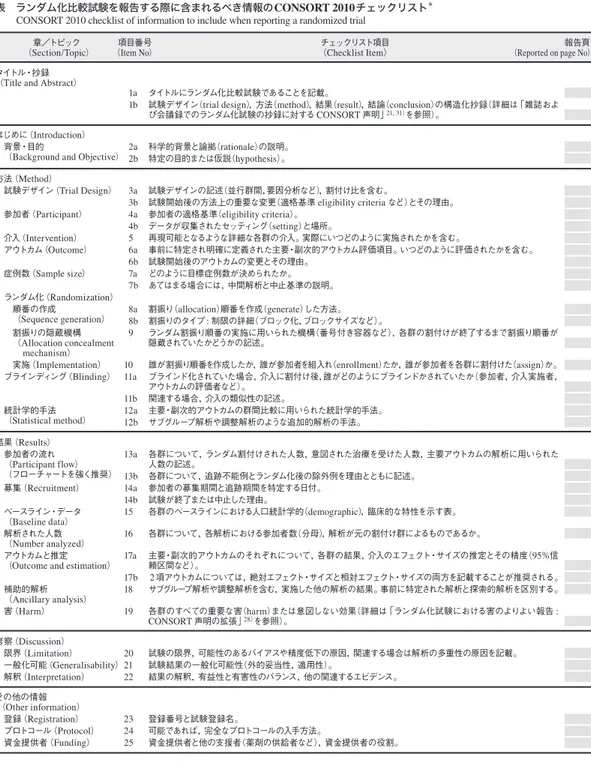
written in English. Excluded (1) cases in which intervention was conducted by using prebiotics or synbiotics, (2) cases in which the main target was an allergy such as food allergy. WHO’s definition of probiotics was used for this study, and if indigestible sugar or fibers were included as part of the intervention, these were regarded as prebiotics. Before conducting the meta-analysis, the article qualities were checked using CONSORT (Moher et al., 2010)(Table 2.1) to compare the quality of the RCTs. The nine studies that satisfied these requirements included crossover trials. When the quality of an article is checked, CONSORT does not accept crossover trials; however, CONSORT was used because the checklist for crossover trials has not yet published.
2.2.2.Statistical Analysis
The primary outcome was the change of SCORAD index (STALDER and TAIEB, 1993) from baseline to post-treatment. SCORAD index is the major index for evaluating AD symptoms (Figure 2.1). A small index size indicated that the symptom was mild, and a large index size indicated that the symptom was severe. In order to combine the results from these RCTs, the standard deviation (S.D.) of each study was
in both group control and intervention. Data syntheses were based upon, either the fixed or the random effect model, according to the extent of heterogeneity (p-value of Cochrane Q-test < 0.05). All of the statistical analyses were performed by R 3.1.2 (R Foundation for Statistical Computing, Vienna, Austria. http://www.r-project.org/index.html). A two sided p-value < 0.05 was set as the significant level.
Table 2.1 Checklist of CONSORT !"#$%&'(&)*+,%-'!"#$%&'!"#$!" !"#!!!"#"
表 ランダム化比較試験を報告する際に含まれるべき情報のCONSORT 2010チェックリスト*
CONSORT 2010 checklist of information to include when reporting a randomized trial
*本声明は,各項目についての重要な解説を記載したCONSORT 2010解説と詳細13)とともに用いることを強く推奨する。クラスターラン ダム化比較試験11),非劣性・同等性試験12),非薬理学的治療32),ハーブ療法33),実用的試験34)については,CONSORT声明拡張版を推 奨する。そのほかの拡張版も近日発表予定(それらと本チェックリスト関連の最新情報はwww.consort-statement.orgを参照)。 章/トピック (Section/Topic) タイトル・抄録
(Title and Abstract)
はじめに(Introduction)
背景・目的
(Background and Objective)
方法(Method) 試験デザイン(Trial Design) 参加者(Participant) 介入(Intervention) アウトカム(Outcome) 症例数(Sample size) ランダム化(Randomization) 順番の作成 (Sequence generation) 割振りの隠蔵機構 (Allocation concealment mechanism) 実施(Implementation) ブラインディング(Blinding) 統計学的手法 (Statistical method) 結果(Results) 参加者の流れ (Participant flow) (フローチャートを強く推奨) 募集(Recruitment) ベースライン・データ (Baseline data) 解析された人数 (Number analyzed) アウトカムと推定
(Outcome and estimation)
補助的解析 (Ancillary analysis) 害(Harm) 考察(Discussion) 限界(Limitation) 一般化可能(Generalisability) 解釈(Interpretation) その他の情報 (Other information) 登録(Registration) プロトコール(Protocol) 資金提供者(Funding) 項目番号 (Item No) 1a 1b 2a 2b 3a 3b 4a 4b 5 6a 6b 7a 7b 8a 8b 9 10 11a 11b 12a 12b 13a 13b 14a 14b 15 16 17a 17b 18 19 20 21 22 23 24 25 チェックリスト項目 (Checklist Item) タイトルにランダム化比較試験であることを記載。
試験デザイン(trial design),方法(method),結果(result),結論(conclusion)の構造化抄録(詳細は「雑誌およ び会議録でのランダム化試験の抄録に対するCONSORT声明」21, 31)を参照)。 科学的背景と論拠(rationale)の説明。 特定の目的または仮説(hypothesis)。 試験デザインの記述(並行群間,要因分析など),割付け比を含む。 試験開始後の方法上の重要な変更(適格基準 eligibility criteria など)とその理由。 参加者の適格基準(eligibility criteria)。 データが収集されたセッティング(setting)と場所。 再現可能となるような詳細な各群の介入。実際にいつどのように実施されたかを含む。 事前に特定され明確に定義された主要・副次的アウトカム評価項目。いつどのように評価されたかを含む。 試験開始後のアウトカムの変更とその理由。 どのように目標症例数が決められたか。 あてはまる場合には,中間解析と中止基準の説明。 割振り(allocation)順番を作成(generate)した方法。 割振りのタイプ: 制限の詳細(ブロック化,ブロックサイズなど)。 ランダム割振り順番の実施に用いられた機構(番号付き容器など),各群の割付けが終了するまで割振り順番が 隠蔵されていたかどうかの記述。 誰が割振り順番を作成したか,誰が参加者を組入れ(enrollment)たか,誰が参加者を各群に割付けた(assign)か。 ブラインド化されていた場合,介入に割付け後,誰がどのようにブラインドかされていたか(参加者,介入実施者, アウトカムの評価者など)。 関連する場合,介入の類似性の記述。 主要・副次的アウトカムの群間比較に用いられた統計学的手法。 サブグループ解析や調整解析のような追加的解析の手法。 各群について,ランダム割付けされた人数,意図された治療を受けた人数,主要アウトカムの解析に用いられた 人数の記述。 各群について,追跡不能例とランダム化後の除外例を理由とともに記述。 参加者の募集期間と追跡期間を特定する日付。 試験が終了または中止した理由。 各群のベースラインにおける人口統計学的(demographic),臨床的な特性を示す表。 各群について,各解析における参加者数(分母),解析が元の割付け群によるものであるか。 主要・副次的アウトカムのそれぞれについて,各群の結果,介入のエフェクト・サイズの推定とその精度(95%信 頼区間など)。 2項アウトカムについては,絶対エフェクト・サイズと相対エフェクト・サイズの両方を記載することが推奨される。 サブグループ解析や調整解析を含む,実施した他の解析の結果。事前に特定された解析と探索的解析を区別する。 各群のすべての重要な害(harm)または意図しない効果(詳細は「ランダム化試験における害のよりよい報告: CONSORT声明の拡張」28)を参照)。 試験の限界,可能性のあるバイアスや精度低下の原因,関連する場合は解析の多重性の原因を記載。 試験結果の一般化可能性(外的妥当性,適用性)。 結果の解釈,有益性と有害性のバランス,他の関連するエビデンス。 登録番号と試験登録名。 可能であれば,完全なプロトコールの入手方法。 資金提供者と他の支援者(薬剤の供給者など),資金提供者の役割。 報告頁 (Reported on page No)
2.3. Results
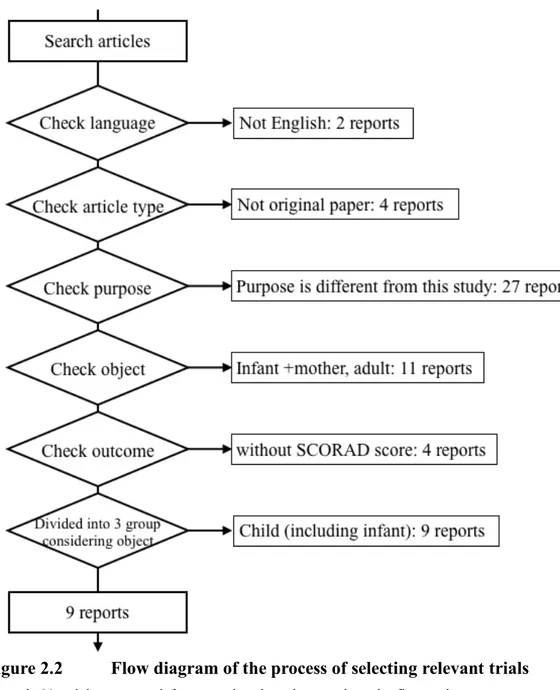
Sixty-four trials were identified in total from PubMed and Cochrane Library, and nine RCTs were included in the meta-analysis (Figure 2.2, Supplementary List 1: http://tinyurl.com/znrpexg). 2 studies not written in English were excluded, 4 studies that were not original papers and 27 studies that differed from our purpose. Finally, 24 studies were separated into three groups, infant and mother, child, and adult. Thirteen studies categorized into the child group included 2 studies focused on infants. It is known that the profile of intestinal microbiota differs between neonates and infants, so 2 studies were excluded from the child group. Additionally, the outcome of 2 studies did not employ the SCORAD index. Although a hand search was performed for references from these nine articles, no articles satisfied the requirement (Supplementary List 2: http://tinyurl.com/hmgmjm5).
Figure 2.2 Flow diagram of the process of selecting relevant trials
The summary of these 9 studies is shown in Table 2.2. The maximum and minimum intervention terms were six months and six weeks, respectively. There were two types of interventions, powder and capsule. When prescribed the powder, the amount and type of liquid were limited. Thirteen species of intestinal microbiota were used as probiotics. Probiotics were composed of one specific species of bacteria in five studies and two species of bacteria in four other studies. Bacteria from the
Lactobacillus genus were used as probiotics in all the nine studies. The most frequently used bacteria in these studies were the Lactobacillus rhamnosus strain GG (LGG). The minimum amount of bacteria was 1×10⁹ Count-Forming Units (CFU), twice a day,
and the maximum amount of bacteria was 2×10¹⁰ CFU / g once a day. In these studies,
allergy existence was also considered as baseline data, along with personal data. As usual, a steroid was used as a main treatment. Although the amount of steroid was limited, steroid uses in these studies were permitted. Within these nine studies, four studies showed improvement of the symptom outcome, and the other five studies showed no improvement. In addition, the four studies showing the effects of probiotics were focused on children > 6 months.
Table 2.2 Evidence table of review
Outcome A: molecular outcome, B: microbial outcome,C: Symptom outcome. W: written, I: ineffective, E: effective
Molecular outcome represented as amount of IgA. Microbial outcome included amount of microbial population. Symptom outcome included SCORAD index.
Article Study size Duration Proviotics Amount Intervention term (weeks)
Follow up (weeks)
Outcome A B C 1 Fölster-Holst 2006 et al n = 53 1-55 months Lactobacillus rhamnosus strain GG 5×10⁹CFU, twice/day 8 4 W I
2 Gore 2011et al n = 208 3-6 months Lactobacillus paracaseBifidobacterium lactis CNCM I-3446i CNCM I-2116 1×10¹⁰CFU, everyday 12 3 years W I
3 Nermes 2010et al n = 39 2.2-13 months Lactobacillus rhamnosus strain GG ATCC 53103 3.4×10⁹CFU, everyday 12 - W W I
4 Weston 2005et al n = 56 6-18 months Lactobacillus fermentum VRI-033 PCC 1×10⁹CFU, twice/day 8 8 W E
5 Rose 2010et al n = 121 6-24 months Lactobacillus rhamnosus strain GG ATCC 53103 1×10¹⁰CFU, twice/day 6 6 W I
6 Larsen 2011et al n = 50 7-24 months Lactobacillus acidophilusBifidobacterium animalis NCFM ATCC SD5220 subsp. lactis Bi-07 1×10¹⁰CFU, everyday 8 - W E
7 Sistek 2006et al n = 59 1-10 years Lactobacillus rhamnosus Bifidobacteria lactis Total 2×10¹⁰CFU/g, everyday 12 4 E
8 Han 2012et al n = 118 1-13 years Lactobacillus plantarum CJLP133 5×10⁹CFU, twice/day 16 2 W E
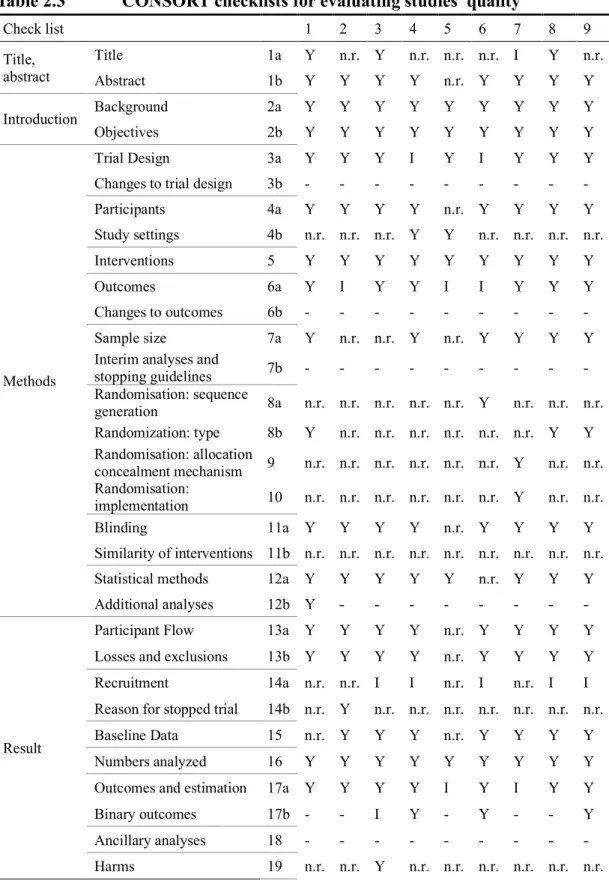
After screening, an evaluation on the quality of RCTs was conducted (Table 2.3). Only five studies within the nine studies estimated the 95% confidence interval (CI) within the SCORAD index. Weston’s study reported statistic results and baseline data separately; therefore, these two reports were used for evaluation. As a result, no studies significantly lacked the necessary data. For this reason, sub-group analysis was not conducted in this study.
Table 2.3 CONSORT checklists for evaluating studies’ quality Check list 1 2 3 4 5 6 7 8 9 Title, abstract Title 1a Y n.r. Y n.r. n.r. n.r. I Y n.r. Abstract 1b Y Y Y Y n.r. Y Y Y Y Introduction Background 2a Y Y Y Y Y Y Y Y Y Objectives 2b Y Y Y Y Y Y Y Y Y Methods Trial Design 3a Y Y Y I Y I Y Y Y Changes to trial design 3b - - - - Participants 4a Y Y Y Y n.r. Y Y Y Y Study settings 4b n.r. n.r. n.r. Y Y n.r. n.r. n.r. n.r. Interventions 5 Y Y Y Y Y Y Y Y Y Outcomes 6a Y I Y Y I I Y Y Y Changes to outcomes 6b - - - - Sample size 7a Y n.r. n.r. Y n.r. Y Y Y Y Interim analyses and
stopping guidelines 7b - - - - Randomisation: sequence generation 8a n.r. n.r. n.r. n.r. n.r. Y n.r. n.r. n.r. Randomization: type 8b Y n.r. n.r. n.r. n.r. n.r. n.r. Y Y Randomisation: allocation concealment mechanism 9 n.r. n.r. n.r. n.r. n.r. n.r. Y n.r. n.r. Randomisation: implementation 10 n.r. n.r. n.r. n.r. n.r. n.r. Y n.r. n.r. Blinding 11a Y Y Y Y n.r. Y Y Y Y Similarity of interventions 11b n.r. n.r. n.r. n.r. n.r. n.r. n.r. n.r. n.r. Statistical methods 12a Y Y Y Y Y n.r. Y Y Y Additional analyses 12b Y - - - -
Result
Participant Flow 13a Y Y Y Y n.r. Y Y Y Y Losses and exclusions 13b Y Y Y Y n.r. Y Y Y Y Recruitment 14a n.r. n.r. I I n.r. I n.r. I I Reason for stopped trial 14b n.r. Y n.r. n.r. n.r. n.r. n.r. n.r. n.r. Baseline Data 15 n.r. Y Y Y n.r. Y Y Y Y Numbers analyzed 16 Y Y Y Y Y Y Y Y Y Outcomes and estimation 17a Y Y Y Y I Y I Y Y Binary outcomes 17b - - I Y - Y - - Y Ancillary analyses 18 - - - -
Y: Written, I: Written partially, n.r.: Not reported, -: Not reported (not necessary) 1-9: Corresponded to the article’s number from Table 2.2
Discussion Limitations 20 Y n.r. Y Y Y Y n.r. n.r. Y Generalizability 21 Y Y Y Y n.r. n.r. n.r. Y Y Interpretation 22 Y Y Y Y Y Y Y Y Y Other information Registration 23 Y Y n.r. Y n.r. n.r. Y n.r. n.r. Protocol 24 n.r. n.r. n.r. n.r. n.r. n.r. n.r. n.r. n.r. Funding 25 Y Y Y Y Y Y Y Y Y
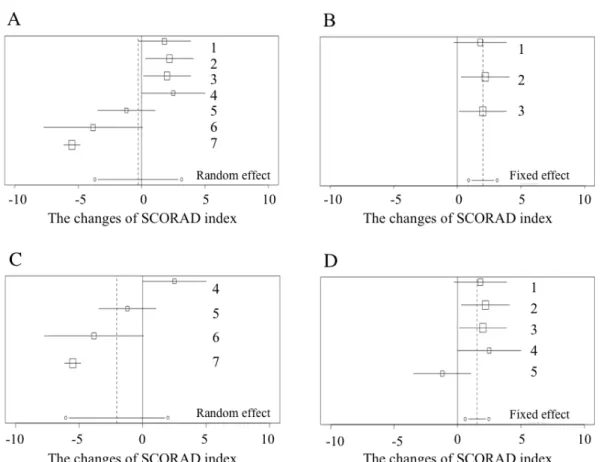
Although the nine studies were included for evaluation, only five studies were used for meta-analysis (Table 2.4, Figure 2.3A) due to the limitation of statistical data. Four studies were not sufficiently significant to mention the results of their SCORAD index. Figure 2.3 shows the results of meta-analysis based on the changes of SCORAD index. Although heterogeneity was large in a randomized effect model, meta-analysis of entire studies did not show a significant decrease in the SCORAD index within the probiotics group compared to that within the control group (estimator: -0.27, 95% CI: -3.69 to 3.15, p = 0.88; Table 2.5, Figure 2.3A). This 95% CI was extended across 0; therefore, the effect of probiotics was not observed in this meta-analysis. Additionally, Han’s study was the only study showing the effects of probiotics for AD, and there were no commonalities between other studies in terms of probiotics type, intervention term, or patients.
Next, sub-group analysis was conducted by age group. These nine studies were separated by the patients age, which was six months (Figure 2.3B).The heterogeneity of studies that focused on children < 6 months was small (p = 0.96). As the result of sub-group analysis, the estimator of SCORAD was 2.01 (95% CI: 0.89 to
was large (p < 0.001). As the result of sub-group analysis, the estimator of SCORAD was -2.04 (95% CI: - 6.06 to 1.99, p = 0.32; Table 2.5, Figure 2.3C) and the effects of probiotics in decreasing the index are shown (Figure 2.3C). 95% CI was extended across 0; therefore, the effects of probiotics were not shown in this sub-group analysis. As the other sub-group analysis, the patient’s country of origin was focused on. In this analysis, it was found that the studies conducted in Europe showed a similar result among each trial (Figure 2.3D). The heterogeneity of the sub-group analysis was not significant (p = 0.14). As the result of sub-group analysis, the estimator of SCORAD was 1.53 (95% CI: 0.60 to 2.47, p < 0.001; Table 2.5, Figure 2.3D) and the effects of probiotics in significantly increasing the index were shown. As the result of these sub-group analyses, the common factor toward showing large heterogeneity came from including Han and Sistek’s studies
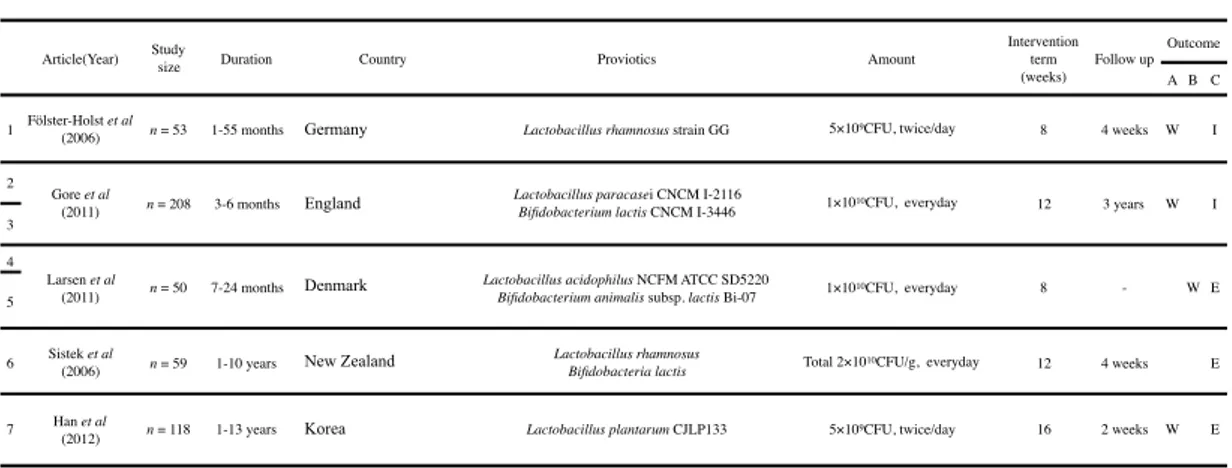
Table 2.4 Studies included in meta-analysis
Article(Year) Studysize Duration Country Proviotics Amount
Intervention term (weeks) Follow up Outcome A B C
1 Fölster-Holst (2006)et al n = 53 1-55 months Germany Lactobacillus rhamnosus strain GG 5×10⁹CFU, twice/day 8 4 weeks W I 2
Gore et al
(2011) n = 208 3-6 months England
Lactobacillus paracasei CNCM I-2116
Bifidobacterium lactis CNCM I-3446 1×10¹⁰CFU, everyday 12 3 years W I 3
4
Larsen et al
(2011) n = 50 7-24 months Denmark
Lactobacillus acidophilus NCFM ATCC SD5220
Bifidobacterium animalis subsp. lactis Bi-07 1×10¹⁰CFU, everyday 8 - W E 5
6 Sistek et al
(2006) n = 59 1-10 years New Zealand
Lactobacillus rhamnosus
Bifidobacteria lactis Total 2×10¹⁰CFU/g, everyday 12 4 weeks E
Figure 2.3 Includes the forest plots and statistics of shifts of SCORAD
A-D: Left side means negative and right side means positive. The horizontal axis shows the estimator of changes of SCORAD index mean and the box size depends on the size of population. Dotted line indicates the estimator of statistical model. (A) All, (B) < 6months, (C) > 6 months, (D) Europe.
Table 2.5 Estimator of changes of SCORAD index mean
Object Included trial numbers F/R Estimator (P-value) 95% CI (Estimator) Heterogeneity P-value A All 7 R -0.27 (P = 0.88) - 3.69 / 3.15 < 0.001 B < 6 months 3 F 2.01 (P < 0.001) 0.89 / 3.13 0.96 C > 6 months 4 R -2.04 (P = 0.32) - 6.06 / 1.99 < 0.001 D Europe 5 F 1.5341
(P = 0.001) 0.60 / 2.47 0.14 F: Fixed effect, R: Random effect
2.4. Discussion
In this study, meta-analyses was conducted and reviewed papers included five trials considering age and country region. Five trials conducted in Europe were gathered as one sub-group. The result of the sub-group analysis showed that the symptoms became worse when the European AD children took probiotics. The heterogeneity of these data was large and 95% CI was extended across 0, even when using a randomized effect model. This result suggests that it is difficult to conclude if the probiotics had an effect on AD children, as this result is consistent with Kim’s previous research (Kim et al., 2014). Björkstén reported that the amount of Enterococcus and Bifidobacterium
was significantly small between one-month-old and one-year-old AD children’s intestinal tract (Björkstén et al., 2001), as it is said that probiotics rearrange the profiles of intestinal microbiota and suppress symptoms. Although the method of treatment was discussed, the effect was not clearly shown in the case of AD. There remains causal ambiguity, as many reports and books do not refer to the effect of probiotics for AD, and the effects were dependent on each clinical trial (Van Der Aa et al., 2010). The reasons for variation in the effects of bacteria on patients were thought to
features of intestinal microbiota were dependent on kinds and strains, which served to produce the disparity in data regarding the effect of these microbiota.
LGG, used in many reports, was bacillus and produced lactate. It was reported to give benefits for hosts and resistance to stomach acid and bile acid. Unfortunately, the trials that used LGG had the following three results: probiotics had effects, no effects were observed, and unclear. Therefore, LGG’s effects as probiotics are still unclear. In addition, some trials did not refer to the strain of bacteria, and because the species were different among these trials, it is difficult to discuss the effect of the probiotics.
Sub-analysis was conducted according to the patient’s age and country, which were thought to be a cause of heterogeneity. In the case of sub-group analysis including trials with patient age < 6 months, the changes in SCORAD index increased. This suggested that the probiotics did not have the effect of suppressing the AD symptoms, as AD became worse. In the case of sub-group analysis including trials with object age > 6 months, the heterogeneity was small and the changes in SCORAD index did not increase. This suggested that probiotics had the effect of suppressing the AD
depend on the host intestinal environment and immune system. It is known that the host microbial profiles change relative to the host age, and it was reported that aerobic bacteria increased first, followed by anaerobic bacteria that increased through oxygen consumption, as reported by the study focused on the host’s growth (Turroni et al., 2012). Smith reported that microbial patterns were almost the same and not dependent on the host animal (Smith, 1965).
Additionally, the result of sub-group analysis considering the patient’s country showed that the heterogeneity was small. The changes in SCORAD index increased. Comparing the heterogeneity of meta-analysis including whole trials and analysis by considering the country, the size of heterogeneity decreased. This sub-group segmentation, which considered patient country regions, was different from Kim’s research, and suggested that the country regions are a possible factor in changing the size of heterogeneity. Considering the results of the sub-group analysis, it seems that one of the causes for effects of bacteria on patients was the host intestinal environment. There were already some reports focused on the relationship among the microbial profiles, diet, and country, and the intestinal microbial profiles were divided
digest seaweed such as laver (Hehemann et al., 2010).The country region and race are important factors in understanding the details of systems related to intestinal microbiota.
There were some similarities within the large heterogeneity. For example, when data were integrated and the heterogeneity was large, studies by Han and Sistek were included for analysis. From this result, it was suggested that these two trials most directly affected the size of heterogeneity. These two trials were difficult to integrate because there were many discrepancies in the data, because the reliability was low, as the countries in which the trials were performed were Korea and New Zealand.
Lactobacillus plantarum CJLP133, used in Han’s study, was isolated from Kimchi and
suggested to control the immune system (Lee et al., 2011). In addition, this strain was also reported to have the effect of suppressing AD in an AD mouse by oral intervention (Won et al., 2011). This strain also demonstrated the effect of curing dermatitis-like AD by inducing house dust and mites on an NC/Nga mouse (Won et al., 2012).
In summary, clinical trials that focused on the effects of probiotics on infant AD were screened systematically. Among these studies, the differences of patient age
well as the differing dynamics of microbial profiles, which proved to be a major limitation of this study. As the number of trials using the same strain of probiotics increases around the world, it will become easier to analyze and discuss the effect of probiotics. In addition, the effect of host microbial profiles was considered in this study; therefore, it is important to focus on these profiles, as well as changes to the host environment.
Chapter 3
3.
Molecular approaches for understanding
murinal intestinal microbiota profiles
3.1. Introduction
Intestinal microbiota mainly refer to the bacteria inhabiting the intestinal tract of mammals; these bacteria support various functions in the host ranging from digestion to the maintenance of a robust immune function (Holmes et al., 2012). Recently, there have been many reports regarding the metabolites secreted by intestinal microbiota. For example, Japanese people possess specific bacteria that have the necessary gene for digesting laver and soft seaweed (Hehemann et al., 2010). Intestinal microbiota have also been reported in relation to host diseases such as obesity (Ridaura et al., 2013; Turnbaugh et al., 2006), diabetes (Forslund et al., 2015; Le Chatelier et al., 2013; Qin et al., 2012), atherosclerosis (Koeth et al., 2013; Wang et al., 2011; 2016), atopic dermatitis (Björkstén et al., 1999; 2001; Kalliomäki et al., 2001), immune system disorders (Cahenzli et al., 2013; Thorburn et al., 2015), and brain function disorders
within each section of the intestinal tract and dependent on its corresponding function. In the case of humans, Lactobacillus accounts for a large percentage of microbes within the stomach, and Enterobacteriaceae spp. and Bacteroides are observed at high levels in the upper small intestine. In the lower small intestine, Bifidobacterium spp. and Enterococcus spp. exist at a high percentage. Additionally, Enterococcus spp.
Enterobacteriaceae spp., Clostridium spp., and Bacteroides spp. are observed at a high percentage within the cecum and colon (Metges, 2000). Although there are many reports focused on the differences among varying parts of the intestine, these reports primarily focused on the stomach, cecum and colon or only included information solely about either the metabolite or microbial profile (Devaraj et al., 2013; Gu et al., 2013; Matsumoto et al., 2012; Tian et al., 2012). In reports that focused on the intestinal differences with regard to location, pyrosequencing was used to evaluate the differences in intestinal contents derived from the stomach, the three parts of the small intestine, the cecum, the colon and fecal samples. However, metabolome profiling throughout the gastrointestinal tract has not been conducted. Therefore, in this study, we performed luminal metabolic evaluation for each section of the intestinal tract to
specific-pathogen-free (SPF) and germ-free (GF) mice using capillary electrophoresis time-of-flight mass spectrometry (CE-TOFMS) and liquid chromatography-tandem mass spectrometry (LC-MS/MS).
3.2. Material and Methods 3.2.1.Experimental design
The animal experiment was performed using protocols approved by Central Institute for Experimental Animals (CIEA) (Tokyo, Japan). Germ-free (GF) male C57BL/6J mice and specific pathogen-free (SPF) male mice were purchased from CIEA Japan Inc. These GF mice were maintained in germ-free isolators at CIEA during experiment. GF and SPF mice were housed individually in each cage and fed with normal diet (CA-1, CIEA Japan) ad libitum. Diet and water were both irradiated and autoclaved. Ethics numbers were 09043 and 12036.
3.2.2.Sample collection and preparation for metabolome analysis
upper colon (Co1) and lower colon (Co2) (Figure 3.1). Intestinal contents were stored at -80°C until use. Extraction for intestinal metabolites was as described previously with slight modifications (Nagao-Kitamoto et al., 2016). Intestinal contents were run with 1 mL of 0.957 mM PBS contained 200 mM of internal standards (methionine sulfone and D-camphor-10-sulfonic acid) for metabolome analysis by using syringe. 500 µL of sample solution was mixed with 500 µL of 100% methanol, then vortexed with 100 mg of 0.1 mm zirconia beads. The contents were centrifuged at 14,000 g for 5 min. Supernatant was transferred to a centrifugal filter tube (UltrafreeMC-PLHCC 250/pk for Metabolome Analysis, Human Metabolome Technologies) to remove protein and lipid molecules, and then centrifuged at 4,600 x g for 3 hours at 25 °C. Filtrates were centrifugally concentrated and dissolved in 30 µL of ultrapure water including reference compounds (200 µM each of 3-aminopyrrolidine and trimesic acid) immediately before capillary electrophoresis with electrospray ionization CE-TOFMS analysis. Concentrations of sugars in samples were determined by LC-MS/MS in negative multiple reaction monitoring mode on an API3000 triple quadrupole mass spectrometer (AB Sciex). All of LC-MS/MS data were acquired
Figure 3.1 Collected sample position of gastrointestinal tract
Intestinal tract was separated some parts. Samples were obtained from colored parts. Red and blue indicate SPF and GF mice, respectively. Left side shows head and right side shows tail. St: stomach, Si1: upper small intestine, Si2: lower small intestine, Ce: cecum, Co1: upper colon, Co2: lower colon.
Head Tail
St Si1 Si2 Ce Co1 Co2
St Si1 Si2 Ce Co1 Co2 SPF
3.2.3.Instrument parameters for CE-TOFMS
Metabolome analysis was conducted as described previously with some modifications (Sugimoto et al., 2010). All CE-TOFMS experiments were based on Agilent CE capillary electrophoresis system (Agilent Technologies, Waldbronn, Germany), an Agilent G3250 AA LS/MSD TOF system (Agilent Technologies, Palo Alto, CA), an Agilent 1100 series binary HPLC pump which delivers sheath liquid, a G1603A Agilent CE–MS adapter kit, and a G1607A Agilent CE-ESI-MS sprayer kit (Agilent Technologies, Waldbronn, Germany). The CE-MS adapter kit included a capillary cassette that facilitates thermostatting of the capillary. The CE-ESI-MS sprayer kit simplifies the connecting CE system and the MS system, which were equipped with an electrospray ionization source. For system control and data acquisition, G2201AA Agilent Chem-Station software for CE and Analyst QS software for TOFMS were used.
3.2.4.LC-MS/MS Conditions
retained at 99% until 23 minutes. The flow rate used was 0.2 ml/min and the injection volume was 1 µl as described previously (Sugimoto et al., 2012).
3.2.5.CE-TOFMS Conditions
The CE-TOFMS conditions were as described previously with slight modification (Sugimoto et al., 2010). In the case of anionic metabolites, a commercially available COSMO(+) capillary (50 µm i.d. × 110 cm) (Nacalai Tesque, Kyoto, Japan), chemically coated with a cationic polymer, was used as the separation capillary. A 50 mM ammonium acetate solution (pH 8.5) was the electrolyte for CE separation. A new capillary was flushed successively with the running electrolyte, 50 mmol/L acetic acid (pH 3.4), and then the electrolyte again for 10 min each. Before each injection, the capillary was equilibrated for 2 min by flushing with 50 mM acetic acid (pH 3.4) and then for 5 min by flushing with the running electrolyte. In the case of cationic metabolites, fused-silica capillaries (50 µm i.d. × 100 cm total length) filled with 1 mol/L formic acid as the reference electrolyte was used as the separation capillary. After preparation the capillaries, sample solutions (30 nL) were injected at 50 mbar
below 5°C. The sheath liquid, composed of methanol/water (50% v/v) and 0.1 µmol/L hexakis (2,2-difluoroethoxy) phosphazene (Hexakis), was delivered at 10 µL/min. ESI-TOF-MS was conducted in the positive ion mode and 5 mM ammonium acetate (50% v/v) methanol/water containing 0.1 µM Hexakis was derived at 10 µL/min in negative ion mode. The capillary voltage was set at 4 kV and 3500V, for cationic and anionic metabolites, respectively. In TOF-MS, the fragmenter, skimmer, and OCT RF voltage were set at 75, 50, and 125 V, respectively in positive ion mode, and at 100, 50, and 200 V, respectively in negative ion mode. A flow rate of drying nitrogen gas (heater temperature = 300°C) was maintained at 10 L/min. In the case of positive ion mode, automatic recalibration of each acquired spectrum was performed using reference masses of reference standards ([13C isotopic ion of protonated methanol
dimer (2MeOH + H)]+, m/z 66.06371) and ([protonated Hexakis (M + H)]+, m/z 622.02896). In the case of negative ion mode, automatic recalibration of each acquired spectrum was performed using reference masses of reference standards ([13C isotopic
ion of deprotonated acetic acid dimer (2CH3COOH - H)]-, m/z 120.03841), and
of detected peaks was performed according to the m/z value and normalized migration time.
3.2.6.Processing of metabolome data
Raw data were analyzed with our proprietary software: MasterHands (Sugimoto et al., 2010). Data were processed with noise-filtering, baseline correction, peak detection, and integration of the peak area from sliced electropherograms (m/z 0.02 width). Subsequently, the accurate m/z value for each peak detected within the time domain was calculated with Gaussian curve-fitting to the peak along the m/z axis. Spike noise, CE-specific noise showing small and narrow peaks, and low-quality (not peak-like shape) results were also removed. For the remaining features, metabolite identities were assigned by matching their m/z values and migration times with those of standard compounds.
3.2.7.Metabolome data analysis
K-means analysis, respectively. Metabolic pathway analysis was performed according to Kyoto Encyclopedia of Genes and Genomes (KEGG) and significant metabolites with p-value lesser than 0.1 were analyzed by MetaCore.
3.2.8.DNA extraction, PCR amplification, and pyrosequencing of fecal samples DNA extraction was described as previously with slight modifications (Kato et al., 2014). Freeze-dried fecal samples were homogenized with mixture buffer [200 µL 10% SDS/TE, 200 µL 3M NaAc and 400µL phenol/chloroform/IAA] at 1,500 rpm for 5 min at 4°C and then centrifuged at 14,000 rpm for 5 min at 4°C. After transferring supernatant into new tubes and adding 400 µL phenol chloroform/IAA and vortexed for 1 min. Samples were then centrifuged at 14,000 rpm for 10 min at 4°C. After transferring supernatant into new tubes again, 800 µL 100% EtOH was added and placed on ice for 15 min. The liquid was then centrifuged at 14,000 rpm for 5 min at 4°C. The supernatant was discarded and 500 µL 70% EtOH was added to desiccate the pellet. The suspension was centrifuged at 14,000 rpm for 5 min at 4°C. The supernatant was then discarded and the pellet left to dry after which 100 µL TE was added and left
CMTGGCTCAG-3’) and 338R (5’-TGCTGCCTCC CGTAGGAGT-3’) (Kim et al., 2013; Murakami et al., 2015). PCR was performed with Tks Gflex DNA Polymerase (Takara Bio Inc.) and amplification proceeded with an initial denaturation step at 96°C for 2 min, followed by 15 or 20 cycles of 96°C for 30 sec, 55°C for 45 sec and 72°C for 1 min, with a final extension step at 72°C for 10 min. They were visualized on agarose gels (2% in TE Buffer), purified with a QIAamp PCR Purification Kit. Purified PCR products were tagged with unique barcode labels using forward primer (5’- CCATCTCATC CCTGCGTGTC TCCGACTCAG NNNNNNNNNN agagtttgat cmtggctcag -3’) containing the 454 primer A and reverse primer (5’- CCTATCCCCT GTGTGCCTTG GCAGTCTCAG tgctgcctcc cgtaggagt -3’) containing the 454 primer B by PCR reaction that was 2 min at 96°C, 5 cycles of 96°C for 30 s, 55°C for 45 s, and 72°C for 1min, and a final extension of 72°C for 10 min. Prior to sequencing, 454 tagged PCR products were cleaned again with Agencourt AMPure XP (Beckman Coulter, Inc., Brea, CA, USA) and quantified using the Quant-iT PicoGreen DNA assay (Invitrogen, Carlsbad, CA). Following quantization, the amplicon from each reaction mixture were pooled in equimolar ratios based on concentration and subjected
performed on the Roche 454 GS Junior Titanium platform (Roche, Branford, CT, USA) according to the manufacturer’s specifications.
3.2.9.Analysis of microbial 16S rRNA gene sequences
Sequence reads with an average Q-value < 25 were filtered out. Reads were then processed using quantitative insights into microbial ecology (QIIME) (v1.8.0) pipeline (Caporaso et al., 2010). Sequences were then clustered into operational taxonomic units (OTUs) using 97% sequence similarity and OTUs were assigned to taxonomy using Ribosomal Database Project (RDP) classifier(Wang et al., 2007).
3.2.10. Statistical analysis
Statistical analysis was performed with MATLAB version R2015a (The MathWorks, Inc., United States). P-values < 0.05 were considered as statistically significant, with 0.5 < p-value < 0.1 as the tendency. The correlation network based on Spearman’s correlation coefficient was constructed using R software.
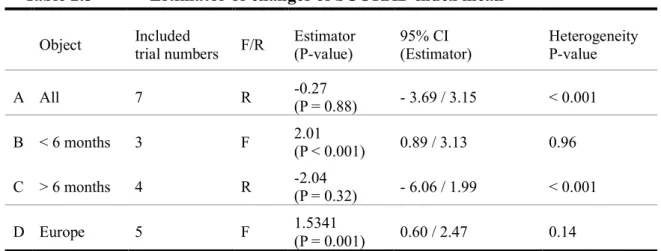
A metabolome analysis of gastrointestinal contents by CE-TOFMS and LC-MS/MS identified 344 and 308 metabolites, which were detected from SPF and GF mice, respectively (Figure 3.2). Additionally, 295, 269, 285, 300, 260, and 260 metabolites were detected in the stomach, upper small intestine, lower small intestine, cecum, upper colon and lower colon, respectively, from both SPF and GF mice (Figure 3.2). The numbers of metabolites were significantly different between SPF and GF mice in both the upper and lower colon (Figure 3.3). To visualize unique differences in metabolic data between GF and SPF mice, we performed principal component analysis (PCA). The PCA score plots were roughly separated by the presence of gut microbiota (Figure 3.4), suggesting that metabolites produced by gastrointestinal microbiota largely influence the luminal metabolome profile in each gastrointestinal section.
Figure 3.2 Luminal metabolome profiles of the gastrointestine in SPF and GF mice
Venn diagram shows the number of detected identified gastrointestinal luminal metabolites in SPF and GF mice. Stomach SPF GF 56 171 68 SPF GF 46 178 45
Upper small intestine
Lower small intestine
SPF GF 45 179 61 Cecum SPF GF 60 152 88 Upper colon SPF GF 25 156 79 Lower colon SPF GF 25 157 78 SPF GF 38 270 74 Whole parts
Figure 3.3 Differences of metabolites kinds in SPF and GF mice
Bar shows the number of mean of detected gastrointestinal luminal metabolites in SPF and GF mice. Student's t test, *:p < 0.05, **:p < 0.001
0 50 100 150 200 250 300 350
all St Si1 Si2 Ce Co1 Co2
SPF GF
** *
Figure 3.4 PCA of gastrointestinal luminal metabolome profiles in SPF and GF mice.
Error bars indicate standard deviation. Color designates the section of the intestinal tract, and shape denotes the type of mice used.
-25 -20 -15 -10 -5 0 5 10 15 -10 0 10 20 30 40 PC1 (20.3%) P C 2 ( 16.3% ) ■GF Stomach
■GF Upper small intestine
■GF Lower small intestine ■GF Cecum
■GF Upper colon ■GF Lower colon
●SPF Stomach
●SPF Upper small intestine
●SPF Lower small intestine
●SPF Cecum ●SPF Upper colon ●SPF Lower colon
3.3.2. Comparison of luminal metabolome profiles among each section of the gastrointestinal tracts
To focus on features of the metabolome in each section of the gastrointestinal tract, we conducted K-means clustering based on z-score, and all metabolites in their respective clusters were categorized according to metabolic pathway designations from the KEGG database(Figure 3.5). In SPF mice, each cluster indicates the specific features of the gastrointestinal organ. A subset of metabolites at the highest concentrations in the stomach was clustered as cluster A; stomach or upper and lower small intestine as cluster B; upper and lower small intestine as cluster C; lower small intestine as cluster D and cecum as cluster E. On the other hand, metabolites observed in GF mice were not separated clearly into the specific intestinal categories listed above for SPF mice. Metabolites from GF mice observed at the highest concentrations in the stomach and small intestine were clustered as cluster F and cluster G, respectively. Those metabolites with the highest concentrations in the upper small intestine and colon or cecum and colon were clustered as cluster H and cluster I, respectively, while metabolites observed at highest concentrations in the colon were
In the cecum and colon, the following metabolites—cholate, propionate, glucose, creatine and ribose—were detected at high concentrations only in SPF mice. Urea, inositol and dihydrouracil were detected only in GF mice. In the upper and lower small intestine, the numbers of identified metabolites were 32 and 58 in SPF mice and 33 and 63 in GF mice, respectively (Figure 3.5 Cluster B, C, G and H). The kinds of metabolites identified were independent of the existence of microbiota. The type of metabolites identified in the cecum and colon was different from the type in the stomach and small intestine. The population of metabolites that participate in carbohydrate and amino acid metabolism were more variable among the different parts of the intestine compared with metabolites in other pathways.
Furthermore, in the case of SPF mice, the metabolites that were significantly different from GF mice have been suggested to be related to amino acid metabolism, in addition to nucleotide metabolism and its regulation, based on MetaCore analysis. In stomach and small intestine, the significantly different metabolites were related to the metabolism and regulation of amino acids such as glycine, serine, cysteine and threonine metabolism (Betaine, Choline, Dimethylglycine, Choline phosphate,
Guanidinoacetate, Creatine, Spermidine). In the cecum and upper colon of SPF mice, significantly altered metabolites, compared to GF mice, were related to nucleotide metabolism and its regulation, such as TTP metabolism (uracil, thymine, 2’-deoxythymidine), CTP/UTP metabolism (Uridine, Uracil, Cytidine, Beta-alanine, UMP, CMP) and UMP biosynthesis (UMP). In the lower colon, significantly altered metabolites were related to amino acid metabolism and its regulation, such as Histidine-glutamate-glutamine metabolism (Urocanic acid, Succinic acid) and the tricarbonic acid cycle (Succinic acid). In the case of GF mice, few significant metabolites were detectable. In the stomach and upper small intestine, significant metabolites were related to nucleotide metabolism and its regulation, such as GTP-XTP metabolism (guanosine, guanine) and dGTP metabolism (2’-deoxy-guanosine). In the lower small intestine, significant metabolites were related to nicotine action, such as nicotine metabolism in liver (S-Nornicotine). In the cecum and colon, significant metabolites were related to amino acid metabolism and its regulation, such as proline metabolism (4-Hydroxy-L-proline); arginine metabolism (Guanidinoacetate); and glycine, serine, cysteine and threonine metabolism
metabolites was different between the two types of mice, due to varying functions among gastrointestinal sections and gut microbiota colonization.
C lus te r A C lus te r B C lus te r C C lus te r D C lus te r E C lus te r F C lus te r G C lus te r H C lus te r I C lus te r J St Si1 Si2 Ce C o1 C o2 -3.0 3.0 SPF GF St Si1 Si2 Ce C o1 C o2 Cluster A Cluster B Cluster C Cluster D Cluster E Cluster F Cluster G Cluster H Cluster I Cluster J Carbohydrate metabolism Energy metabolism Lipid metabolism Nucleotide metabolism Amino acids metabolism Metabolism of other amino acids Glycan biosynthesis and metabolism
GF
SPF
0 20 40 60 80 100%
A
Figure 3.5 Differences in luminal metabolites among parts of the gastrointestinal tract in SPF and GF mice
(A) Heatmap of luminal metabolites categorized into five groups using K-means analysis. Columns correspond to gastrointestinal sections, while rows correspond to metabolites detected by CE-TOFMS and LC-MS/MS. Profiles were normalized to a relative value between -3 and 3. The colors indicate the z-score values calculated within SPF and GF mice separately. St: stomach, Si1: upper small intestine, Si2: lower small intestine, Ce: cecum, Co1: upper colon, Co2: lower colon. (B) Stack chart shows the percent distribution among pathways in which metabolites were detected within each cluster.
3.3.3.Comparison of gastrointestinal luminal metabolites between SPF and GF mice
We conducted OPLS-DA on each part of the luminal metabolome profiles of both SPF and GF mice (Figure 3.6A). S-plots showed that some metabolites contributed to the separation between SPF and GF mice (Figure 3.6B,Table 3.1). The following concentrations of metabolites were higher in SPF mice than those in GF mice: taurine (81.9-fold in stomach, 7.2-fold in upper small intestine), lactate (7.7-fold in stomach, 4.5-fold in upper colon), inositol (11.1-fold in stomach), maltose (811.0-fold in stomach), and butanoate (1374.2-fold in upper colon). Furthermore, taurine, butanoate and lactate appear to be characteristic metabolites within the upper small intestine, cecum, and upper colon, respectively, in SPF mice. On the other hand, raffinose (3680.3-fold in colon) was higher in the GF colon compared to that in the SPF colon. We conducted further microbiome analysis of the gastrointestine in SPF mice and found that microbiome profiles were distinctive among the differing parts of the gastrointestine (Figure 3.7). This result suggests that gastrointestinal luminal metabolome profiles may be related to the colonized microbiota, although further
the case of unweighted, UniFrac analysis, the composition of gastrointestinal microbiota was similar within the same part of the intestine (Figure 3.7B)
4 4 4 A A 4 4 A 4 A -42 AG C M AG C O M F A M. A A M M0 A M3 A M5 FC 4 M4 L4 I A A 1C < A A A B A 0A 8 8 A CC A
Figure 3.6 OPLS-DA of the luminal metabolome profiles of the gastrointestine in SPF and GF mice
(A) The result of OPLS-DA. Red and blue indicate SPF and GF mice, respectively. (B) S-plot for OPLS-DA o each section of the intestinal tract. Each model represented SPF and GF mice in a single location: the stomach, upper small intestine, lower small intestine, cecum, upper colon and lower colon, with the cross-validated predicted ability Q2(Y) = 1 and total explained variance R2(X) = 1, Q2(Y) = 0.96 and R2(X) = 0.93, Q2(Y) = 0.99 and R2(X) = 0.98, Q2(Y) = 0.99 and R2(X) = 0.89, Q2(Y) = 1 and R2(X) = 1, Q2(Y) = 1 and R2(X) = 1, respectively.
Table 3.1 Characteristic luminal metabolites from each section of the gastrointestinal tract GF side SPF side Metabolite x y Metabolite x y Stomach Maltose Lactate Inositol Taurine 0.42 0.35 0.34 0.33 0.56 0.89 0.66 0.93 Upper small intestine Taurine 0.32 0.98 Lower small intestine
Cecum Butanoate 0.39 0.29 0.97 0.98 Upper colon Raffinose -0.37 -0.88 Lactate 0.36 0.70 Lower colon Raffinose -0.40 -1.00
Figure 3.7 Composition of gastrointestinal microbiota in SPF mice
(A) Vertical bars indicate relative abundances of gastrointestinal microbiota colored by microbial family from binned OTU. Mice number was labeled at the bottom. St: stomach, Si1: upper small intestine, Si2: lower small intestine, Ce: cecum, Co1: upper colon, Co2: lower colon. (B) Principal coordinate analysis (PCoA) plot of sequence data. Left represents unweighted, and right represents
0% 20% 40% 60% 80% 100% St Si1 Si2 Ce Co 1 Co 2 St Si 1 Si 2 Ce Co1 Co2 St Si1 Si2 Ce Co1 Co2 SPF #1 SPF #2 SPF #3 A bu nd an ce o fg ast ro in te st in al m icr ob io m e ■S24-7 ■Lactobacillaceae ■Lachnospiraceae ■Erysipelotrichaceae ■Others A B -0.3 -0.2 -0.1 0.0 0.1 0.2 0.3 0.4 -0.6 -0.4 -0.2 0.0 0.2 0.4 PCo2(1 1.1%) PCo1(22.6%) -0.20 -0.15 -0.10 -0.05 0.00 0.05 0.10 0.15 -0.2 -0.1 0.0 0.1 0.2 PCo2(26.7%) PCo1(54.9%)
●Stomach ●Upper small intestine
●Lower small intestine ●Cecum
3.3.4.Features of sugars and amino acids within the gastrointestinal lumen of SPF and GF mice
We measured the concentrations of 19 sugars and amino acids (Figure 3.9, Figure 3.10). Sugars were separated into six groups using hierarchy clustering analysis to compare SPF and GF mice (Figure 3.9). These six categories displayed different metabolic patterns between each of the gastrointestinal locations. Panose was categorized as category A; this category includes metabolites observed at higher concentrations in the stomach of SPF mice compared to GF mice. Glucose, fructose, mannose and ribose were categorized as category B, which observed higher concentrations within the upper small intestine in SPF mice compared to GF mice. Mannitol, arabitol, sorbitol, raffinose, and trehalose were categorized as category C. The concentrations of these metabolites were higher within the upper colon in GF mice than concentrations in other GF gastrointestinal sections. Arabitol and trehalose had higher concentrations within the stomach and upper small intestine in SPF mice when compared with GF mice. In addition, category D includes inositol, maltotriose, sucrose, maltose and xylitol, which were more highly concentrated within the stomach in SPF
galactose and rhamnose, and arabinose and xylose, respectively. These metabolites were all found to have high concentrations in the upper and lower colon in SPF mice. Amino acid profiles for each part of the gastrointestine between SPF and GF mice were drastically different (Figure 3.10). In SPF mice, the concentrations of all amino acids were higher in the upper gastrointestine than those of the lower intestine. However, in GF mice, the amino acid concentrations were higher in the lower intestine than those of the upper gastrointestine. From these findings, the amino acids are considered to be intermediate metabolites in both protein digestion and absorption by the host, as well as microbial digestion and metabolization of amino acids.
Figure 3.8 Clustered luminal carbohydrate profiles of the gastrointestine in SPF mice
Carbohydrate profiles in SPF mice were clustered. St: stomach, Si1: upper small intestine, Si2: lower small intestine, Ce: cecum, Co1: upper colon, Co2: lower colon. These 6 clusters (the cut-off height of 1.7 shown as red line) further clustered by hierarchy clustering analysis based on Pearson’s correlation. St Si1 Si2 Ce C o1 C o2 Panose Glucose Fructose Mannose Ribose Mannitol Arabitol Sorbitol Raffinose Trehalose Maltose Maltotoriose Sucrose Inositol Xylitol Galactose Rhamnose Arabinose Xylose A B C D E F Cluster 0 0.62 1.24 Height Relative amount High Low