A Psychovisual Threshold for Generating
Quantization Process in Tchebichef Moment
Image Compression
Ferda Ernawan
1, 2 1Faculty of Information and Communication Technology, Universiti Teknikal Malaysia Melaka, Melaka, Malaysia
2
Faculty of Computer Science, Universitas Dian Nuswantoro, Semarang, Indonesia Email: [email protected]
Nur Azman Abu and Nanna Suryana
Faculty of Information and Communication Technology, Universiti Teknikal Malaysia Melaka, Melaka, Malaysia
Email: {nura, nsuryana}@utem.edu.my
Abstract— A human visual system can hardly respond to small differences in image signals. A full colour image carries a certain amount of perceptual redundancy for the human eyes. The sensitivity human eye of the color image can be measured by a psychovisual threshold. The sensitivity of the human eye is useful for perceptual visual image in image compression. The quantization tables are obtained to determine psychovisual threshold that can be perceived visually significant by the human eye. This paper introduces the concept of psychovisual threshold into Tchebichef moment image compression. This paper will investigate the contribution of each moment coefficient to the image reconstruction. The error threshold from the contribution of its moments in image reconstruction will be the primitive of psychovisual threshold to an image. This paper presents a new technique to generate quantization table for an optimal TMT image compression based on psychovisual error threshold. The experimental results show that these new finer quantization tables provide a statistically better image quality output at lower average bit length of Huffman's code than previously proposed TMT quantization.
Index Terms—TMT quantization, psychovisual threshold, TMT image compression
I. INTRODUCTION
A human visual system is capable of perceiving various intensities of the visual information colour image. A human eye perceives a group of image signals as a summary and hardly responds to small differences in colour image signals. The visual information colour images possess a certain amount of perceptual redundancy [1]. The human visual system describes the way of a human eye’s process on image and how to relay
it to the brain. By taking the advantages of some human eye’s properties, data redundancy of the colour image can be removed without seriously degrading the image perceptual quality. An image carries the considerable amount of perceptual redundancy to the human eye. Visual perception is a complex coordination among the eye, optical nerve, visual cortex and other part of the brain [2]. Human eye does not perceive directly from the translation of retina stimuli, but it involves complicated psychological inference [3]. The human eye has a non-linear response toward the drastic changes in intensity level and likely to process them in different frequency channels [4].
The psychovisual redundancy is the image information that is ignored by the human visual system or relatively less important to human eye. In another word, human eye is not equally sensitive to all visual image information. The psychovisual redundancy results in the fact that human eye perception of an image does not really depend on specific individual pixels.
The removal of psychovisual redundancy theoretically reduces the less important information in the compressed image. In some cases, it is useful to remove the redundancy data especially on image compression. The psychovisual redundancy can be eliminated in the lossy data compression via the quantization process. This psychovisual redundancy can be determined by several experimental or trial testing on the human visual eye perception to the image intensity. However, the result is relatively subjective. The objective of this research is to develop quantitative measures that can automatically predict perceptual image quality [5].
In general, a psychovisual model has been designed based on our understanding of brain theory and neuroscience [3], which is used to determine a threshold of human visual system’s sensitivity. The psychovisual model has not been fully comprehended. A psychovisual
threshold can be conducted via quantitative experiment by evaluating the image reconstruction [6]-[10].
This paper investigates the sensitivity of Tchebichef Moment Transform (TMT) basis function in image compression. TMT is an efficient transform based on discrete Tchebichef polynomials [11]. It uses a simplified mathematical framework technique by using matrices. TMT is an efficient transform based on discrete orthogonal Tchebichef polynomials, which has energy compactness properties for certain class image [12].
TMT has been shown to have better image representation capability than the continuous orthogonal moments [13]. TMT has been widely used in various image processing applications. For examples, they are used in image analysis [11], texture segmentation, image reconstruction [14], image dithering [15]-[17], and image compression [18]-[22].
This research proposes a model represented by a visual threshold based on Tchebichef moment by evaluating the image reconstruction. This paper investigates the contribution moment coefficient for each moment order based on error reconstruction. The sensitivity amounts on each moment order give significant effect to the image reconstruction. An ideal error threshold which gives an optimize performance in image reconstruction is represented as a psychovisual threshold.
The organization of this paper is as follows. The next section provides a brief description of Tchebichef moment transform. Section III presents the experimental method in generating psychovisual threshold. The experimental results of TMT image compression based on the new quantization table from psychovisual threshold are presented in Section IV. Lastly, section V concludes this paper.
II. TCHEBICHEF MOMENT TRANSFORM
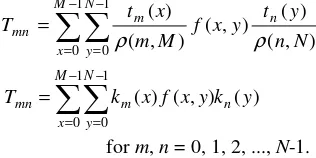
TMT is a two-dimensional transform based on discrete orthogonal Tchebichef polynomials. For a given set {tn(x)} of input value (image intensity values) of size
the following recursive relation: , Tchebichef moment transform is shown in Figure 1.
The recursive relation tn(x) of 8×8 orthogonal Tchebichef
polynomials are shown in Table I.
The description of squared-norm (·) and the properties of orthogonal Tchebichef polynomials are given in [11]. The values of (n, N)for every n=0, 1, ..., N-1 where N=8 is shown in Table II.
The process of image reconstruction from its moments, the inverse TMT is given as follows:
− distribution. Image reconstruction provides a measure of the feature representation capability of the moment functions. Tchebichef moment transform has its own advantage in image processing, which has not been fully explored. The discrete orthogonal Tchebichef polynomial domain consists of real rational numbers unlike the continuous orthogonal transforms. Discrete orthogonal Tchebichef moment is capable of performing image reconstruction exactly without any numerical errors [22]. The TMT involves only algebraic expressions and it can be computed easily using a set recurrence relation (1)-(6).
An image contains low, medium and high-frequency components. The low-frequency signal corresponds to slowly varying color, whereas the high-frequency represents the finer detail within the image information. Intuitively, low frequencies are more important to create a good representation of an image and the higher frequencies can largely be ignored in most instances. The human eye is highly sensitive to low frequency's distortions rather than to high frequencies.
III. AN EXPERIMENTAL METHOD
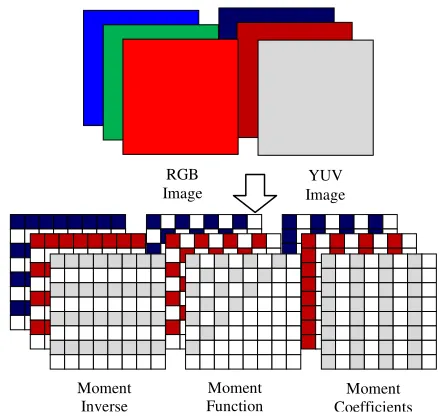
In this quantitative experiment, 80 images (24-bit RGB with 512×512 pixels) are chosen to be tested and analyzed while incrementing the frequency coefficients. The images are classified into 40 real images and 40 graphical images respectively. The RGB image is separated into a luminance (Y) and two chrominance (U and V). The images are divided into the 8×8 size blocks and each block of the image data is transformed by a two-dimensional TMT. This experiment can be done by
investigating the effect of incrementing moment coefficient one at a time for each moment order. Based on the discrete orthogonal moments above (2)-(6), a compact representation of the moment coefficient K(8×8) is given as follows:
The kernel matrix values K(8×8) of orthogonal Tchebichef polynomials are shown in Table III.
The image block matrix by F(8×8) with f (x, y) denotes the
The visual representation of the matrix is given in Figure 2.
The matrix T(S×S) of moments is defined using S=8 in
above as follows:
) image to generate moment coefficients of discrete orthogonal TMT. The inverse moment relation used to reconstruct the image block from the above moments and is as follows: reconstructed intensity value. This process is repeated for every 8×8 block of an image. The use of moments for image analysis is to characterize an image segment and to extract properties that have analogies in statistics and mechanics. Each 8×8 block image is arranged in a linear order. The implementation of moment order by M(S×S)
The order zero m(0,0) on the moment coefficient represents the average intensity of an image. The first orders on moment coefficients are represented by m(1,0) and m(0,1) coordinates. The second orders of moment coefficients are located by (m(2,0), m(1,1) and m(0,2)) coordinates and so on. Moment coefficients are incremented up to a maximum of quantization tables for each moment order. The TMT quantization tables [22] are used as a reference for a maximum of increment moment coefficients. The quantization tables for luminance QML and chrominance
QMR on TMT has been originally proposed as follows:
=
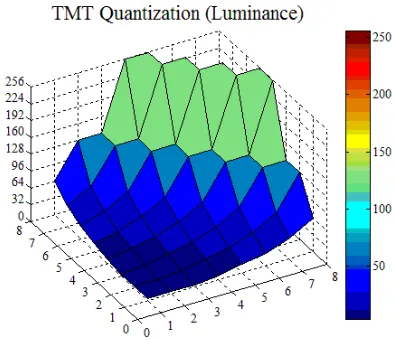
The quantization tables are the crucial elements that have significant effect to the quantity of the moment coefficients. The quantization value is used to determine the amount of moment coefficients to represent the visual image, which has the HVS visibility tolerance to the visual quality image. The three-dimensional visualization of TMT quantization table for luminance and chrominance are shown in Figure 3 and Figure 4.
Recently, these tables have performed well on TMT image compression [22] in providing higher compression quality at lower average bit length of Huffman's code. These quantization tables can still be redesigned based on human visual sensitivity by optimizing the visual quality of the reconstructed image on a given bit rate. Human eye is more sensitive to low frequency distortions rather than to high-frequency ones. This human visual sensitivity can be technically represented by a psychovisual threshold.
IV. EXPERIMENTAL RESULTS
In order to reduce the quantity of the moment coefficient which has irrelevant image information to represent the visual quality image, the contribution of the moment coefficients to the image reconstruction shall be investigated. The moment coefficients are incremented one at a time for each moment order to analyze the effect to the visual quality image reconstruction. The sensitivity of TMT basis function is investigated to measure an optimal image representation. The TMT coefficients are incremented up to value from the original TMT quantization table [22]. The experiment can be conducted by calculating the quality image reconstruction score from the effect of an increment moment coefficients one Figure 4. Three-dimensional visualization of TMT quantization table
for chrominance
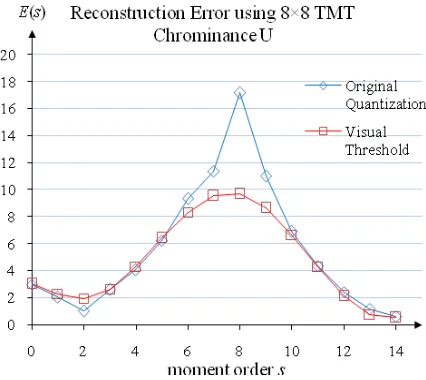
by one. The effect of an increment in TMT coefficient is calculated and analyzed to get psychovisual threshold on the output image. This approach is used to generate quantization tables for TMT image compression. The average reconstruction error of an increment moment coefficient on luminance (Y) and Chrominance (U) for 40 real images are shown in Figure 5 and Figure 6.
The x-axis represents the moment order and y-axis represents error reconstruction. This quantitative experiment investigates the effect of an increment on TMT coefficients. The effect of an incremented moment coefficient is calculated by image reconstruction error measurement. The average full error score on 40 real colour images is computed for each frequency order for every 8×8 block image. The effect of an increment up to maximum value of the previous TMT quantization table for a given order zero to the order fourteen has been visualized as a curve. The blue curve represents image reconstruction error based on the maximum quantization
value. In order to produce a psychovisual threshold, the new average designed reconstruction error is to get a smoothed curve which results in an ideal curve of average error scores. An ideal psychovisual threshold for luminance and chrominance is depicted as the red curve. The smooth curve of the reconstruction error is then interpolated by a simple polynomial that represents a psychovisual threshold of the image. Concerning Figure 5 and Figure 6, the authors propose a psychovisual threshold for TMT basis function for luminance fML and
chrominance fMR of quantization table, which are defined
as follows:
4 According to equation above, these functions can be used to generate new quantization tables for luminance and chrominance respectively as follows:
= quantization table is depicted in Figure 7 and Figure 8.
Figure 7. Two-dimensional visualization of TMT quantization table for luminance.
Figure 5. The average reconstruction error of an increment on TMT coefficient for 40 real images on luminance.
where a blue curve represents the original TMT quantization table [22], and a red curve represents a new quantization table from a psychovisual threshold. Based on the principles of psychoacoustics, it can be stressed that human receptor is more sensitive to changes in (low order frequency) sound such as a whisper. This psychovisual model considers on the human eye which is more sensitive to any changes at the low-frequency signal than at high-frequency signals.
These new quantization tables will be implemented in TMT image compression to measure the performance of the newly proposed psychovisual threshold. Each element of the moment coefficient is divided by the corresponding elements in an 8×8 quantization table and rounding the results. After the transformation and quantization of an 8×8 image sub-block are over, the DC coefficient is separated from the AC coefficients. Next, run length encoding is used to reduce the size of a repeating coefficient value in the sequence of a set of AC coefficients.
The coefficient value can be represented compactly by simply indicating the coefficient value and the length of its run wherever it appears. The output of run length coding represents TMT moments as symbols and the length of occurrence of the symbols. The symbols and variable length of occurrence are used in Huffman coding to retrieve code words and their length of code words.
Huffman coding is a coding technique to produce the shortest possible average code length of the source symbol set and the probability of occurrence of the symbols [23]. Using these probability values, a set of Huffman's code of the symbols can be generated from a Huffman Tree. Next, the average bit length score is calculated to find the average bit length of DC and AC coefficients. The average bit length of DC produces same value because the quantization table value for DC coefficient is not changed. The average bit length of Huffman's code based on the TMT quantization table [22] and the proposed new quantization generations from psychovisual threshold for TMT basis function are shown in Table IV.
In order to measure the quality of the reconstructed image, the Full Error is used and calculated to analyze image reconstruction error. The image reconstruction error shall be calculated by obtaining the differences between reconstruction image g(i, j, k) and original image f(i, j, k).The image reconstruction error can be defined as follows:
−
= −
= =
− =
1
0 1
0 2
0
) , , ( ) , , ( 3
1 ) (
M
i N
j k
k j i f k j i g MN
s
E (17)
where the original image size is M×N and the third index refers to the value of three colors of RGB channels. The MSE calculates the average to the square error [24] which defined as follows:
−
= −
= =
− =
1
0 1
0 2
0
2
) , , ( ) , , (
M
i N
j k
k j i f k j i g
MSE
(
18)The next measurement is Peak Signal to Noise Ratio (PSNR). The PSNR [25] is defined as follows:
2
10 10
255 20 log Maxi 10 log
PSNR
MSE MSE
= = (19)
The quality of image reconstruction based on the new quantization table for TMT image compression is shown in Table V.
Another measurement quality image is Structural Similarity index (SSIM), which is a method to measure Figure 8. Two-dimensional visualization of TMT quantization table for
chrominance.
TABLEV
THE IMAGE RECONSTRUCTION ERROR SCORE OF TMTIMAGE COMPRESSION FOR 40REAL IMAGES AND 40GRAPHICAL IMAGES
Image Measurement
TMT Quantization Table
Psychovisual Threshold 40 Real
Images 40 Graphical
Images
40 Real Images
40 Graphical
Images Full Error 5.2584 4.71429 5.2456 4.6034 MSE 58.1587 68.20336 57.4476 62.5664 PSNR 31.3721 31.4483 31.3790 31.6477
SSIM 0.9471 0.9601 0.9462 0.9600
TABLEIV
AVERAGE BIT LENGTH OF HUFFMAN CODE OF TMTIMAGE COMPRESSION FOR 40REAL IMAGES AND 40GRAPHICAL IMAGES
Average bit length of Huffman Code
TMT quantization tables
Psychovisual Threshold 40 Real
Images 40 Graphical
Images
40 Real Images
40 Graphical
the similarity between original image and compressed image. The SSIM is defined as follows:
γ β
α
[
(
,
)]
[
(
,
)]
)]
,
(
[
)
,
(
x
y
l
x
y
c
x
y
s
x
y
SSIM
=
⋅
⋅
(20)where > 0, > 0, > 0, are parameters to adjust the relative importance of the three components. The detail description is given in [26].
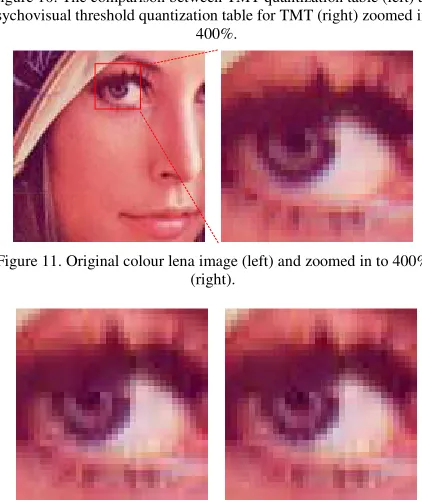
A quantitative experiment of psychovisual threshold for 40 real and 40 graphical images have been done. In this experiment, the right eye of the baboon image and Lena image are evaluated as presented on the left of Figure 9 and Figure 11.
In order to observe the visual quality of the image compression results, the image reconstruction is zoomed
in to 400% as shown on the right of Figure 9 and Figure 11. The experimental results of image compression using new quantization tables based on psychovisual threshold are shown on the right of Figure 10 and Figure 12. The new quantization tables based on psychovisual threshold produces better quality image output than previously proposed TMT quantization tables [22] for TMT image compression.
The observation as presented on the right of Figure 10 point out the fact that the new quantization tables based on psychovisual threshold produce almost the same as the original image on the right of Figure 9. In addition, the image output produces smooth texture. The experimental results show that the new TMT quantization tables based on psychovisual threshold produces a lower average bit length of Huffman's code as shown in Table IV than the earlier TMT image compression for both real and graphical images.
Refer to Figure 12, the new quantization table on TMT image compression produces brighter pupil on Lena right eye than the previously proposed default TMT quantization table [22]. The TMT image compression using a new quantization table as shown on the right of Figure 12 shows better visual quality image output than the earlier TMT image compression. The image output from TMT image compression using a new quantization table in is closer towards the original Lena image as on the right of Figure 11.
Image compression using psychovisual threshold produce a better-quality reconstruction image as shown in Table V than previous TMT image compression [22]. It has been observed from the experiment, the reconstruction error from TMT basis function is relatively equally distributed among the orders of image signals. The new technique on quantization table generation based on psychovisual threshold produces higher quality on image reconstruction at lower average bit length of Huffman's code in the compressed image.
V. CONCLUSIONS
The psychovisual threshold represents the human visual system’s sensitivity to the image intensity in terms of image compression. These threshold functions represent the contribution of the moment coefficients to reconstruct the image. The level of contribution of each frequency coefficient to the reconstruction error will be a primitive pyschovisual error. Psychovisual threshold is used to determine the amount of moment coefficients to represent the visual details of image information. A psychovisual threshold can provide an optimal compact image representation at the least quantity of moments. The psychovisual threshold appears as the value of the quantization table to assign the frequency coefficient value of each moment order. This paper proposes a new technique to generate quantization tables based on psychovisual error threshold for TMT image compression. The new TMT quantization tables based on psychovisual threshold produces better quality image reconstruction at lower average bit length of Huffman's code of the image compression.
Figure 9. Original colour baboon image (left) and zoomed in to 400% (right).
Figure 10. The comparison between TMT quantization table (left) and psychovisual threshold quantization table for TMT (right) zoomed in to
400%.
Figure 11. Original colour lena image (left) and zoomed in to 400% (right).
Figure 12. The comparison between TMT quantization table (left) and psychovisual threshold quantization table for TMT (right) zoomed in to
ACKNOWLEDGMENT
The authors would like to express a very special gratitude to Ministry of Higher Education (MOHE), Malaysia for providing financial support for this research project by
Fundamental Research Grant Scheme
(FRGS/2012/FTMK/SG05/03/1/F00141).
REFERENCES
[1] C.H. Chou, and K.C. Liu, “A Perceptually Tuned Watermarking Scheme for Color Images,” IEEE Transactions on Image Processing, vol. 19, no. 11, pp. 2966-2982, 2010.
[2] R. Strenberg. Cognitive Psychology. Third Edition, Thomson Wadsworth, 2003.
[3] G. Zhai, X. Wu, X. Yang, W. Lin and W. Zhang, “A Psychovisual Quality Metric in Free-Energy Principle,”
IEEE Transaction on Image Processing, vol. 21, no. 1, pp. 041-052, 2012.
[4] H. Senane, A. Saadane and D. Barba, “Design and Evaluation of an Entirely Psychovisual-Based Coding Scheme,” Journal of Visual Communication and Image Representation, vol. 12, pp. 401-421, 2001.
[5] Z. Wang, A.C. Bovik, H.R. Sheikh and E.P. Simoncelli, “Image Quality Assessment: From Error Visibility to Structural Similarity,” IEEE Transaction on Image Processing, vol. 13, no. 4, pp. 600-612, 2004.
[6] N.A. Abu, F. Ernawan, N. Suryana and S. Sahib, “Image Watermarking Using Psychovisual Threshold over the Edge,” Information and Communication Technology, vol. 7804, pp. 519-527, 2013.
[7] N.A. Abu, F. Ernawan and N. Suryana, “A Generic Psychovisual Error Threshold for the quantization table generation on JPEG Image Compression,” 9th
International Colloquium on Signal Processing and its Applications, pp. 039-043, 2013.
[8] F. Ernawan, N.A. Abu and N. Suryana, “TMT Quantization Table Generation Based on Psychovisual Threshold for Image Compression,” International Conference of Information and Communication Technology (ICoICT 2013), pp. 202-207, 2013.
[9] N.A. Abu, F. Ernawan and S. Sahib, “Psychovisual Model on Discrete Orthonormal Transform,” International Conference on Mathematical Sciences and Statistics
(ICMSS 2013), 5-7, pp.309-314, 2013.
[10] F. Ernawan, N.A. Abu, N. Suryana, “Adaptive Tchebichef Moment Transform Image Compression Using Psychovisual Model,” Journal of Computer Science, vol. 9, no. 6, pp. 716-725, 2013.
[11] R. Mukundan, S.H. Ong and P.A. Lee, “Image Analysis by Tchebichef Moments,” IEEE Transaction on Image Processing, vol. 10, no. 9, pp. 1357-1364, 2001.
[12] R. Mukundan and O. Hunt, “A Comparison of Discrete Orthogonal Basis Functions for Image Compression,”
Proceeding Conference on Image and Vision Computing
(IVCNZ 2004), pp. 053-058, 2004.
[13] H. Shu, H. Zhang and L. Luo, “Fast Computation of Tchebichef Moments for Binary and Grayscale Images,”
IEEE Transaction on Image Processing, vol. 19, pp. 3171-3180, 2010.
[14] N.A. Abu, N. Suryana and R. Mukundan, “Perfect Image Reconstruction Using Discrete Orthogonal Moments,”
Proceeding of The 4th
International Conference on Visualization, Imaging and Image Processing (VIIP2004), pp. 903-907, 2004.
[15] F. Ernawan, N. A. Abu and H. Rahmalan, “Tchebichef Moment Transform on Image Dithering for Mobile Applications,” Proceeding of the SPIE, vol. 8334, pp. 83340D-5, 2012.
[16] H. Rahmalan, F. Ernawan and N.A. Abu, “Tchebichef Moment Transform for Colour Image Dithering,” 4th
International Conference on Intelligent and Advanced Systems (ICIAS 2012), vol. 2, pp. 866-871, 2012. [17] N.A. Abu, F. Ernawan and N. Suryana, “An Image
Dithering via Tchebichef moment transform,” Journal of Computer Science, vol. 9, no. 7, pp. 811-820, 2013. [18] F. Ernawan, E. Noersasongko and N.A. Abu, “An
Efficient 2×2 Tchebichef Moments for Mobile Image Compression,” International Symposium on Intelligent Signal Processing and Communication System (ISPACS 2011), pp. 001-005, 2011.
[19] F. Ernawan, N.A. Abu, N. Suryana, “An Adaptive JPEG Image Compression Using Psychovisual Model,”
Advanced Science Letters, vol. 20, no. 1, pp. 026-031, 2014.
[20] F. Ernawan, N.A. Abu, N. Suryana, “An Optimal Tchebichef Moment Quantization Using Psychovisual Threshold for Image Compression,” Advanced Science Letters, vol. 20, no. 1, pp. 070-074, 2014.
[21] H. Rahmalan, N.A. Abu and W.S. Lang, “Using Tchebichef Moment for Fast and Efficient Image Compression,” Pattern Recognition and Image Analysis, vol. 20, pp. 505-512, 2010.
[22] N.A. Abu, W.S. Lang, N. Suryana, and R. Mukundan, “An Efficient Compact Tchebichef Moment for Image Compression,” 10th International Conference on Information Science, Signal Processing and their applications (ISSPA2010), pp. 448-451, 2010.
[23] D. A. Huffman, “A Method for the Construction of Minimum-Redundancy Codes. Proceedings of the IRE,” vol. 40, no. 9, pp. 1098-1101, 1952.
[24] A. Horé, and D. Ziou, “Image Quality Metrics: PSNR vs. SSIM, International Conference on Pattern Recognition,” pp. 2366-2369, 2010.
[25] C. Yim and A.C. Bovik, “Quality Assessment of Deblocked Images,” IEEE Transaction on Image Processing, vol. 20, no. 1, pp. 088-098, 2011.
[26] A. Liu, W. Lin and M. Narwaria, “Image Quality Assessment Based on Gradient Similarity,” IEEE Transaction on Image Processing, vol. 21, no. 4, pp. 1500-1512, 2012.
Ferda Ernawan was born in Semarang, 19 February 1988. He received the Bachelor Degree in Information Technology from Universitas Dian Nuswantoro (UDINUS), Semarang, Indonesia in 2009. He received Master Degree in Software Engineering and Intelligence from the Faculty of Information and
Communication Technology,
Nur Azman Abu is currently serving as a senior lecturer at Faculty of ICT, Universiti Teknikal Malaysia Melaka (UTeM). He obtained his bachelor and master degree from Purdue University in 1992 and 1994 both in Mathematics. He is currently undergoing his PhD program at Universiti Teknikal Malaysia Melaka. His current interests include cryptography, random number generation, image processing and travelling salesman problem.