When completed this year, the Arabidopsis genome will represent the first plant genome to be fully sequenced. This sequence information, together with the large collection of expressed sequence tags, has established the basics for new approaches to studying gene expression patterns in plants on a global scale. We can now look at biology from the
perspective of the whole genome. This revolution in the study of how all genes in an organism respond to certain stimuli has encouraged us to think in new dimensions. Expression profiles can be determined over a range of experimental conditions and organized into patterns that are diagnostic for the biological state of the cell. The field of genome-wide expression in plants has yet to produce its fruit; however, the current application of microarrays in yeast and human research foreshadows the diverse applications this technology could have in plant biology and agriculture.
Addresses
Michigan State University, East Lansing, MI 48824, USA *e-mail: [email protected]
Current Opinion in Biotechnology2000, 11:162–167 0958-1669/00/$ — see front matter
© 2000 Elsevier Science Ltd. All rights reserved. Abbreviation
EST expressed sequence tag
Introduction
In the past, few techniques were available to look at differ-ences in global gene expression. Brute force approaches such as sequencing very large numbers of independent cDNA libraries were possible but are prohibitively expen-sive. A fairly new technology, serial analysis of gene expression (SAGE) [1], has in part overcome this. cDNAs are digested with a number of different enzymes to create fragments ~12 basepairs (bp) in length, which are then lig-ated together and sequenced. The frequencies of these fragments in the chimeric sequences estimate the frequen-cies of mRNAs in the population. On a similar theme, Gene Calling [2] evaluates restriction patterns of cDNA samples with multiple restriction enzymes such that each cDNA sample produces a characteristic profile. The identification
and quantitation of the peaks for each cDNA molecule indicate the level of gene expression. Other methods with sometimes excellent results include differential display [3] and library subtraction. The major drawbacks of all these techniques lie in the fact that they either look at too small a subset of genes or are very laborious and time consuming to perform.
Rapid gene expression analysis on a truly genome-wide scale became feasible with the development of microarray technology [4••,5•]. Hundreds to thousands of DNA frag-ments spotted at high density on a solid substrate can be analyzed simultaneously in a single experiment (Fig-ure 1a). Two types of microarrays are presently in use: the DNA microarray and the oligonucleotide-based chips. In an array experiment, many PCR-amplified cDNA frag-ments, each corresponding to a single gene, are spotted in high density using a special gridding robot on a chemically coated glass slide (DNA microarray), or onto a nylon mem-brane (DNA arrays). Alternatively, series of gene-specific oligonucleotides are synthesized directly on a chip by a process of photolithography [6,7], such as those produced by Affymetrix (Santa Clara, CA). The differences between the two technologies are pointed out in Table 1. The DNA spots on the array are hybridized to cDNA targets derived from two RNA samples, each labeled with a specific fluo-rescent dye (Figure 1b). The amount of labeled target bound to each spot is quantified with a high-resolution scanner. Specialized software and data management tools are then required for image analysis, data extraction, and data mining. Typically, an experiment compares two RNA populations derived from control and experimental tissue, yielding relative information of mRNA levels for the com-plete set of genes represented on the microarray. The ratio of signal intensities between control and test mRNA probes is very reproducible. All aspects in manufacturing and processing high-density arrays have been extensively reviewed in literature [8•].
The possibility to produce microarrays from different organisms depends on DNA sequence information from either genomic sequence data or available cDNA
Monitoring genome-wide expression in plants
Robert Schaffer, Jeff Landgraf, Miguel Pérez-Amador and Ellen Wisman
*
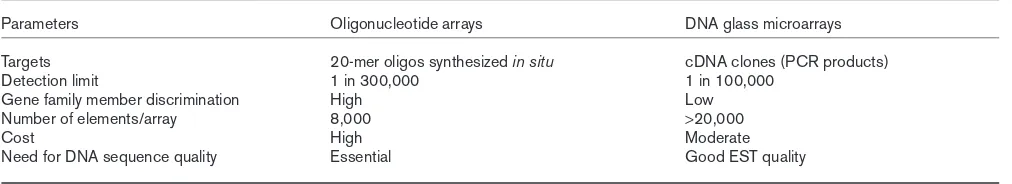
Table 1
Comparison of DNA microarrays and oligonucleotide arrays.
Parameters Oligonucleotide arrays DNA glass microarrays
Targets 20-mer oligos synthesized in situ cDNA clones (PCR products)
Detection limit 1 in 300,000 1 in 100,000
Gene family member discrimination High Low
Number of elements/array 8,000 >20,000
Cost High Moderate
sequences in the form of expressed sequence tags (ESTs). Arabidopsis will be the first eukaryotic plant whose genome is to be completely sequenced [9•], and over 45,000 Arabidopsis ESTs have already been pub-lished. Sequence information from additional species with major importance in agriculture is also being gener-ated. There are currently over 220,000 EST sequences from at least 20 different plant species in the database, providing a rich resource for the design and production of DNA microarrays [10].
Genome-wide expression analysis in plants
The first plant microarray on glass slides used 48 Ara-bidopsis EST clones to compare expression patterns between roots and leaves [11]. No other plant microarraywork had been described until 1998, when Ruan et al. [12] published a repeat of this experiment using a microarray containing 1400 cDNAs. 30% of the genes were more highly expressed in roots compared to leaves, but not many differences were detected between open flowers and flower buds or leaves. A microarray with 673 Arabidopsis genes demonstrated the light response of a small number of genes in two Arabidopsis accessions Columbia and Kas [13]. In another Arabidopsis accession Wassilewskja, 16% of the 800 genes spotted in high-den-sity on nylon filters showed a response to light [14]. To date, a number of small microarrays have been tested in petunia, strawberry and maize [15•]. The identification of 200 strawberry genes by Aharoni with a potential in fruit ripening using an array with 1800 fruit-specific Procedures involved in microarray analysis.
(a)cDNAs are spotted at high density on a glass slide. This is probed with two different fluorescent-labeled RNA samples: a control sample (i)and experimental sample (ii). Analysis software creates a false color image and calculates the ratio of label abundance for each spot. (b)Picture of the 11,000 cDNA array that shows difference in gene expression. This array is used for the Arabidopsis Functional Genomics Consortium service facility.
Hybridized array
Gene expression Higher in (i) than (ii)
Same between (i) and (ii)
Lower in (i) than (ii)
Array
cDNA clones RNA-cy3
(i) Control
RNA-cy5 (ii) Experimental Test RNAs
Flourescent labels +
Ratio > 2
1 < 0.5
(a)
(b)
cDNAs demonstrated a direct link to agricultural application [15•].
Worldwide, many plant genomic programs have been fund-ed to carry out genomic sequencing, establish sets of ESTs, and develop microarray technology. In the near future, microarray studies in many economically important crops (e.g. maize, cotton, rice, soybean, canola, tomato, and fir) will contribute to our knowledge of fundamental questions as well as commercially interesting traits [16•]. In the USA, the National Science Foundation (NSF)-funded Arabidop-sis Functional Genomics Consortium (AFGC) will carry out an extensive survey of gene expression in different tissues, organs, genetic conditions and in response to a variety of treatments (Table 2). The AFGC will perform microarray experiments for the scientific community starting in the year 2000 and has already developed an extensive plant array with 11,000 non-redundant Arabidopsis ESTs (http://afgc.stanford.edu/). A preliminary experiment demonstrated that a considerable number of the leaf mRNAs are differentially expressed in a day/night-depen-dent manner (Figure 2; R Schaffer, unpublished data).
Major findings
microarrays have been created, including tissue-specific [27] and disease-specific gene chips [28,29]. Initial results have been presented in other organisms, such as Drosophi-la[30], Escherichia coli[31–33] and viruses [34].Experiments looking at the progression of gene expression in yeast demonstrated how gene messages vary throughout development or in response to different stimuli. The yeast ORF microarray was used to determine mRNA profiles under a variety of conditions, including cell-cycle progres-sion [35], diauxic shift [36], carbon and nitrogen starvation [17••], alkylating treatment [37] and sporulation [19•]. For example, Chu et al. [19•] showed that 500 genes were dif-ferentially expressed during spore development. Cluster analysis, which categorises genes into groups with similar cellular functions, confirmed that sporulation is comprised
of two major stages: meiotic prophase versus meiotic divi-sion and gametogenesis. The potential of DNA microarrays to discover gene functions for novel genes was exemplified by classification of various novel genes with unknown function into the meiotic cluster.
Microarrays have also identified commonalities underlying complex regulatory networks. Comparison of carbon star-vation, the diauxic shift response and sporulation showed shared similarities, whereas the nitrogen starvation response induces a much different set of genes [17••].
Even in a well-characterized organism such as yeast, only ~50% of the genes have a known or hypothesized function based on sequence homology to characterized genes. The other half of the genes have no information available. In yeast, a competitive fitness test has been developed to eval-uate the importance of a particular gene during the life cycle [38•,39••]. The competitive growth of cell lines carrying mutations in genes affecting growth cause an under repre-sentation of those strains. In this manner, genes can be identified that increase the relative fitness of the strain. Notably, competition tests detected little correlation between the relative fitness of a gene and its induced expres-sion level under similar growth conditions. This suggests that the upregulation of a gene in response to a specific growth condition is not necessarily predictive for a positive role of this gene in the fitness under that specific growth condition. Table 2
Research interests of the AFGC microarray project team.
Topics
Plants subjected to different treatments Plant-specific genes with unknown function
AFGC, Arabidopsis Functional Genomics Consortium.
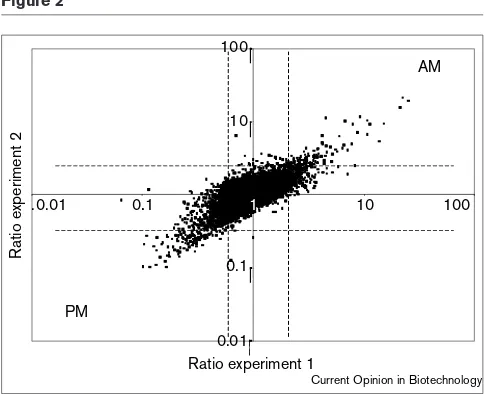
Figure 2
A scatter plot of gene expression ratios measured in leaves harvested at two different time points of the day (AM, morning; PM, afternoon). Plants were grown in 12 hours light, 12 hours dark conditions. RNA samples were isolated from tissue harvested at 0 hours and 12 hours, labeled and hybridized to an array (experiment 1). The fluorescent labels for each RNA sample were reversed in a second experiment (experiment 2). The ratios 0 hrs:12 hrs from each experiment were plotted on a graph. Dashed lines mark the 2-fold ratio in each experiment. cDNAs showing ratios greater than 2 are expressed only in the morning, whereas those with a value less than 0.5 are expressed only in the afternoon. This graph shows that the majority of cDNAs do not show different expression during the day.
the transcriptional initiation machinery was successfully carried out using knockout and overexpression mutants. Dozens of transcripts are affected by the mitogen-activat-ed protien kinase (MAPK) pathway [40], whereas nearly all yeast genes showed a reduced expression in response to the suppression of components of the RNA polymerase II complex [41••].
In humans, major efforts are directed towards the mole-cular understanding of diseases. Types of cancer can be subdivided further based on their expression profiles and the significant diagnostic value of gene profiling in tumor tissue has been demonstrated by the ability to dis-tinguish between and within diagnostic groups [24••]. Future uses of DNA microarrays will prove to be benefi-cial to human medicine, both at the level of improved diagnosis and treatment, as well as speeding the devel-opment of novel drugs.
Future directions
Global gene expression studies are best facilitated by microarrays. In the rush to produce many exciting data, a thoughtful study evaluating the accuracy of the microar-rays has been lacking. Statistical principles specially designed for microarray experiments have yet to be evalu-ated, and current methods of error probability have to be further developed and evaluated. Different methods of creating microarrays along with techniques for data visual-ization, analysis tools and database design for efficient presentation are under continous development. It is clear that the field relies on the expertise of many disciplines and we face new challenges in setting up fruitful collabo-rations to combine a wide breadth of knowledge.
There is no doubt that plant biology will be revolution-ized through the enormous amount of data produced by global gene expression studies. As the examples present-ed from yeast demonstrate, clustering of genes with similar expression patterns will be a powerful means of connecting genes with unknown function to a particular pathway or process. Common conserved motifs with a predicted regulatory function can be put to test in other species. It will be feasible to identify the genes involved in the response to environmental changes, pathogen attack and to many other artificial challenges, such as treatment with hormones and pesticides. These genes may provide important clues for plant breeders of how to protect plants from natural challenges.
Another expected application for plant breeders is the abil-ity to link expression patterns with complex traits, allowing the identification of plants with good traits, such as high yield, early in plant development. This would be especial-ly relevant to slow growing crops, such as fruit trees, where genotypically ‘bad’ plants could be removed early in the breeding program, thus the breeding program will be faster
insight into how a gene mutation leads to a particular phe-notype or, in contrast, to the absence of a phephe-notype.
Differential expression of genes between two closely relat-ed species, such as Arabidopsisand Brassica napusor other accessions, might give clues to the genetic basis of many economically important traits. Microarrays are expected to be of particular use for such analysis because differences in gene regulation most probably play an important role in the evolution of species [42••].
Conclusions
Many exciting results have been obtained in the past few years, giving a glimmer of insight into how groups of genes are regulated and how they interact. New applications of these technologies are under continuous development. For the first time, we are generating more data than we can possibly analyze. In one experiment, tens of thousands of data points are generated. The common method of pub-lishing data in journals is no longer satisfactory and many groups are now making data sets available over the Inter-net. Global-scale gene expression studies in plants will follow these trends and will generate much data applicable to agriculture as well as basic science. Once a greater understanding of gene expression has been achieved, the true benefit of microarrays will be realized.
Acknowledgements
This work was supported by a grant from the National Science Foundation to the Arabidopsis Functional Genomics Consortium (no DBI-9872638).
References and recommended reading
Papers of particular interest, published within the annual period of review, have been highlighted as:
• of special interest ••of outstanding interest
1. Velculescu VE, Zhang L, Vogelstein B, Kinzler KW: Serial analysis of gene expression.Science1995, 270:484-487.
2. Shimkets RA, Lowe DG, Tai JT, Sehl P, Jin H, Yang R, Predki PF, Rothberg BE, Murtha MT, Roth ME et al.: Gene expression analysis by transcript profiling coupled to a gene database query.Nat Biotechnol1999, 17:798-803.
3. Liang P, Pardee AB: Differential display of eukaryotic messenger RNA by means of the polymerase chain reaction.Science1992, 257:967-971.
4. Duggan DJ, Bittner M, Chen Y, Meltzer P, Trent JM: Expression •• profiling using cDNA microarrays.Nat Genet1999, 21:10-14. An excellent review of the technical aspects of cDNA microarrays including the general principles, fabrication of arrays, target labeling, image analysis and data extraction and mining.
5. Baldwin D, Crane V, Rice D: A comparison of gel-based, nylon filter • and microarray techniques to detect differential RNA expression
in plants.Curr Opin Plant Biol1999, 2:96-103.
This paper provides useful information about microarrays, nylon microarrays, glass microarrays and oligonucleotide chips, including the addresses of places to buy filters and equipment. Parameters of the different technologies are compared, such as amount of sample, detection limit and sensitivity.
7. Lipshutz RJ, Fodor SP, Gingeras TR, Lockhart DJ: High density synthetic oligonucleotide arrays.Nat Genet1999, 21:20-24.
8. Eisen MB, Brown PO: DNA arrays for analysis of gene expression. • Methods Enzymol1999, 303:179-205.
A review that gives a detailed description of all experimental steps of a microarray experiment. For each step of the procedure, from preparing RNA samples to array printing, slide blocking, probe labeling, hybridization and reading the slides, trouble shooting remarks are given.
9. Meinke DW, Cherry JM, Dean C, Rounsley SD, Koornneef M: • Arabidopsis thaliana: a model plant for genome analysis.Science
1998, 282:662, 679-682.
An update about the progress in the field of Arabidopsis genomics. A useful paper that lists all websites of community resources. Also, the bio-logical and genetic properties are highlighted that make Arabidopsis a model system.
10. Somerville C, Somerville S: Plant functional genomics.Science 1999, 285:380-383.
11. Schena M, Shalon D, Davis RW, Brown PO: Quantitative monitoring of gene expression patterns with a complementary DNA microarray. Science1995, 270:467-470.
12. Ruan Y, Gilmore J, Conner T: Towards Arabidopsis genome analysis: monitoring expression profiles of 1400 genes using cDNA microarrays.Plant J1998, 15:821-833.
13. Kehoe D, Villand P, Somerville S:DNA microarrays for studies of higher plants and other photosynthetic organisms.Trends Plant Sci1999, 4:38-44.
14. Desprez T, Amselem J, Caboche M, Hofte H: Differential gene expression in Arabidopsis monitored using cDNA arrays. Plant J 1998, 14:643-652.
15. Lemieux B, Aharon M, Schena M: Overview of DNA chip technology. • Mol Breeding 1999, 4:277-289.
This review describes the different techniques for producing high-density arrays. Furthermore, the different applications of microarrays are explained with an emphasis on the potential applications in agribusiness.
16. Walbot V: Genes, genomes, genomics. What can plant biologists • expect from the 1998 National Science Foundation plant genome
research program?Plant Physiol1999, 119:1151-1156.
An overview of all plant genomic projects funded by NSF. The goals of these projects and the applications are pointed out. Contains a list of all relevant websites.
17. Kao CM: Functional genomic technologies: creating new •• paradigms for fundamental and applied biology.Biotechnol Prog
1999, 15:304-311.
This paper presents the applications of microarrays to fundamental and applied biological problems in yeast. Examples are given for secondary metabolite fermentation development and cellular response to stress. Two principles to gain insight into gene function are described: those that derive information from altered gene function and those that observe the behavior of intact genes.
18. Winzeler EA, Schena M, Davis RW: Fluorescence-based expression monitoring using microarrays.Methods Enzymol 1999, 306:3-18.
19. Chu S, DeRisi J, Eisen M, Mulholland J, Botstein D, Brown PO, • Herskowitz I: The transcriptional program of sporulation in
budding yeast.Science1998, 282:699-705.
A genome-wide inventory of yeast genes that are induced or repressed in response to sporulation. This analysis demonstrates the power of cluster analysis for grouping genes into different pathways. The gene expression patterns during sporulation followed two major stages in meiosis: first, the meiotic prophase; and second, meiotic division and gamete morphogenesis. Novel genes participating in the meiotic pathway were discovered.
20. Cole KA, Krizman DB, Emmert-Buck MR: The genetics of cancer: a 3D model.Nat Genet1999, 21:38-41.
21. Debouck C, Goodfellow PN: DNA microarrays in drug discovery and development.Nat Genet1999, 21:48-50.
22. Yang GP, Ross DT, Kuang WW, Brown PO, Weigel RJ: Combining SSH and cDNA microarrays for rapid identification of differentially expressed genes.Nucleic Acids Res1999, 27:1517-1523.
23. Khan J, Saal LH, Bittner ML, Chen Y, Trent JM, Meltzer PS: Expression profiling in cancer using cDNA microarrays. Electrophoresis1999, 20:223-229.
24. Golub TR, Slonim DK, Tamayo P, Huard C, Gaasenbeek M, Mesirov JP, •• Coller H, Loh ML, Downing JR, Caligiuri MA et al.: Molecular
classification of cancer: class discovery and class prediction by gene expression monitoring.Science1999, 286:531-537. The authors describe the classification of two types of leukemia, acute myeloid leukemia (AML) and acute lymphoblastic leukemia (ALL), based on specific gene expression patterns. Statistical methods for class discovery and predic-tion were shown to distinguish between subtypes of human acute leukemias.
25. Iyer VR, Eisen MB, Ross DT, Schuler G, Moore T, Lee JCF, Trent JM, • Staudt LM, Hudson J Jr, Boguski MS: The transcriptional program in
the response of human fibroblasts to serum.Science1999, 283:83-87.
This experiment follows gene expression over 15 time points in response of human fibroblast to serum. First responses occurred within 15 minutes as shown by the up- and down-regulation of transcription factors. Genes were clustered according to their response pattern, such as those showing an early or late response, genes that peaked shortly and genes that were first up-regulated and then down-regulated.
26. Lashkari DA, DeRisi JL, McCusker JH, Namath AF, Gentile C, Hwang SY, Brown PO, Davis RW: Yeast microarrays for genome wide parallel genetic and gene expression analysis.Proc Natl Acad Sci USA 1997, 94:13057-13062.
27. Loftus SK, Chen Y, Gooden G, Ryan JF, Birznieks G, Hilliard M, Baxevanis AD, Bittner M, Meltzer P, Trent J, Pavan W: Informatic selection of a neural crest-melanocyte cDNA set for microarray analysis. Proc Natl Acad Sci USA1999, 96:9277-9280.
28. Heller RA, Schena M, Chai A, Shalon D, Bedilion T, Gilmore J, Woolley DE, Davis RW: Discovery and analysis of inflammatory disease-related genes using cDNA microarrays.Proc Natl Acad Sci USA1997, 94:2150-2155.
29. Welford SM, Gregg J, Chen E, Garrison D, Sorensen PH, Denny CT, Nelson SF: Detection of differentially expressed genes in primary tumor tissues using representational differences analysis coupled to microarray hybridization.Nucleic Acids Res1998, 26:3059-3065.
30. White KP, Rifkin SA, Hurban P, Hogness DS: Microarray analysis of Drosophila development during metamorphosis.Science1999, 286:2179-2184.
31. Gingeras TR, Ghandour G, Wang E, Berno A, Small PM, Drobniewski F, Alland D, Desmond E, Holodniy M, Drenkow J: Simultaneous genotyping and species identification using hybridization pattern recognition analysis of generic Mycobacterium DNA arrays. Genome Res1998, 8:435-448.
32. Richmond CS, Glasner JD, Mau R, Jin H, Blattner FR: Genome-wide expression profiling in Escherichia coli K-12.Nucleic Acids Res 1999, 27:3821-3835.
33. Behr MA, Wilson MA, Gill WP, Salamon H, Schoolnik GK, Rane S, Small PM: Comparative genomics of BCG vaccines by whole-genome DNA microarray.Science1999, 284:1520-1523.
34. Chambers J, Angulo A, Amaratunga D, Guo H, Jiang Y, Wan JS, Bittner A, Frueh K, Jackson MR, Peterson PA et al.: DNA microarrays of the complex human cytomegalovirus genome: profiling kinetic class with drug sensitivity of viral gene expression.J Virol1999, 73:5757-5766.
35. Spellman PT, Sherlock G, Zhang MQ, Iyer VR, Anders K, Eisen MB, Brown PO, Botstein D, Futcher B: Comprehensive identification of cell cycle-regulated genes of the yeast Saccharomyces cerevisiae
by microarray hybridization.Mol Biol Cell1998, 9:3273-3297.
36. DeRisi JL, Iyer VR, Brown PO: Exploring the metabolic and genetic control of gene expression on a genomic scale.Science1997, 278:680-686.
37. Jelinsky SA, Samson LD: Global response of Saccharomyces cerevisiaeto an alkylating agent.Proc Natl Acad Sci USA1999, 96:1486-1491.
38. Ferea TL, Botstein D, Brown PO, Rosenzweig RF: Systematic • changes in gene expression patterns following adaptive evolution
in yeast.Proc Natl Acad Sci USA1999, 96:9721-9726.
This in vivo whole-genome approach identified genes that affect growth in a systematically manner. As a first step, deletion mutants for 2026 yeast genes were generated. Second, they were subjected to a competitive fitness test by growing mixtures of 500 mutant strains for a number of generations. Mutants that affected growth caused an under representation of those strains. In this manner, genes were identified that increased the relative fitness of the strain. The abundance of the mutants in the mixture was measured on microarrays.
40. Madhani HD, Galitski T, Lander ES, Fink GR: Effectors of a
developmental mitogen-activated protein kinase cascade revealed by expression signatures of signaling mutants.Proc Natl Acad Sci USA1999, 96:12530-12535.
machinery on gene expression via mutant analysis. Distinct sets of genes and a distinct percentage of genes depend on the functions of components of the RNA polymerase II holoenzyme, the general transcription factor TFIID, and the SAGA chromatin modification complex.
42. Doebley J, Lukens L: Transcriptional regulators and the evolution of •• plant form.Plant Cell1998, 10:1075-1082.