Original Article
Assessment of body composition of female volleyball players of various
performance levels
PETR KUTÁČ1
, MARTIN SIGMUND2 1
Human Motion Diagnostics Center, University of Ostrava, Ostrava, CZECH REPUBLIC 2Faculty of physical culture, Palacký University, Olomouc, CZECH REPUBLIC
Published online: June 30, 2017 (Accepted for publication June 02, 2017)
DOI:10.7752/jpes.2017.02084
Abstract:
The objective of the study was to verify the significance of somatic parameters as performance factors in volleyball. The study included a total of 164 females. Thirty-nine females (age 23.4±2.8 years) were elite volleyball players (G1), 45 (age 23.7±3.7 years) were amateur volleyball players (G2), and 80 (age 22.7±1.3 years) were females from the general population (G3) and represented the control group. The measured parameters included the following: body height; body mass; body fat and its segmental analysis; total body water and its components, extracellular water (ECW) and intracellular water (ICW); and fat free mass and its components, body cell mass (BCM), extracellular mass (ECM), and skeletal muscle mass (SMM). To assess the differences in body composition, values between the test groups, standardized changes in the means (effect size, ES) and 90% confidence limits (90% CL) were used. In female players of a higher performance level, more appropriate values of body composition parameters in terms of performance were observed. The differences between G1 and G2 were moderate to large. With increasing player performance, the differences in values increased relative to the values of the G3 control group. An exception to this finding was the absence of a difference in the basic anthropometric parameters (BH, BM) between G1 and G2 players. The results of the study confirmed that body composition parameters were part of the structure of sports performance in volleyball.
Key words: females, athletes, body fat, fat free mass, sports performance.
Introduction
Successful sports training requires knowledge of relevant factors that affect sports performance. Therefore, models of sports performance have been developed that attempt to capture these factors. These models include general models (Grosser & Zintl, 1999; Schnabel, Haare & Krug, 2003) as well as sport-specific models, including sports games. In addition to a number of other factors, all of these models include somatic factors. The somatic factors, also referred to as morphological or constitutional factors, that are most frequently cited by the aforementioned authors include body height, body weight and body composition. Somatic factors are also included in the sports performance structure of volleyball (Dhurata & Enkeleida, 2012; González-Ravé, Arija, & Clemente-Suarez, 2011; Scates & Linn, 2003). In terms of the activities performed during a volleyball match, the basic somatic parameter is body height. However, body composition is also a significant parameter. Body composition is the result of an organism’s adaptation to a load during fitness training (Kenny, Wilmore, & Costill, 2012). This adaptation is reflected not only in an athlete’s physical fitness and health but is also crucial to motor performance (Malá et al., 2015).
There are a number of studies related to body composition in female volleyball players. However, in most of these studies, the authors focus on the players’ morphological characteristics, changes in body composition throughout the season, or comparisons of these parameters with those of female players from other sports (Bayios, Bergeles, Apostolidis, Noutsos, & Koskolou, 2006; Carbuhn, Fernandez, Bragg, Green, & Crouse, 2010; González-Ravé et al., 2011; Malá et al., 2015; Martín-Matillas et al., 2014; Tsunawake et al., 2003). The most frequently monitored body composition parameter is the proportion of BF in overall BM. Therefore, in the present study, the authors focused on the identification of body composition with a larger number of parameters and on a comparison of these parameters between players of different performance levels. The study also included a comparison of the monitored parameters with those of the general population of the same age category. The sizes of the differences between the volleyball players’ monitored values and those of the general population should also be an indicator of the volleyball players’ performance level and degree of readiness for sports performance.
Materials and methods
Participants
The study involved a total of 164 females who were divided into 3 groups. Group 1 (G1) comprised elite volleyball players in the top volleyball league in the Czech Republic who regularly participated in the play-offs. During the competition period, these players underwent 6 volleyball training units per week (15.5 hours per week on average). Group 2 (G2) comprised female volleyball players from an amateur league. During the competition period, these players underwent 3 volleyball training units per week (5 hours per week on average). The control group 3 (G3) comprised females without regular organized physical activity. The basic characteristics of the monitored groups are shown in Table 1. All of the research participants had no health problems and did not take any medications or dietary supplements. All of the tests were carried out during the oestrogenic phase of participants’ menstrual cycles. Participation in the research was voluntary; the participants were informed of the course of the research in advance. All participants signed an informed consent to their participation in this research. The research was approved by the Ethics Committee of the University of Ostrava and complied with the Declaration of Helsinki.
Table 1 Basic anthropometric variables of the study groups (mean ± SD)
Group n Age BH (cm) BM (kg) BMI (kg/m2)
G1 39 23.4±2.8 179.74±4.98 70.45±6.81 21.80±1.82 G2 45 23.7±3.7 178.08±6.32 70.94±7.02 22.35±1.54 G3 80 22.7±1.3 164.00±5.07 59.56±10.13 22.18±3.92
G1 – elite volleyball players, G2 – amateur volleyball players, G3 – general population, n – frequency, BH – body height, BM – body mass, BMI – body mass index, SD - standard
deviation
Procedures
The female volleyball players’ (G1 and G2) measurements were taken after their completion of the regular volleyball season; in the G3 control group, measurements were taken during the same period. All of the measurements were taken by the same examiner during the morning hours and complied with BIA measurement principles (Kyle et al., 2004). Body height (BH) was measured with Anthropometer A – 2013 (Trystom, Czech Republic), and body mass (BM) and body composition were measured with InBody 770 analyser (Biospace, South Korea). The InBody 770 analyser is a tetrapolar multi-frequency bioimpedance analyser using a frequency of 1,000 kHz; this instrument was simultaneously used as a scale. The measured parameters of body composition included the following: body fat (BF) and its segmental analysis; total body water (TBW) and its components: extracellular water (ECW) and intracellular water (ICW); fat free mass and its components: body cell mass (BCM), extracellular mass (ECM), and skeletal muscle mass (SMM).
Statistical analysis
--- 558
parameters of volleyball players (G1, G2) with the values of the general population (G3), the authors used the normalization index (Ni), whose values could be used to assess the development of the monitored indicator. Ni =
M1 = mean value of G1 or G2, M2 = mean value of G3, SD = standard deviation of G3. An Ni value in the range of ± .75 SD showed an average development of the indicator, and an Ni value in the range of ± .75 to 1.5 SD showed a below average (above average) development of the indicator. An Ni value above ±1.5 SD indicated below average (above average) development.
Results
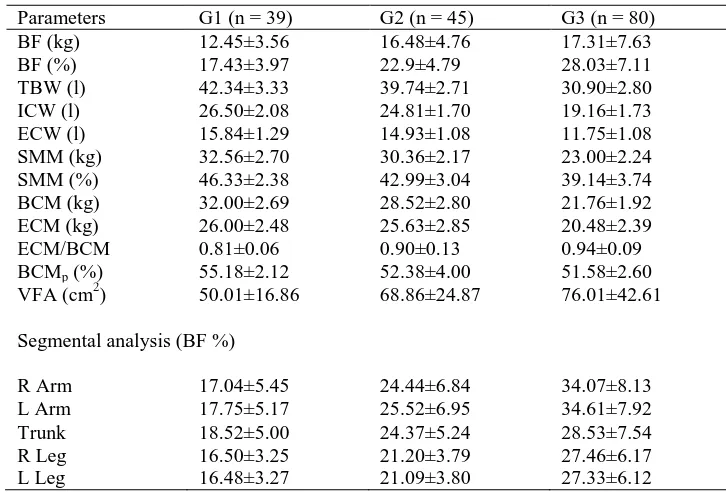
The mean values of each group’s monitored parameters of body composition are presented in Table 2.
Table 2 Body composition profiles (mean±SD)
Parameters G1 (n = 39) G2 (n = 45) G3 (n = 80)
BF (kg) 12.45±3.56 16.48±4.76 17.31±7.63
BF (%) 17.43±3.97 22.9±4.79 28.03±7.11
TBW (l) 42.34±3.33 39.74±2.71 30.90±2.80
ICW (l) 26.50±2.08 24.81±1.70 19.16±1.73
ECW (l) 15.84±1.29 14.93±1.08 11.75±1.08
SMM (kg) 32.56±2.70 30.36±2.17 23.00±2.24
SMM (%) 46.33±2.38 42.99±3.04 39.14±3.74
BCM (kg) 32.00±2.69 28.52±2.80 21.76±1.92
ECM (kg) 26.00±2.48 25.63±2.85 20.48±2.39
ECM/BCM 0.81±0.06 0.90±0.13 0.94±0.09
BCMp (%) 55.18±2.12 52.38±4.00 51.58±2.60
VFA (cm2) 50.01±16.86 68.86±24.87 76.01±42.61
Segmental analysis (BF %)
R Arm 17.04±5.45 24.44±6.84 34.07±8.13
L Arm 17.75±5.17 25.52±6.95 34.61±7.92
Trunk 18.52±5.00 24.37±5.24 28.53±7.54
R Leg 16.50±3.25 21.20±3.79 27.46±6.17
L Leg 16.48±3.27 21.09±3.80 27.33±6.12
BF – body fat, TBW – total body water, ICW – intracellular water, ECW – extracellular water, SMM – skeletal muscle mass, BCM – body cell mass, ECM - extracellular mass, BCMp (%) – percentage of BCM in FFM (FFM = BCM+ECM), VFA - visceral fat area, R – right, L – left, G1 – elite volleyball players, G2 – amateur volleyball players, G3 – control group, SD – standard deviation, n – frequency
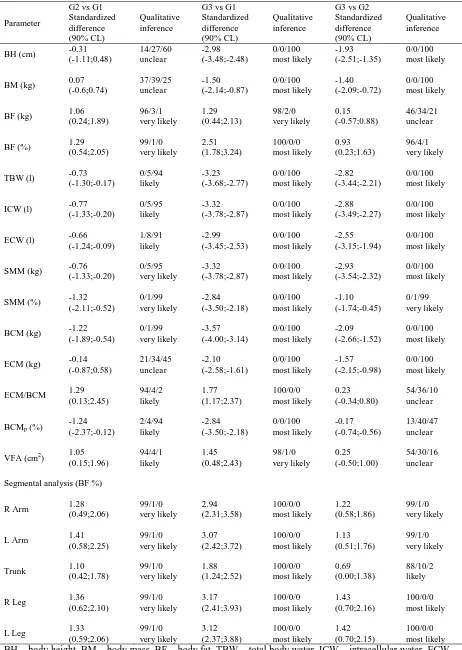
Comparison of values of elite female volleyball players (G1) and amateur female volleyball players (G2)
Regarding the confidence limits, the differences between BH, BM, and ECM could not be compared (unclear differences). For other parameters, the differences could be assessed. For the values of hydration of the organism (TBW, ICW, ECW, ECW/TBW), BF (kg), SMM (kg), and VFA, the differences were found to be moderate (likely and very likely). A large difference (likely and very likely) was observed for the following parameters: BF (%), SMM (%), BCM, ECM/BCM, and BCMp (%).
A segmental analysis of BF distribution revealed large differences in the extremities (very likely) and moderate differences (very likely) in the trunk (Table 3).
Comparison of values of female volleyball players (G1, G2) and control group (G3)
With regard to the confidence limits, it was not possible to compare the values ECM/BCM, BCMp (%), BF (kg) and VFA between G2 and G3 (unclear difference). The differences between G1 and G3 were moderate (most likely) for ECW/TBW, large (very and most likely) for BM, BF (kg), ECM/BCM, VFA, and for the segmental analysis of the trunk. For other parameters of whole-body as well as segmental analyses, the differences were very large (most likely). The differences between G2 and G3 were moderate (likely and very likely) for BF (%), ECW/TBW, SMM (%), and for the segmental analysis of the left arm and trunk. Large (very and most likely) differences were observed for BH, BM, ECM, and for the segmental analysis of the right arm and lower extremities (right and left leg). For the hydration parameters (TBW, ICW, ECW), BCM, and SMM, the differences were large (most likely) (Table 3).
--- 560
The between-trial differences are expressed as standardized (Cohen) differences of the mean (90% confidence limits) and ratings of the difference.
Discussion
The female volleyball players of both performance categories (G1, G2) had significantly higher body heights and body weights compared to the control group (G3). This fact is documented by the measured ES values (Table 3) as well as Ni values (Table 4). According to Ni,the values of BH could have been assessed to be highly above average and the values of BM as above average. The higher values of body weight in the female players were caused by their higher BH, which was also shown by negligible differences in BMI values (Table 4). The values of BH and BM between G1 and G2 could not be compared (qualitative inference was unclear). However, the identified mean values corresponded with reported values in general elite professional female players (Malá et al., 2015; Martín-Matillas et al., 2014; Zapolska, Witczak, Mańczuk, & Ostrowska, 2014).
The minimal differences in overall BM (Table 1, 3) between G1 and G2 allowed for assessments of the differences in body composition parameters between these two groups and for absolute values (Table 2). The differences in the mean values of BF between G1 and G2 was 4 kg, which represented 5.47% of BF. This difference was also reflected in the higher difference in the proportion of BF for G1 vs G2 than for G2 vs G3. For G1, the proportion of BF (%) was below average in relation to G3; for G2, the proportion of BF was average (Table 4). These differences were also reflected in the segmental analysis values: in all segments, G1 players had the lowest proportion of BF (%); the G3 control group had the highest. The smallest differences were in the abdominal area (trunk segment), which was also confirmed by the VFA values (Table 3, 4). Compared to the G3 control group, greater differences were again observed in G1 players (Table 4). A comparison between the measured values of the proportion of BF (%) in this study’s female players and the results of other studies was very problematic. The authors used different methods and analysers, and the resulting values were in the range of 10 – 24% BF (Kenny, Wilmore, & Costill, 2012; Malý, Malá, Zahálka, Balas, & Cada 2011; Malá et al., 2015; Martín-Matillas et al., 2014; McArdle, Katch, & Katch, 2007; Mielgo-Ayuso, Zourdos, Calleja-González, Urdampilleta, & Ostojic, 2015). The mean values in this study’s female volleyball players (G1, G2) also fell within this wide range.
The differences in the proportion of BF were also reflected in the different proportions of FFM (BCM+ECM). The differences in their components were crucial to the assessment of FFM. This assessment was expressed by the ECM/BCM index. The higher the proportion of BCM in overall FFM, the lower the value of the index was. This implied that a lower value of the index was a precondition for better physical performance. Values greater than 1 meant that the usability of fat-free mass for muscle work was low (Bunc, 2006), which also indicated a weak precondition for physical performance. In highly trained male athletes (footballers, triathletes), the generally reported values were approximately 0.7 (Kutáč, 2014; Psotta et al., 2007; Psotta, Svěráková, Bunc, Šeflová, & Hráský, 2009). In female athletes, the values were higher. In her study, Malá et al. (2015) focused on body composition in female players of various sports and reported values between 0.73 and 0.80, depending on the specific sport. The values reported for female volleyball players were 0.79 – 0.89 (Malá, Malý, Zahálka, & Bunc, 2010; Malý et al., 2011). Only the mean values of this study’s G1 elite female players corresponded to these values. The differences between G1 and G2 and between G1 and G3 reflected the differences in physical activity during volleyball training. A surprising fact was the low level of differences between G2 players and the G3 control group. The differences could not be assessed using ES (qualitative inference was unclear) (Table 3); according to Ni, the value of G2 was average with respect to the value of G3 (Table 4). Training sessions undertaken by G2 players were apparently insufficient for the development of the organism for the respective load. The differences were a reflection of the proportion of BCM in overall FFM (BCMp %). The greatest proportion was observed in G1 elite players; the values of G2 players and the G3 control group could not be compared (Table 3). When Ni was used, the values of G2 players were average (Table 4). FFM also included skeletal muscle mass (SMM). The proportion of SMM depended on the individual’s amount of physical activity, which was confirmed by the present study. The greatest proportion of SMM in BM was observed in G1 players, with the lowest in the G3 control group. This fact was confirmed by the identified ES results (Table 3) as well as Ni values. Compared to the G3 control group, G1 players had highly above average values, while G2 players had above average values (Table 4).
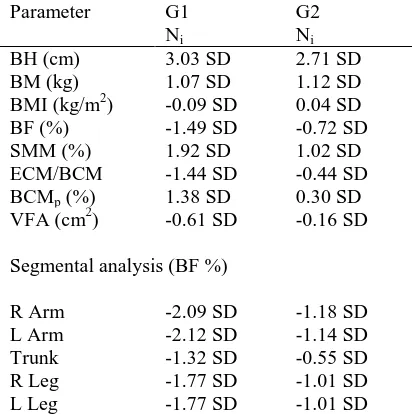
Table 4 Values of normalization indices Ni in female volleyball players
Parameter G1
Ni
G2 Ni
BH (cm) 3.03 SD 2.71 SD
BM (kg) 1.07 SD 1.12 SD
BMI (kg/m2) -0.09 SD 0.04 SD
BF (%) -1.49 SD -0.72 SD
SMM (%) 1.92 SD 1.02 SD
ECM/BCM -1.44 SD -0.44 SD
BCMp (%) 1.38 SD 0.30 SD
VFA (cm2) -0.61 SD -0.16 SD
Segmental analysis (BF %)
R Arm -2.09 SD -1.18 SD
L Arm -2.12 SD -1.14 SD
Trunk -1.32 SD -0.55 SD
R Leg -1.77 SD -1.01 SD
L Leg -1.77 SD -1.01 SD
BH – body height, BM – body mass, BMI – body mass index, BF – body fat, SMM – skeletal muscle mass, BCMp (%) - percent BCM in FFM (FFM = BCM+ECM), VFA - visceral fat area, R – right, L – left, G1 – elite volleyball players, G2 – amateur volleyball players, Ni – normalization index, SD – standard deviation
Conclusion
In female players of a higher performance level, more appropriate values of body composition parameters in terms of performance were observed. This finding was also confirmed by the increasing differences between these groups and the G3 control group with increasing performance. An exception was the absence of a difference in the basic anthropometric parameters (BH, BM) between G1 and G2 players. It was apparent that already at the amateur level, a sufficient value of BH was a necessary prerequisite for an athlete to play volleyball.
The results of this study confirmed that body composition parameters were part of the structure of sports performance even in volleyball, and a prerequisite to achieve an elite performance level was adequate fitness training, a precondition for adequate adaptation and optimal development of somatic parameters.
References
Batterham, A. M., & Hopkins, W. G. (2006). Making meaningful inferences about magnitudes. Int J Sports Physiol Perform, 1(1), 50-56.
Bayios, I. A., Bergeles, N. K., Apostolidis, N. G., Noutsos, K.S., & Koskolou, M. D. (2006). Anthropometric, body composition and somatotype differences of Greek elite female basketball, volleyball and handball players. The Journal of Sports Medicine and Physical Fitness, 46(2), 271–280.
Bunc, V. (2004). Physiological and functional characteristics of adolescent athletes in several sports: impications for talent identification. In M. C. Silva & R. Malina (Eds), Children and Sport in Organized Sports (pp. 115-125). Coimbra: I. Da Universidade.
Bunc, V. (2006). Body composition as a determining factor in the aerobic fitness and physical performance of Czech children. Acta gymnica, 36(4), 39-45.
Carbuhn, A. F., Fernandez, T. E., Bragg, A. F., Green, J.S., & Crouse, S.F. (2010). Sport and training influence bone and body composition in women collegiate athletes. The Journal of Strength and Conditioning Research, 24(7), 1710–1717.
Dhurata, B., & Enkeleida L. (2012). Comparative analysis of Albanian female volleyball players with anthropometric, performance and hematological paramaters. Science movement and health, 12(2), 287– 293.
González-Ravé, J.M., Arija, A., & Clemente-Suarez, V. (2011). Seasonal changes in jump performance and body composition in women volleyball players. The Journal of Strength and Conditioning Research, 25(6), 1492-1501.
Grosser, M., & Zintl, F. (1994). Training of the physical conditions. Schorndorf: Hoffman.
Hank, M., Zahalka, F., & Maly T. (2015). Comparison of spiker´ss distance in ellite female volleyball. Sport Science, 8(Suppl. 2), 102-106.
Heymsfield, S.B., Lohman, T.G., Wang, Z., & Going, S.B. (2005). Human body composition. Champaign, IL: Human Kinetics.
--- 562
Hopkins, W.G., Marshall, S.W., Batterham, A.M., & Hanin J. (2009). Progressive statistics for studies in sports medicine and exercise science. Medicine and Science in Sports and Exercise, 41(1), 3-13.
Kenny, W.L., Wilmore, J.H., & Costill, D.L. (2012). Physiology of Sport and Excercise. Champaign, IL: Human Kinetics.
Kutáč, P. (2014). The effect of intake of water on the final values of body composition parameters in active athletes using two different bioimpedance analyzers. Acta Gymnica, 44(2), 107-116.
Kyle, U. G., Bosaeus, I., De Lorenzo, A. D., Deurenberg, P., Elia, M. … Pichard, C. (2004). Bioelectrical impedance analysis – part II: utilization in clinical practice. Clinical Nutrition, 23(6), 1430–1453. Malá, L., Malý, T., Zahálka, F., & Bunc, V. (2010). The profile and comparison of body composition of elite
female volleyball players. Kinesiology, 42(1), 90–97.
Malý, T., Malá, L., Zahálka, F., Balas, J., & Cada, M. (2011). Comparison of body composition between two elite women's volleyball teams. Acta Gymnica, 41(1), 15–22.
Malá, L., Malý, T., Zahálka, F., Bunc, V., Kaplan, A., … Tůma, M. (2015). Body Composition of Elite Female Players in Five Different Sports Games. Journal of Human Kinetics, 45(1), 207–215.
Malina, R. M. (2007). Body composition in athletes: assessment and estimated fatness. Clinics in Sports Medicine, 26(1), 37–78.
Martín-Matillas, M., Valadés, D., Hernández-Hernández, E., Olea-Serrano, F., Sjöström, M. … Ortega, F. B. (2014). Anthropometric, body composition and somatotype characteristics of elite female volleyball players from the highest Spanish league. Journal of Sports Sciences, 32(2), 137-148.
McArdle, W. D., Katch, F. I., & Katch, V. l. (2007). Excercise Physiology. Energy, Nutrition, & Human Performance. Champaign, IL: Human Kinetics.
Mielgo-Ayuso, J., Zourdos, M. C., Calleja-González, J., Urdampilleta, A., & Ostojic, S. M. (2015). Dietary intake habits and controlled training on body composition and strength in elite female volleyball players during the season. Appl Physiol Nutr Metab, 40(8), 827-834.
Psotta, R., Bunc, V., Tenney, D., Svěráková, D., Hráský, P., & Šeflová I. (2007). Physiological profile of Czech elite summer biathletes of both sexes. Gazzetta Medica Italiana, 166(5), 169-179.
Psotta, R., Svěráková, D., Bunc, V., Šeflová, I., & Hráský, P. (2009). Aerobic fitness, running performance and body composition of Czech elite male summer biathletes. International Journal of Fitness, 5(1), 41-49. Scates, A. L., & Linn, M. (2003). Conditioning for Volleyball. Champaign, IL: Human Kinetics.
Schnabel, G., Haare H. D., & Krug, J. (2008). Theory of Training – Science in Training. Aachen: Meyer & Meyer Verlag.
Tillman, M. D., Hass, Ch. J, Brunt, D., & Bennett, G.R. (2004). Jumping and landing techniques in elite women’s Volleyball. Journal of Sports Science and Medicine, 3(1), 30-36.
Tsunawake, N., Tahara, Y., Moji, K., Muraki, S., Minowa, K., & Yukawa, K. (2003). Body composition and physical fitness of female volleyball and basketball players of the Japan inter-high school championship teams. Journal of Physiological Anthropology and Applied Human Science, 22(4), 195-201.