M – 17
BUILDING A MODEL TO PREDICT SCHOOL ACCREDITATION RANK
USING BOOSTED CLASSIFICATION TREE
Yesi Nindahayati, Hari Wijayanto, Bagus Sartono
Bogor Agricultural University, Indonesia
Abstract
Education has a key role to make a better life. The Education for All (EFA) is a global movement led by UNESCO, aiming to provide good basic education for all children, youths and adults. Indonesian government has committed to improve the education quality as stated in law on national education system (Law No. 20/2003). School accreditation rank which is issued by National Accreditation Board for School/Madrasah (BAN S/M) is depiction of education quality provided by school. However the number of accredited school has not met the target yet so that the government faces difficulty in the planning of budget and actions. The prediction of school classification based on accreditation rank to the un-accredited schools, therefore, has important role as reference to improve quality of education.
In recent years the introduction of aggregation methods led to many new techniques within the field of prediction and classification. Boosting is one of the widely used ensemble for classification with a goal of improving the accuracy of classifier. The objective of this study is to predict school accreditation rank using boosted classification tree compared to single tree utilizing the education database. It is showed that the accuracy of prediction is improved by use of boosting method. Comparisons between the methods are based on misclassification rates as well as criteria that take ordinality into account, like mean absolute error, mean square error and Kendall’s association measures.
Key words: boosting, classification tree, school accreditation rank
INTRODUCTION
Education has a key role to make a better life. The Education for All (EFA) is a global movement led by UNESCO, aiming to provide good basic education for all children, youths and adults. Indonesian government has committed to improve the education quality as stated in law on national education system (Law No. 20/2003), which is reflected by three pillars of education: access, quality and governance. As a part of quality assurance, government of Indonesia established National Accreditation Board for School/Madrasah, namely BAN S/M, to independently evaluate the school quality based on national education standards. A school accreditation rank which is issued by BAN S/M is depiction of education quality provided by the school.
school to be accredited was limited which depends on the national budget, many schools are scattered in various region in Indonesia and the schools are difficult to reach. The prediction of school classification based on accreditation rank to the un-accredited schools, therefore, has important role as reference to improve quality of education.
Ministry of National Education in 2010 has started to develop national education database which is known as Data Pokok Pendidikan (Dapodik). In this research, we will utilize Dapodik to predict school accreditation rank of schools, we limit ourselves to include junior secondary school in Banten Province only.
Classification Tree is one of the well-known class prediction method. Classification Tree is nonparametric computationally intensive method that has greatly increased in popularity during the past decades. Classification Tree can be applied to data sets having both a large number of cases and a large number of variables, and it is extremely resistant to outliers (Sutton, 2005).
In recent years the introduction of aggregation methods led to many new techniques within the field of prediction and classification. Boosting is one of the widely used ensemble for classification with a goal of improving the accuracy of classifier. The principle is to use a basic discrimination method not only once but for different versions of the data sets, boosting uses weights that depend on the performance in the last sample (Tutz & Hechenbichler, 2005). The purpose of this paper is to predict school accreditation rank using boosted classification tree compared to single tree utilizing the education database (Dapodik). Thus, Classification Tree is used as classifier method, and it will be demonstrated whether boosting will improve the accuracy of prediction. Comparisons between the methods are based on misclassification rates as well as criteria that take ordinality into account, like mean absolute error, mean square error and Kendall’s association measures.
RESEARCH METHOD
Classification Tree
Suppose independent observations to be classified are characterized by a -dimensional vector of predictors = ( , , …, ) and each observation falls into one of
classes. Let denote the class with = representing observations in class 1, =
representing class 2, and = representing class . When deriving a Classification Tree, all observations start together in the root node, t. Then, for predictors 1, 2,…, , the optimal split is determined, where optimality is defined as that split resulting in the largest decrease in node impurity (Archer, 2010).
For node t, the optimal split divides the observations to the left and right descendent nodes, dan , respectively, and the proportion of cases in each of the classes within these nodes are called the node proportions, that is, ( | ) for = 1,2, …, such that ( | ) +
( | ) + ⋯+ = 1. For nominal response classification, the within-node impurity measure most commonly used is the Gini criterion (Breiman, Friedman, Olshen, & Stone, 1984), defined as
( ) = ( | ) ( | )
One of the impurity function that can be used for ordinal response prediction is the generalized Gini impurity (Breiman et al., 1984), defined as
( ) = ( | ) ( | ) ( | )
categories of the response Y. In this research, we will use quadratic misclassification cost where
( | ) = ( − ) .
In order to compare the prediction accuracy of various tree-structured classifiers, there needs to be a way estimate a given tree’s misclassification rate for future observations, which is sometimes referred to as the generalization error (Sutton, 2005). A better estimate of a tree’s misclassification rate can be obtained using an independent test sample, which is collection of cases coming from the same population or distribution as the learning sample. The test sample estimate of the misclassification rate is proportion of the cases in the test sample that are misclassified when predicted classes are obtained using the tree created from learning sample.
For selecting the right-sized tree, first step is to grow a very large tree, splitting subsets in the current partition of X even if a split does not lead to an appreciable decrease in impurity. Then a sequence of smaller trees can be created by pruning the large tree, where in the pruning process, splits that were made are removed and a tree having a fewer number of nodes is produced. The accuracies of the members of this sequence of subtrees are then compared using good estimates of their misclassification rates (either based on a test sample or obtained by cross-validation), and the best performing tree in the sequence is chosen as the classifier (Sutton, 2005).
In this paper, we use the following algorithm to build the classification tree using rpart (Therneau, Atkinson, & Ripley, 2015) and rpartScore (Galimberti, Soffritti, & Di Maso, 2012) packages in R software.
1. Splitting the data into training set and testing set (70% vs. 30%)
2. Use training dataset to grow classification tree using Gini Criterion splitting method (nominal classification tree) with accreditation rank as response variable and 32 predictors from Dapodik (see Table 1 for the list of predictors)
3. Prune back the tree to avoid over fitting the data with selecting a tree size that minimizes the cross-validated error (10 fold cross validation)
4. Use testing dataset to calculate MER, MAE, MSE and kendall’s association measures.
Aside from nominal classification tree, we also use generalized Gini impurity as splitting method to take into account the ordinality in response variable. Algorithm to build this ordinal classification tree is same as nominal classification tree above, except in step 2 uses generalized Gini impurity instead of Gini criterion.
Boosting
Boosting is a method of combining classifiers, which are iteratively created from weighted versions of the learning sample, with the weights adaptively adjusted at each step to give increased weight to the cases which were misclassified on the previous step (Sutton, 2005). The final predictions are obtained by weighting the results of the iteratively produced predictors. The motivation for boosting was a procedure that combines the output of many weak classifier to produce a powerful committee (Hastie, Tibshirani, & Friedman, 2009). One of the best known boosting algorithm is AdaBoost (Freund & Schapire, 1996), but it can be only applied to binary classification problem. AdaBoost.M1 is the extension of AdaBoost for multiclass classification problem (Mukherjee & Schapire, 2011).
Given a training set = {( , ) , …, ( , ) ,…, ( , ) } where takes values in 1,2,…,k (Alfaro, Gámez, & Garcia, 2013). the weight ( ) is assigned to each observation and is initially set to 1 . This value will be updated after each step. A basic classifier ( ) is built on this new training set ( ) and is applied to every training sample. The error of this classifier is represented by and is calculated as
= ( ) ( ( ) ≠ )
otherwise.
From the error of the classifier in the b-th iteration, the constant is calculated and used for weight updating. Breiman (1998) uses = 1 2⁄ ln( ). The new weight for the (b+1)-th iteration will be (Alfaro et al., 2013)
( ) = ( ) exp( ( ( ) ≠ ) )
the calculated weights are normalized to sum one. Consequently, the weights of the wrongly classified observations are increased, and the weights of the rightly classified are decreased, forcing the classifier built in the next iteration to focus on the hardest cases. Alpha constant can be interpreted as a learning rate calculated as a function of the error made in each step. Moreover, this constant is also used in the final decision rule giving more importance to the individual classifiers that made a lower error. This process is repeated every step for b=1,…,B. Finally, the ensemble classifier calculates, for each class, the weighted sum of its votes. Therefore, the class with the highest vote is assigned.
AdaBoost.M1 algorithm can be described briefly as follows (Alfaro et al., 2013) 1. Start with ( ) = 1⁄ , = 1,2, …,
2. Repeat for = 1,2, …,
a.Fit the classifier ( ) = {1,2, …, } using weights ( ) on b.Compute: = ∑ ( ) ( ( ) ≠ and = 1 2ln( )
c.Update the weight ( ) = ( ) exp( ( ( ) ≠ ) ) and normalize them 3. Output of the final classifier ( ) = ar gmax
∈ ∑ ( ( ) = )
In this paper, AdaBoost.M1 algorithm is used to increase the accuracy of classifier. Classification tree (Breiman et al., 1984) is used as the classifier in this boosting. AdaBoost.M1 is applied to training dataset, while testing dataset is used for calculating MER, MAE, MSE and Kendall’s association measures. R adabag (Alfaro, Gámez, & Garcia, 2014) and rpart (Therneau et al., 2015) packages are used to build boosted classification tree.
Performance Measures
The evaluation of the methods is based on several measures of accuracy. As criterion for the accuracy of prediction, we use the Misclassification Error Rate (MER) whereas every misclassification is considered equally costly. MER is calculated as
1
( ≠ )
In the case of ordinal class structure measure should take into account that a larger distance is a more severe error than a wrong classification into a neighbor class. Therefore we use Mean Absolute Error (MAE) and Mean Square Error (MSE).
= 1 | − |
= = 1 ( − )
In order to avoid the influence of the number chosen to represent the classes on the performance assessment, it has been argued that one should only look at the order relation between “true” and “predicted” class numbers (Cardoso & Sousa, 2011). Kendall’s coefficient has been advocated as a better measure for ordinal variables because it is independent of the values used to represent classes. The coefficient can be computed as
= −
( −1) / 2
classification compared to the true values. If the relative order is reverse to the true values, the pair is called discordant. The coefficient attains its highest value, 1, when both sequences agree completely, and -1 when two sequences totally disagree.
In this paper, we divide the data into training set and testing set using a stratified random scheme. The training set contains 70% of the data and the remaining data is going to testing set. A training has been employed to grow and prune classification trees as well as build boosted classification tree. These trees have been used to predict the scores of the testing set. We use 100 different random splits into learning and testing sets and give the mean over these splits. Stratified sampling has been performed using the R package sampling (Tillé & Matei, 2013).
The global hypothesis of equality of the three classification methods is tested using Friedman’s nonparametric rank test in a randomized complete block design treating each of the 100 training & testing sets as a block (Galimberti et al., 2012). Since each classification tree method was applied to the same resamples, to identify which classifiers contributed to the observed significant difference between three classifiers, pairwise comparison were performed by applying the Wilcoxon signed rank test (Archer & Mas, 2009).
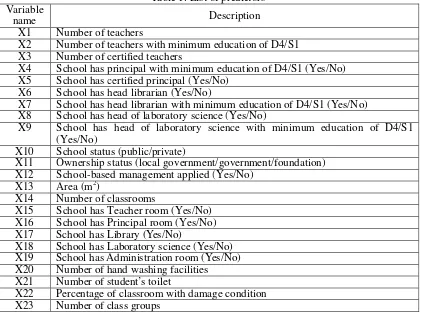
Education Database (Dapodik)
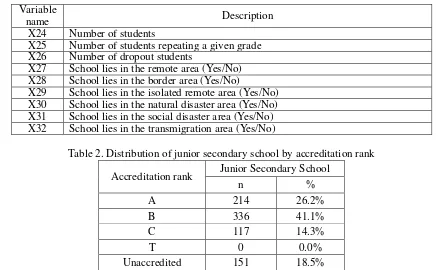
Dapodik consists of four entities: school, educational labor (teacher, principal, administration officer), student, and facilities. We could extract a lot of school characteristics of schools from this database. We generated 32 variables and use them as predictors to classify school accreditation rank. The list of those predictors is shown in Table 1. Based on BAN S/M (2014), School accreditation rank can be categorized into four classes namely A (excellent), B (good), C (satisfactory) and T (failed). From total 1283 junior secondary schools in the Province of Banten, only 818 schools have completed the database correctly. Distribution of junior secondary school based on accreditation rank can be seen in Table 2, the distribution is excluding the schools haven’t completed the database correctly. From 818 schools have completed the database correctly, 667 schools are accredited and we will use this data to build the model. The best model will be used to predict school accreditation rank of 151 unaccredited schools. As seen in Table 2, the data consists of three classes of school accreditation rank
X2 Number of teachers with minimum education of D4/S1 X3 Number of certified teachers
X4 School has principal with minimum education of D4/S1 (Yes/No) X5 School has certified principal (Yes/No)
X6 School has head librarian (Yes/No)
X7 School has head librarian with minimum education of D4/S1 (Yes/No) X8 School has head of laboratory science (Yes/No)
X9 School has head of laboratory science with minimum education of D4/S1
X15 School has Teacher room (Yes/No) X16 School has Principal room (Yes/No) X17 School has Library (Yes/No)
X18 School has Laboratory science (Yes/No) X19 School has Administration room (Yes/No) X20 Number of hand washing facilities X21 Number of student’s toilet
Variable
name Description
X24 Number of students
X25 Number of students repeating a given grade X26 Number of dropout students
X27 School lies in the remote area (Yes/No) X28 School lies in the border area (Yes/No)
X29 School lies in the isolated remote area (Yes/No) X30 School lies in the natural disaster area (Yes/No) X31 School lies in the social disaster area (Yes/No) X32 School lies in the transmigration area (Yes/No)
Table 2. Distribution of junior secondary school by accreditation rank Accreditation rank Junior Secondary School
n %
A 214 26.2%
B 336 41.1%
C 117 14.3%
T 0 0.0%
Unaccredited 151 18.5%
Total 818 100.0%
RESULT AND DISCUSSION
Figure 1 illustrate the results of boosted classification tree per number of boosting using various evaluation measures (i.e. MER, MAE, MSE, and Kendall’s ). The evaluation scores are coming from prediction of n = 202 observations in testing dataset, while the model of boosted classification tree is built from training dataset (n=465). The scores in Figure 1 are the average of 100 different random splits of learning and testing sets. The results suggest that the best performance of boosted classification tree, to predict school accreditation rank in Province of Banten, is when number of boosting is 30 cycles. This model has the lowest MER, MAE and MSE. In line with other evaluation measures, Kendall’s association concludes same result that highest Kendall’s is reached when number of boosting is 30. Later, this model will be used for comparison with the other models (i.e. classification tree and ordinal classification tree).
Figure 1. Performance of boosted classification tree by number of boosting. Prediction performance was measured using independent test dataset (n=202)
0.3500 0.3700 0.3900 0.4100 0.4300 0.4500 0.4700 0.4900 0.5100
10 30 50 70 90
Num ber of boost ing
Kendall's t
M SE
M AE
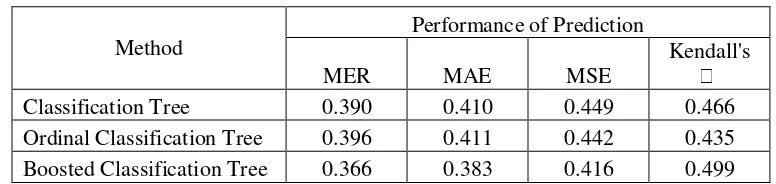
The values of each evaluation measure averaged over 100 different splits of training and testing sets are reported in Table 3 under three classification methods. The null hypothesis H0: CT = OrdinalCT = BoostedCT was tested against the alternative that at least one inequality exists using Friedman’s test. MER, MAE, MSE, and Kendall’s association were significant at the = 0.05 level. Pairwise comparison were performed by applying Wilcoxon signed rank test and all evaluation measures conclude the same results that boosted
classification tree is significant over the other two methods at = 0.05 level. Ordinal
classification tree and classification tree are not significantly different in terms of MER, MAE, and MSE. However, Kendall’s of ordinal classification tree and classification tree are
significantly different at = 0.05 level. There are evidence that boosted classification tree out-performed significantly over the other two methods. All evaluation measures lead to same conclusion that boosting method has significantly improved the predictive performance (Table 3). Boosted classification tree has the lowest MER, MAE, MSE and the highest in terms of Kendall’s association. Though all evaluation measures show same results, the Kendall’s association shows more distance than other evaluation measures.
In terms of single tree classifiers, ordinal classification tree has failed to perform better than classification tree. Ordinal classification tree just performs at par with classification tree on MER, MAE, and MSE. Ordinal classification tree performs worse than classification tree in terms of Kendall’s . From Table 3 can be seen that the difference of Kendall’s between ordinal classification tree and classification tree is quite far. Applying quadratic misclassification cost to the model seems to be not suitable for this data.
Table 3. Performance of Classification Method
Method
Performance of Prediction
MER MAE MSE
Kendall's Classification Tree 0.390 0.410 0.449 0.466 Ordinal Classification Tree 0.396 0.411 0.442 0.435 Boosted Classification Tree 0.366 0.383 0.416 0.499
Figure 2. Left figure: Boxplot of Misclassification Error Rate (MER) for each of the three classification methods calculated using test dataset. Right figure: Boxplot of Mean Absolute
Error (MAE) for each of the three classification methods calculated using test dataset.
Figure 3. Left figure: Boxplot of Mean Square Error (MSE) for each of the three classification methods calculated using test dataset. Right figure: Boxplot of Kendall’s assosiaction for each
of the three classification methods calculated using test dataset.
As the boosted classification tree has the highest predictive performance, accreditation rank of 151 unaccredited school is predicted by this method. 75 of the 151 unaccredited schools are predicted to have rank C and only 11 schools are classified as rank A. Table 4 shows distribution of junior secondary school by accreditation rank including the prediction. From Table 4 can be seen that most of the junior secondary school in Province of Banten have rank B.
Table 4. Distribution of junior secondary school by accreditation rank (including prediction of 151 unaccredited school using boosted classification tree)
Accreditation
In this research, the best model to predict school accreditation rank in Banten Province is boosted classification tree. Boosting method has significantly improved the accuracy of
prediction over the other two methods. Various evaluation measures show the same behavior that boosted classification tree has better predictive performance than single-tree classifiers, and the distinction is more pronounced for Kendall’s association.
Utilization of Dapodik to predict school accreditation rank will ease government in planning of budget and actions to improve education quality. However one thing to be improved is about the quality of data in Dapodik, many schools haven’t filled the data completely in the correct manner. The increase of Dapodik quality may help to get richer information so that the accuracy of prediction will be improved.
REFERENCES
Archer, K. J. (2010). rpartOrdinal: An R package for deriving a classification tree for predicting an ordinal response. Journal of Statistical Software, 34, 7.
Archer, K. J., & Mas,V. R. (2009). Ordinal response prediction using bootstrap aggregation, with application to a high-throughput metylation dataset. Stat Med, 28(29), 3597-3610. Alfaro, E., Gámez, M., & Garcia, N. (2013). adabag: An R package for classification with
boosting and bagging. Journal of Statistical Software, 54(2), 1-35.
Alfaro, E., Gámez, M., & Garcia, N. (2014). adabag: Applies multiclass adaboost.M1, SAMME and bagging. R package version 4.0. Retrieved from http://cran.r-project.org/package=adabag
Badan Akreditasi Nasional Sekolah/Madrasah. (2014). Perangkat akreditasi SMP/MTs. Jakarta: BAN S/M.
Breiman, L., Friedman, J. H., Olshen, R. A., & Stone, C. J. (1984). Classification and regression trees. New York: Chapman & Hall/CRC.
Breiman, L. (1998). Arcing classifier (with discussion and a rejoinder by the author). The Annals of Statistics, 26(3), 801-849.
Cardoso, J. S., & Sousa, R. (2011). Measuring the performance of ordinal classification. International Journal of Pattern Recognition and Artificial Intelligence, 25(08), 1173-1195.
Freund, Y., & Schapire, R. E. (1996). Experiments with a new boosting algorithm. ICML (Vol. 96, pp. 148-156).
Galimberti, G., Soffritti, G., & Di Maso, M. (2012). rpartScore: Classification trees for ordinal responses. R package version 1.0-1. Retrieved from http://cran.r-project.org/package=rpartScore
Hastie, T., Tibshirani, R., & Friedman, J. (2009). The elements of statistical learning (Vol. 2, No. 1). New York: Springer.
Ministry of Education and Culture. (2014). Potret penuntasan wajib belajar pendidikan dasar sembilan tahun. Jakarta: Direktorat Jenderal Pendidikan Dasar.
Ministry of National Education. (2011). Kajian analisis sistem akreditasi sekolah/madrasah dalam rangka reformasi birokrasi internal. Retrieved from http://luk.staff.ugm.ac.id/atur/rbi/AkreditasiSekolahMadrasah.pdf
Mukherjee, I., & Schapire, R. E. (2011). A theory of multiclass boosting. arXiv Preprint arXiv:1108.2989.
Therneau, T., Atkinson, B., & Ripley, B. (2015). rpart: Recursive partitioning and regression trees. R package version 4.1-9. Retrieved from http://cran.r-project.org/package=rpart Tillé, Y., & Matei, A. (2013). sampling: Survey sampling. R package version 2.6. Retrieved
from http://cran.r-project.org/package=sampling
Tutz, G., & Hechenbichler, K. (2005). Aggregating classifiers with ordinal response structure. Discussion Paper 359, SFB 386 der Ludwig-Maximilians-Universität München. Retrieved from http://epub.ub.uni-muenchen.de/1734/1/paper_359.pdf