Full Terms & Conditions of access and use can be found at
http://www.tandfonline.com/action/journalInformation?journalCode=vjeb20
Download by: [Universitas Maritim Raja Ali Haji] Date: 11 January 2016, At: 20:48
Journal of Education for Business
ISSN: 0883-2323 (Print) 1940-3356 (Online) Journal homepage: http://www.tandfonline.com/loi/vjeb20
Developing Students’ Thought Processes for
Choosing Appropriate Statistical Methods
James Murray & Elizabeth Knowles
To cite this article: James Murray & Elizabeth Knowles (2014) Developing Students’ Thought Processes for Choosing Appropriate Statistical Methods, Journal of Education for Business, 89:8, 389-395, DOI: 10.1080/08832323.2014.919896
To link to this article: http://dx.doi.org/10.1080/08832323.2014.919896
Published online: 04 Nov 2014.
Submit your article to this journal
Article views: 69
View related articles
Developing Students’ Thought Processes
for Choosing Appropriate Statistical Methods
James Murray and Elizabeth Knowles
University of Wisconsin-La Crosse, La Crosse, Wisconsin, USA
Students often struggle to select appropriate statistical tests when investigating research questions. The authors present a lesson study designed to make students’ thought processes visible while considering this choice. The authors taught their students a way to organize knowledge about statistical tests and observed its impact in the classroom and in students’ written work. The results from this intervention were mixed, but the authors discuss where they found evidence for improvement in students’ performance and thought processes. The classroom observations revealed that students have difficulty identifying variables and understanding the precise use of statistical language.
Keywords: introductory statistics, lesson study, research methods
While students are trained to implement a variety of statisti-cal tests in introductory statistics, it is still common for them to struggle in subsequent classes when they must apply this body of knowledge to select appropriate statisti-cal tests to investigate a research question. This application can challenge students because it requires an advanced organization of knowledge that considers not only the pur-pose of the test, but also the number of variables, scale of measurement, and characteristics of the samples. For the expert, this complicated cognitive process has been devel-oped and practiced over years. A student who is a novice in statistics needs to be carefully guided through the decision-making process.
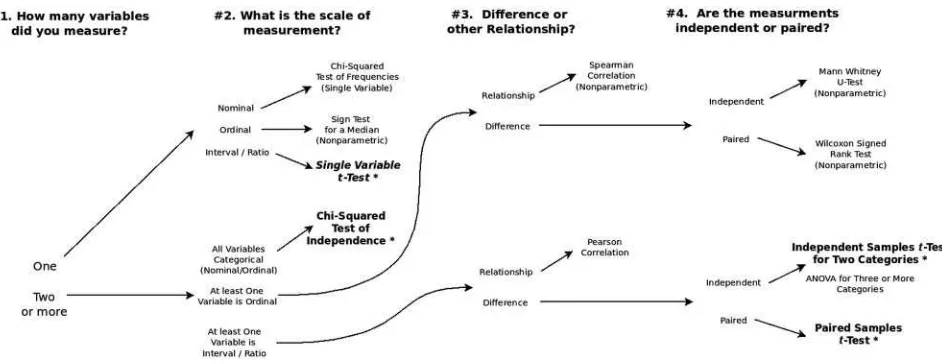
The purpose of this article is to share a teaching approach we developed to help students organize their knowledge of statistical techniques in a way that is condu-cive to choosing appropriate statistical tests. We present a decision tree that maps 11 parametric and nonparametric tests with four reflection questions that a student could ask himself or herself concerning the data and nature of the research question. We conducted a classroom investigation in Fall 2011 and Spring 2012 that revealed students’ thought processes for selecting four of these statistical tests, before and after presenting the decision tree. The areas of confusion that we identify inform instructors of the pitfalls
to address when presenting this content. We summarize our students’ performance in selecting appropriate statistical tests both before and after our treatment, and suggest teach-ing improvement strategies.
REVIEW OF LITERATURE
Knowledge organization is broadly recognized as an impor-tant consideration to improve student learning (Ausubel, 1978). Ambrose, Bridges, DiPietro, Lovett, and Norman (2010) suggested that when students begin developing knowledge organizations without guidance, the connections are often weak, superficial, and few in number, and these superficial connections can impede student learning. Statis-tics instructors can be more effective when they help stu-dents see various dimensions of and connections between statistical tests in a research settting.
There is relatively little literature on organizing knowl-edge and training students to choose statistical tests. Du Prel, Rohrig, Hommel, and Blettner (2010) examined some common statistical techniques in medical studies and pres-ent their own decision trees that are more limited than what is presented here. Their knowledge organization is confined to two criteria: scale of measurement and whether the research design is paired or not paired.
While little else in the literature addresses the specific idea of organizing knowledge about statistical tests, many papers speak more generally to the importance of developing Correspondence should be addressed to James Murray, University of
Wisconsin-La Crosse, Department of Economics, 1725 State Street, La Crosse, WI 54601, USA. E-mail: [email protected]
ISSN: 0883-2323 print / 1940-3356 online DOI: 10.1080/08832323.2014.919896
and investigating the critical thinking process involved in the selection of appropriate methods. Garfield and Chance (2000) noted that there is a growing movement in statistics courses’ learning outcomes to focus on critical thinking skills. Mvududu (2005) made the case that instructors should help students take what they already know and use it to cre-ate new knowledge. He further suggested that instructors should study how students think about the material they encounter and investigate students’ thought processes on a deeper level than through everyday communication.
The goal of this study was to explore students’ thought processes as they considered the choice of an appropriate statistical test in a research methods class, and to examine the impact of presenting students with a way to organize their knowledge of statistical tests. We used a lesson study approach, which is a teaching improvement activity in which instructors jointly develop a lesson to make student learning visible. With this approach, instructors look deeply into the teaching and learning process: the goals of a teach-ing activity, the design of the classroom instruction, under-standing the students’ reception and mental processing of the class content, and making evidence-based improve-ments in teaching (Cerbin, 2011). While it is a standard practice in Japanese elementary education, lesson study has more recently been adapted to higher education in the United States. Cerbin and Kopp (2006) had a useful discus-sion of its application in higher education.
METHOD
We recognized that when experts determine statistical approaches to a problem, they use a mental mapping which includes many dimensions, such as univariate versus multi-variate techniques, parametric versus nonparametric tests,
scale of measurement, and whether the purpose of the research is to investigate differences, comovement, or inde-pendence. We developed a decision tree that makes these considerations and connections explicit and visually por-trays the questions that students could ask as they attempt to determine an appropriate statistical test. Our goal for this decision tree was to provide a way for students to organize their knowledge of all the statistical methods that they learn in the class and that they are likely to encounter in their undergraduate business curriculum. The decision tree was organized around four considerations: (a) the number of variables involved in the research question, (b) the scale of measurement for these variables, (c) the intent of the research question (i.e., whether the purpose is to test for dif-ferences or a comovement between two variables), and (d) whether the samples are independent or paired. We tested the impact of the knowledge organization on students abil-ity to identify when to apply four of the most commonly used statistical tests. The complete decision tree is given in Figure 1 and is the key instructional intervention that is the focus of this paper.
We taught separate sections of a business research meth-ods course in Fall 2011 and Spring 2012. In Fall 2011, we conducted the investigation in three sections of the course. Elizabeth Knowles taught one of these sections and James Murray taught two. In Spring 2012, we conducted the investigation in four sections of the course. Elizabeth Knowles taught one of these sections and James Murray taught three. Based on our collaborative effort preparing for the statistics unit of the course, we each discussed the previous four considerations throughout the statistics por-tion of our courses. While we had regular discussions on our teaching approaches and used some shared examples in our lectures, we did not make an explicit attempt to make the presentation of all the material identical. Therefore, the
FIGURE 1. Decision tree. While we presented this decision tree in class, we only used the statistical tests in bold in the in-class exercises. 390 J. MURRAY AND E. KNOWLES
measures of our students’ performance that we report in the next section may include instructor-specific effects.
In both instructors’ classes and in both semesters, we jointly developed a lesson on how to organize statistical knowledge. The lesson included a brief review of statis-tical tests and an in-class exercise designed to make students’ thought processes visible. The exercise included four scenarios corresponding to four common elementary statistical tests: (A) the one-sample t-test for a mean, (B) the independent samples t-test for a differ-ence in means, (C) the paired samplest-test for a differ-ence in means, and (D) the chi-square test of independence. Each scenario presented a description of a single research question and survey questions that could be used to collect data to answer the research question. The exercise prompted students to choose a statistical test and describe what considerations led them to this decision. In the Findings section, we refer to each of the four scenarios in the exercise with these labels (A–D). The exercise is given in Appendix A.
To make students’ thought processes visible, we put them in groups of three or four to discuss the exercise aloud while they completed the task. We sat down with students to observe their discussions, and we took notes on their thought processes. We noted whether students discussed the four questions in the decision tree, whether they used any irrelevant considerations to reach their conclusion, and whether they were able to articulate their reasoning well. We observed the discussions in six groups in Fall 2011 and eight groups in Spring 2012. The classroom observation guide that we used to facilitate this notetaking is provided in Appendix B.
Subsequently, each student wrote and submitted individ-ual answers for the in-class exercise, which may have varied from their group members. We reviewed the responses and recorded the following: whether the students chose the cor-rect statistical test, whether the students’ rationale included any of the four questions emphasized in the decision tree, and whether the questions were correctly identified.
In the Fall 2011 lesson, the students completed two of the four scenarios in their in-class exercise before we pre-sented the decision tree. After presenting the decision tree, students were asked to put away their notes and they com-pleted the final two scenarios. The intention was to provide students a mental organization for statistical procedures, and compare the students’ performance and thought pro-cesses before and after this intervention. In each section, we administered the four scenarios in the in-class exercise in a different order so that every scenario appeared both before the decision tree was presented and after. This allowed us to compare the impact the decision tree had on students’ per-formance and thought processes for each of the scenarios.
While this timing for presenting the decision tree was useful for the research design, in Spring 2012 we deter-mined that it would be more pedagogically valuable to
present the decision tree at the beginning of the statistics unit of the course and continue to refer to it throughout the three week unit. This helped students organize new knowl-edge as they learned it, and it gave students practice using the decision tree before conducting the classroom observa-tion and in-class exercise. Again in Spring 2012 we ran-domized the order of the four scenarios in the in-class exercise for each section of the course.
To measure students’ retention of the knowledge organi-zation, we gave our students an unannounced quiz in the week following our classroom observation. In the quiz, we asked students to reconstruct the decision tree from mem-ory. We evaluated our students’ work and noted whether it included each of the four questions in the decision tree, and whether or not students arrived at each of the four statistical tests with any incorrect considerations.
FINDINGS
Table 1 shows the percentage of students that correctly identified the appropriate statistical test in each of the four scenarios of the in-class exercise. For Fall 2011, results are reported for before and after the decision tree was intro-duced. In Spring 2012, because the decision tree was devel-oped before the in-class exercise was administered, the percentage correct reflects all attempts. The results from Fall 2011 indicate some general improvement after the introduction of the decision tree. We expected that perfor-mance would be better in Spring 2012, but the results were mixed, depending on the statistical test.
The data suggests that the paired-samplest-test was the most difficult for students. Interestingly, none of the 22 stu-dents who were given this question before the decision tree intervention in the Fall 2011 semester answered this question correctly. The percentage correct for the chi-square test of independence actually decreased after the decision tree intervention. In Fall 2011, 86% of students answered this question correctly before the intervention, and only 58% afterward. In Spring 2012, only 39% of stu-dents correctly identified the chi-square test. The most com-mon incorrect answer for this question was a Pearson correlation coefficient, another test that examines a rela-tionship between two variables, but used for interval/ratio data rather than categorical data.
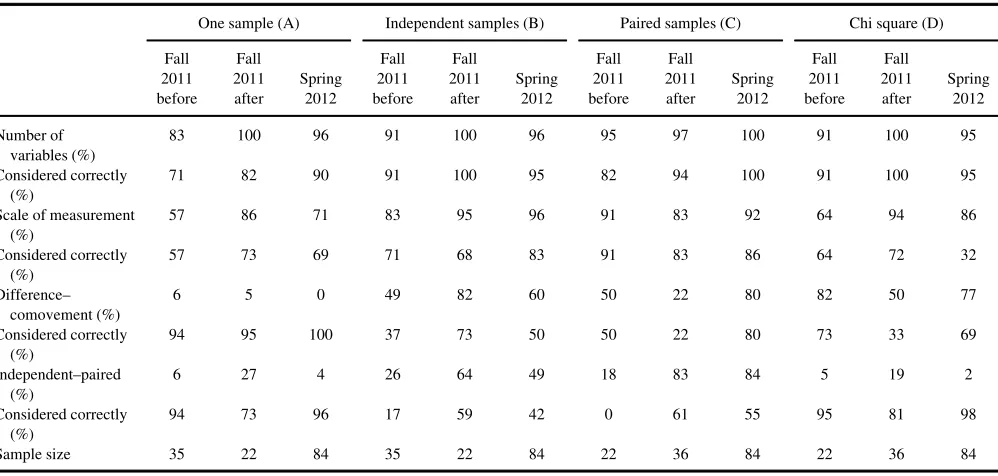
Table 2 identifies the overall percentage of students that considered, either correctly or incorrectly, each of the fol-lowing factors in their written responses: (a) number of var-iables, (b) scale of measurement, (c) the intent of the statistical test (i.e., whether the method tests for differences or a comovement between two variables), and (d) whether samples are independent or paired. The table also reports the percentage of students who considered each factor cor-rectly. For the most part, students considered the number of variables and the scale of measurement of the variables.
Considering whether or not samples were independent or paired and whether the scenario suggested examining dif-ferences or a relationship occurred less frequently. In sce-nario B (independent samples t-test), in Fall 2011 before introducing the decision tree, less than half of the students (49%) considered whether a test for a difference or a rela-tionship was appropriate, and about one fourth (26%) con-sidered whether the samples were independent or paired. Following the decision tree, the percentage of students con-sidering difference versus relationship increased to 82% and the percentage of students considering independent ver-sus paired samples increased to 64%. This is associated with an increase in overall performance on the question from 54% to 100%, as seen in Table 1. Regarding scenario C (paired samples t-test), following the intervention, stu-dents were more likely to consider independent versus paired samples but were less likely to consider whether a test involved identifying differences or a relationship. The results in Table 2 for Spring 2012 suggest that extended
use of the decision tree over the statistics unit did help stu-dents make the right considerations when choosing statisti-cal tests. In Spring 2012, the majority of students considered each factor. In most cases, the percentage of stu-dents correctly considering each factor in Spring 2012 are nearly as high, or higher than, the percentages from Fall 2011 after the decision tree was introduced.
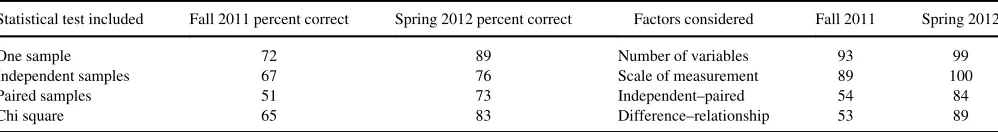
Table 3 summarizes the results of the quiz where stu-dents were asked to recreate the decision tree by memory a week following the in-class exercise. It includes the per-centage of students that correctly identified each of the four statistical tests as well as the percentage of students that considered each of the traits in the decision tree. In both semesters, almost all students included the number of varia-bles and the scale of measurement in their decision trees. In Fall 2011, only half of the students included the concepts of independent versus paired samples and whether a test was for a difference or relationship. In Spring 2012, the students had a much better recollection of the decision tree, with TABLE 1
Correct Answers by Statistical Test
One sample (A) Independent samples (B) Paired samples (C) Chi square (D)
Semester Percent correct Sample size Percent correct Sample size Percent correct Sample size Percent correct Sample size
Fall 2011: Prior to decision tree 77% 35 54% 35 0% 22 86% 22 Fall 2011: Following decision tree 82% 22 100% 22 67% 36 58% 36
Spring 2012 92% 84 56% 84 47% 84 39% 84
Note:Sample size is number of students who completed the exercise. As students discussed the problems in groups before submitting their individual responses, this does not represent a number of independent observations.
TABLE 2
Factors Considered by Scenario and Statistical Test
One sample (A) Independent samples (B) Paired samples (C) Chi square (D)
Fall
392 J. MURRAY AND E. KNOWLES
large majorities of students correctly mapping each of the four tests in the decision tree, and large majorities including all four traits in the decision tree.
For additional insight into students’ thought processes, we also observed students’ conversations while they com-pleted the exercise. We found that students often did not pause to reflect on the purpose or intent of the research question first, and sometimes never at all. Instead, many students used some form of process of elimination to come to a conclusion. Sometimes students eliminated a test because it had already been used to answer a previous exer-cise, surmising that it would not be repeated. Other times a process of elimination was used more appropriately. Stu-dents started with any test they could remember and tried to find reasons to eliminate it. Even more substantially, some students used a process of elimination by considering a fac-tor present in the decision tree and then eliminated tests on the basis of that single factor. For example, if a student identified that a problem concerned a ratio variable, the chi-square test of independence was eliminated. These approaches used at least some of the knowledge organiza-tion in the decision tree. There were times that the decision tree caused confusion, at least initially. In some cases stu-dents asked the right set of questions, but were not able to answer them correctly, and so were unable to reach the cor-rect conclusion. Finally, we noticed that students rarely fol-lowed the order of the questions as they are presented in the decision tree. The most striking thing we learned from the student conversation was that the use of language was a substantial hurdle. We were able to identify several consis-tent sources of confusion, which can grouped into three broad categories: difficulties defining a variable, confusion about the use of the wordindependent, and the colloquial use of the wordrelationship.
A fundamental source of confusion arose from identify-ing what should be considered a variable, especially when a research question involved comparing a measurement across two or more groups. For example, when students compared hours worked between students who were employed versus not employed, there were two ways to define the variables of interest. The first was a nominal– ratio pair, employment status and hours worked; the second was a ratio–ratio pair, hours worked for employed students and hours worked for not employed students. Both pairings are equivalent, but each construction is convenient in
different circumstances. When the research question involves two independent samples, as in the previous exam-ple, the nominal–ratio pairing aligns with how SPSS (ver. 20) treats the data in its spreadsheet columns. On the other hand, the ratio–ratio pairing is a convenient mental model when using statistical notation, such as when constructing the null hypothesis, H0 :m1¡m2. The ratio–ratio mental
model is also convenient for determining whether it is appro-priate to use an independent or a paired samples test. When analyzing paired samples, the ratio–ratio pairing is arguably the most convenient model because both SPSS and Excel (Microsoft, Seattle, WA) treat the data in this way in its spreadsheet columns.
A second source of confusion concerned the use of the term independence. By the end of the semester, students were exposed to at least three different uses of the word. Early in the semester when we discussed causal research, we introduced the idea of independent versus dependent variables and we returned to this idea later when discussing correlation and regression. In this case, the word indepen-dent was used to distinguish explanatory variables from outcome variables. The idea of independence arose again when discussing the chi-square test of independence for two categorical variables. In this case, the word described the relationship between two variables, and the test itself was used to determine the presence of dependence. Finally, the term was used to describe whether one should choose an independent-samplest-test or paired samplest-test. The types of research questions behind these tests do not involve ideas of comovement between the variables, and the statistical tests do not determine a presence of depen-dence like the chi-square test of independepen-dence. To the nov-ice, this use appeared to be completely different than the previous uses of the word. Too often, students got distracted by the wordindependentin independent samplest-test and confused this idea with the other concepts in the course that used the same word.
Students also struggled with the colloquial use of the termrelationship. In our classes, we described the Pearson and Spearman correlation coefficients as measuring a rela-tionship between two variables. We also used the term rela-tionship to describe the purpose of the chi-square test of independence, for example, when asking if there is a rela-tionship between employment status and class rank (both categorical variables). The termrelationshipalso appeared TABLE 3
Student Recall of Decision Trees
Statistical test included Fall 2011 percent correct Spring 2012 percent correct Factors considered Fall 2011 Spring 2012
One sample 72 89 Number of variables 93 99
Independent samples 67 76 Scale of measurement 89 100
Paired samples 51 73 Independent–paired 54 84
Chi square 65 83 Difference–relationship 53 89
colloquially, yet appropriately, for situations in which a test of differences is appropriate. For example, we might have asked if there is a relationship between gender and the num-ber of cigarettes smoked. Many students hung on to the wordrelationshipand used it as a basis for deciding that a Pearson correlation test was appropriate.
CONCLUSION
Our lesson made students’ learning and thinking processes visible, which revealed some unexpected sources of confu-sion among students. We discovered that students had prob-lems with how to define variables, and that the interaction between colloquial and statistical language created confu-sion for many students.
Faculty need to acknowledge to students the challenges that statistical language presents. Explicit examples can illus-trate the meanings of words such as relationshipand inde-pendent. The challenge is to move students beyond a narrow use of words and to consider broader meaning. We have increased our classroom emphasis on articulating and restat-ing what meanrestat-ing we want to ascertain from a statistical test. Another insight that we gained from this lesson study was the impact of the teaching strategy we employed in Spring 2012: developing the decision tree throughout the unit on statistics. Though we failed to find evidence that this led to an immediate overall improvement in student performance on the in-class exercise, we found students had a strong retention of the mental mapping. With contin-ued practice this is likely to lead to an improvement in the long-run ability to apply statistical methods. Students will also likely have an enhanced ability to learn and retain new statistical methods that they may come across in the future. The knowledge organization gives them an ability to con-nect new ideas to an existing body of knowledge.
REFERENCES
Ambrose, S. A., Bridges, M. W., DiPietro, M., Lovett, M. C., & Norman, M. K. (2010).How learning works: Seven research-based principles for smart teaching. San Francisco, CA: Jossey-Bass.
Ausubel, D. P. (1978). In defense of advance organizers: A reply to the critics.Review of Educational Research,48, 251–257.
Cerbin, B. (2011). Lesson study: Using classroom inquiry to improve teaching and learning in higher education. Sterling, VA: Stylus. Cerbin, W., & Kopp, B. (2006). Lesson study as a model for building
peda-gogical knowledge and improving teaching.International Journal of Teaching and Learning in Higher Education,18, 250–257.
Du Prel, J., Rohrig, B., Hommel, G., & Blettner, M. (2010). Choosing sta-tistical tests: Part 12 of a series on evaluation of scientific publications.
Deutsches Aerzteblatt International,107, 343–348.
Garfield, J., & Chance, B. (2000). Assessment in statistics education: Issues and challenges.Mathematical Thinking and Learning,2, 99–125. Mvududu, N. (2005). Constructivism in the statistics classroom: From
the-ory to practice.Teaching Statistics,27, 49–54.
APPENDIX A: In-Class Exercises
A researcher is interested in exploring the relationship between student unemployment and effort put forth toward academics. She administers a survey to full-time University of Wisconsin–La Crosse (UW-L) undergraduate students which includes the following questions:
1. What is your employment status? [Full time, Part time, Not employed]
2. On average, how many hours do you work per week? (Numeric / open ended)
3. On average, how many hours to you study per week? (Numeric / open ended)
4. What is your class standing? [Freshman, Sophomore, Junior, Senior]
For each of the following scenarios, answer the follow-ing questions:
1. What statistical method / test would you use to answer this question?
2. Explain your reasoning for the previous answer. What characteristics of this research question and methodology make the test you chose appropriate?
Exercise A
Suppose the national average for the number of hours full-time college students work is 12 hours per week. The researcher is interested in determining if UW-L students work on average more hours than the national average?
Exercise B
The researcher is interested in determining whether there is a difference in the average number of hours students study per week between those who are employed (either full-time or part-time) and those who are not employed.
Exercise C
The researcher is interested in determining whether on average students spend more hours studying than the num-ber of hours students spend working.
Exercise D
The researcher is interested in determining whether there is a relationship between class standing and employment status.
APPENDIX B: Classroom Observation Guide
Observe the group discussion about the statistical test which is appropriate to answer the question. Record each observation with a number to indicate the order that the stu-dents consider each element. They may circle around to an element more than once, record this as it happens (i.e. any
394 J. MURRAY AND E. KNOWLES
element may have more than one number beside it). If the conclusion about the element is incorrect, record an X by the number.
Exercise (circle): A B C D
Observation number (circle): 1 2 3 4
Element Consideration
Discuss the number of variables considered. Discuss the scale of measurement.
Discuss whether variables are independent or not. Reflect on the purpose or intent of statistical test
(determining the difference or relationship). Other
Other questions to consider:
1. Did the students take into account any irrelevant considerations?
2. Did the students reach the correct conclusion without well articulated reasons?
3. Did students reach the incorrect conclusion, yet used mostly correct and well articulated reasons?
4. How many group members were actively engaged in the conversation? (Include those who are actively listening to understand the concepts, but not those just trying to write the correct answer).