Full Terms & Conditions of access and use can be found at
http://www.tandfonline.com/action/journalInformation?journalCode=vjeb20
Download by: [Universitas Maritim Raja Ali Haji] Date: 13 January 2016, At: 00:03
Journal of Education for Business
ISSN: 0883-2323 (Print) 1940-3356 (Online) Journal homepage: http://www.tandfonline.com/loi/vjeb20
Self-Enhancing in Perceptions of Behaving
Unethically
Gregory G. Manley , Craig J. Russell & M. Ronald Buckley
To cite this article: Gregory G. Manley , Craig J. Russell & M. Ronald Buckley (2001) Self-Enhancing in Perceptions of Behaving Unethically, Journal of Education for Business, 77:1, 21-27, DOI: 10.1080/08832320109599666
To link to this article: http://dx.doi.org/10.1080/08832320109599666
Published online: 31 Mar 2010.
Submit your article to this journal
Article views: 24
View related articles
Self-Enhancing in Perceptions
of Behaving Unethically
GREGORY G. MANLEY
CRAIG J. RUSSELL
M. RONALD BUCKLEY
zyxwvutsrqponmlkjihgfedcbaZYXWVUTSRQPONMLKJIHGFEDCBA
University of
Oklahoma
Norman, Oklahoma
usiness schools stress the impor-
B
tance of organizations’ achieving a public image of ethical practices and culture. Customers want and need to believe that businesses will treat them fairly and honestly. If customers per- ceive that an organization treats them fairly, they are more likely to be satis- fied with its products and services and return for future patronage. When “quality” products turn out to be of low quality, customers feel cheated and per- ceptions of business ethics suffer (“The Best Corporate Citizens,” 1996).Employees, another constituency served by organizations, also need to feel that they are treated honestly and
ethically (Folger, 1998; Folger
zyxwvutsrqponmlkjihgfedcbaZYXWVUTSRQPONMLKJIHGFEDCBA
&Cropanzano, 1998; Skarlicki & Folger, 1997). Organizational loyalty and com- mitment may rest on perceptions of a business’s ethics and would be evi- denced in employee turnover processes such as those described in the Mobley, Griffeth, Hand, and MeGlino (1978) model of employee turnover. Converse- ly, organizations need to have workers with a strong work ethic, commitment to the job, and ethical standards that prevent them from stealing or cheating the company (Bowen, 1982; Steers & Rhodes, 1978, 1980). The same is true for other constituencies such as suppli- ers and vendors. People tend to not want to do business with those who practice
ABSTRACT. Students’ perceptions of their own and other students’ ethics were compared. Eighty-seven busi-
ness majors
zyxwvutsrqponmlkjihgfedcbaZYXWVUTSRQPONMLKJIHGFEDCBA
(43 in accounting and 44 in marketing) returned responses to aquestionnaire asking for their percep- tions of the likelihood that they and others would engage in unethical behavior, given varying probabilities of their being caught and penalized. Respondents perceived themselves as less likely to engage in unethical behavior than the average person across all scenarios. Results indicated significantly higher levels of self- enhancement bias (SEB) for market- ing majors; this difference was moder- ated by risk. As risk increased, group differences of SEB diminished. These results suggest that SEB may serve as an indicator of engagement in unethi- cal behavior.
unscrupulous business ethics (Narver &
Slater, 1990).
zyxwvutsrqponmlkjihgfedcbaZYXWVUTSRQPONMLKJIHGFEDCBA
SelfEnhancement
zyxwvutsrqponmlkjihgfedcbaZYXWVUTSRQPONMLKJIHGFEDCBA
BiasJones and Nisbett (1971) concluded that people tend to attribute their behav- ior to situational factors and attribute other people’s behavior to dispositional causes. This extension of the fundamen- tal attribution error is known as the actor-observer effect. They further sug- gested that this effect is partially due to differential salience of information available to actors and observers. Many subsequent studies have shown similar
patterns (Alicke, Klotze, Breitenbecher, Yurak, & Vredenburg, 1995; Brown, 1986; Endo, 1995; Krueger, 1998a; Sinha & Krueger, 1998).
For example, Brown (1986) found self-enhancement bias (SEB) in social judgements of self and others. Partici- pants rated a series of positive and neg- ative traits according to how well the traits described themselves and others. Positive attributes were rated as more descriptive of self, whereas negative attributes were less descriptive of self. Alicke et al. (1995) also reported that people evaluate themselves more favorably than others. They demon- strated a positive leniency bias when people compared themselves with someone whom they did not necessari- ly know, such as the “average student” (labeled a “nonindividuated target”). Alicke et al. labeled this the better than
average effect. Similarly, Endo’s
(1 995) findings indicated SEB when individuals compared themselves with most other people, but not when they compared themselves with specific, referent others.
Interestingly, Krueger (19984 also showed an enhancement bias in descrip- tions of self and others. Krueger demon- strated that most people exhibit SEB and expect others to self-enhance also, but will refrain from self-enhancing when instructed to estimate social
September/October 2001 21
norms. These results suggest that self- enhancement is a bias individuals can “access” or consciously influence, at least to some degree.
Finally, Sinha and Krueger (1998) developed an idiographic index of self- evaluation bias and compared it with two difference-score measures of self- enhancement. Difference-score indices of self-enhancement measured the degree to which people rated (a) them- selves more or less favorably than oth- ers and (b) themselves more or less favorably than they were rated by oth- ers. These difference score measures were defined as reflecting a common rater paradigm (CRP) and common tar- get paradigm (CTP), respectively. The idiographic index was the correlation between the respondents’ ratings of how well certain traits described them and their ratings of how desirable the traits are. Unlike the CRP and CTP indices, the idiographic bias index does not con- found distorted evaluation of others with distorted evaluation of self. Hence, an advantage of this index is that it does not depend on ratings of others or rat- ings by others.
Although most people assume that others agree with them on most issues (the false consensus effect), McFarland
and Miller
zyxwvutsrqponmlkjihgfedcbaZYXWVUTSRQPONMLKJIHGFEDCBA
(1 990) identified specificissues on which people inaccurately felt that they held a minority position. The false uniqueness effect is defined as sys- tematic under estimation of “self-other” similarity. There are times when a deviant perception from the norm implies superiority. Hence, false uniqueness effects are understandable in these situations in which self-esteem is preserved or enhanced.
Goethals (1986) conducted a series of studies demonstrating this point. In one study, students indicated whether they would be willing to donate blood. Then they were asked to esti- mate the percentage of other students who would volunteer to donate. Those who volunteered to donate comprised the majority; however, they predicted that only a minority of others would donate. Goethals sug- gested that volunteer students’ per- ceptions were motivated by a desire to enhance their self-esteem. SEB likely plays a role in many instances
of false uniqueness (Miller & McFar-
land, 1991).
zyxwvutsrqponmlkjihgfedcbaZYXWVUTSRQPONMLKJIHGFEDCBA
School and Business Ethics
Interestingly, the “ethical” choice may or may not coincide with self- enhancement. Research supporting SEB effects suggests that SEB can occur in situations involving ethics perceptions. For example, Goethals’s ( 1986) study may have involved perceptions of ethics because donating blood is the “right” or “ethical” thing to do.
Alternatively, in explaining percep- tions of unethical behavior based on attribution theory, Buckley, Harvey, and Wiese (1997) argued that people might be influenced to engage in cheating behavior because they believe that everyone else does it. Individuals who believe that they are ethical and that unethical behavior is common conclude that everyone else is unethical. (Thus, those individuals demonstrate SEB by enhancing their perceptions of their own ethical standards relative to oth- ers’.) This perception of widespread unethical behavior may lead people to engage in unethical behavior in order to “compete” on even ground even though they know that their actions are morally wrong.
There may, however, be some limits to the tendency to engage in this type of unethical behavior. These limits may be associated with the level of risk of being caught. Buckley, Wiese, and Harvey (1998) examined influences on unethi- cal behavior in school and business set- tings. They found that the probability of being caught and penalized effectively predicted the likelihood of engaging in unethical behavior. The findings were in the expected direction: The higher the chances of being caught, the lower the indication of engaging in the unethical behavior. Results suggested that male students who scored high i n hostility and aggression reported a higher propensity to engage in unethical behavior. These findings converge with the previous literature and permit the following assumption:
Assumption 1: Perceptions of self and others’ unethical behavior will exhibit self-enhancement bias (SEB).
People will tend to be positively biased in their self-perceptions.
Self Enhancement Bias Operationally Defined
SEB has been defined as the tenden- cy to describe oneself more positively than the social norm. Krueger (1998a) specifically described SEB as an ego- centric pattern of discrepancies between self-ratings and relevant social norms. For the present study, however, we oper- ationally defined SEB as it pertains to unethical behavior as a positive differ- ence between the perceived probability of the self’s and average “other” peo- ple’s engagement in unethical behavior, in the same situation. In other words, SEB is the degree to which a given indi- vidual perceives him- or herself as more ethical than the average person in the same situation. The “situation” charac- teristic of most interest in ethical deci- sion contexts is the perceived risk level of being caught and penalized.
Krueger ( 1998a) demonstrated that SEB could be influenced by decision context. In the present study, we extend Kruger’s research to ethical decision contexts by posing the following ques- tion: Does the amount of SEB vary by level of probability of being caught and penalized? The three-part rationale behind this question was as follows: (a) The likelihood of engaging in unethical behavior decreases as likelihood of being caught and punished increases, (b) the likelihood of engaging in uneth- ical behavior is positively related to SEB, and (c) SEB is negatively related to likelihood of being caught and pun- ished.
Hypothesis 1: SEB decreases as probability of being caught and penal- ized increases.
Extending Buckley et al.’s (1 998) findings involving hostility and aggres- sion, in this study we also examined select individual difference characteris- tics. Personality variables have recently re-entered the arena of viable, criterion- valid selection systems (Barrick & Mount, 1991). Further, self-selection and socialization into college majors may play a role in subsequent levels of
SEB observed in ethical decisions.
zyxwvutsrqponmlkjihgfedcbaZYXWVUTSRQPONMLKJIHGFEDCBA
22 Journal of Education for Business
Personality and Self-Selection
zyxwvutsrqponmlkjihgfedcbaZYXWVUTSRQPONMLKJIHGFEDCBA
Personality differences in narcissism may play a role in the likelihood of exhibiting SEB. In a study of accuracy and bias in self-perception, John and Robbins (1 994) used a common target paradigm (CTP) comparing self-evalua- tions with peer evaluations. They found narcissism (excessive admiration of oneself) strongly associated with indi- vidual differences in SEB. Similarly,
Gosling, John, Craik, and Robbins
zyxwvutsrqponmlkjihgfedcbaZYXWVUTSRQPONMLKJIHGFEDCBA
( 1998) compared self-reported acts with observer codings in a study examining behavioral self-awareness. They found SEB in self-reports to be particularly prevalent for narcissistic individuals.
Individual differences in personality may also be relevant i n predicting integrity. For example, Ones, Viswes- varan, and Schmidt (1996) reported substantial correlation between integrity tests and the three dimensions of con- scientiousness, agreeableness, and emo- tional stability. Results also indicated that each of these dimensions indepen- dently contribute to predictability of integrity test scores.
Personality may influence choice of career as well (Eberhardt & Muchinsky,
1984). Students in the present study had self-selected into a business major, pre- sumably on the basis of their personal motivation to do so.
Assumption 2: Self-selection occurs with choice of business major.
In our study, we considered whether individuals’ selection of major depends on their ethical frameworks and atti- tudes. Machiavellianism has been described as the use of cunning, dishon- est methods of deceit to achieve a desired outcome (i.e., power or control). In a study examining Machiavellianism among various college majors, McLean and Jones (1992) found that business students in general (compared with non- business majors) and marketing stu- dents specifically (compared with other business majors) scored higher in Machiavellianism. Unethical behavior can be considered similar to Machiavel- lianism, because both behaviors involve the use of deceit and other dubious means for attainment of ends. Other terms relating to Machiavellianism are
immorality, despotism, treachery, and craftiness. Thus, SEB, as it pertains to unethical behavior, may also vary according to college business major (e.g., in marketing versus accounting majors).
Hypothesis 2: Average SEB is greater for marketing majors than for account- ing majors.
Risk and Accountability: A Model of Social Contingency
In the present study, we considered whether likelihood of being caught and penalized covaries with levels of accountability. We expected the risk of being caught and penalized to increase as the chance of individuals’ being held responsible for their actions increased. The social contingency model of accountability may explain the relation- ship between SEB in unethical behavior and the risk of being caught and penal- ized. The model is based on the assumption that accountability on the part of the observer can reduce judg- mental bias (Tetlock & Lerner, 1999). Tetlock and Boettger (1989) demon- strated this principle by manipulating levels of accountability among partici- pants who were making predictions from either diagnostic information alone or diagnostic information along with additional data. Findings showed that subjects who were accountable for their judgements were motivated to use a wide range of information in making their predictions.
Additionally, Tetlock (1985) tested whether accountability reduces or elim- inates fundamental attribution error. He manipulated accountability by pressur- ing participants to justify to others their personal causal interpretations of a tar- get’s behavior. Findings suggested that accountability eliminated fundamental attribution error by affecting how partic- ipants initially encoded and analyzed stimulus information. Thus, if account- ability increases with risk of being caught and penalized, attribution error and SEB may decrease.
A key difference between accounting and marketing majors may lie in the lev- els of “accountability” inherent in those areas. The accounting field has certain
industry standards that maintain accountability (e.g., the Generally Accepted Accounting Principles), but no such standards exist in the marketing field. However, SEB differences between marketing and accounting majors will likely depend on the proba- bility of being caught and penalized. We predicted that the difference in SEB between majors would diminish as the likelihood of being caught approached 100%. We expected that students would be more likely to view themselves as more similar to the average person in ethical behavior as their risk of being caught increased, regardless of major.
Hypothesis 3: SEB differences be- tween accounting and marketing majors are moderated by levels of probability
of being caught and penalized.
zyxwvutsrqponmlkjihgfedcbaZYXWVUTSRQPONMLKJIHGFEDCBA
Method
Participants
We solicited respondents from a large, undergraduate business class at a large midwestern U.S. university. We collected data over three separate semesters to increase sample size and control for history effects. Students par- ticipated in our investigation during reg- ular class hours and received extra cred- it. We distributed a 90-item question- naire, and administrators emphasized anonymity to encourage accurate responses. A total of 382 questionnaires were returned, though 15 were unusable because of missing data. Of 367 usable responses, 87 were either from account- ing or marketing majors and made up the sample analyzed here. Forty-nine percent (43) were accounting majors, and 50% (44) were marketing majors; 65.5% were women (57 females and 30 males), and 5.75% (5) were internation- al students.
Procedure
Measures. We asked participants to complete a questionnaire asking respon- dents for their perceptions of the likeli- hood of their own and others’ engage- ment in unethical behaviors, given varying degrees of being caught and penalized. Using brief vignettes, we
September/October 2001
zyxwvutsrqponmlkjihgfedcbaZYXWVUTSRQPONMLKJIHGFEDCBA
23
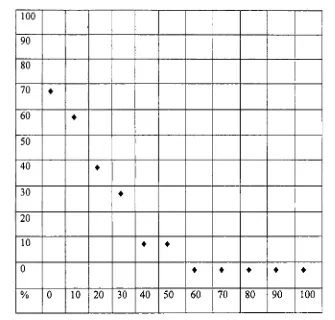
FIGURE 1. A Typical Response Option Matrix for Each Vignette in the
Questionnaire
zyxwvutsrqponmlkjihgfedcbaZYXWVUTSRQPONMLKJIHGFEDCBA
Note.
zyxwvutsrqponmlkjihgfedcbaZYXWVUTSRQPONMLKJIHGFEDCBA
For each level ofzyxwvutsrqponmlkjihgfedcbaZYXWVUTSRQPONMLKJIHGFEDCBA
~~~ ~~~~~ ~robability of being caught and penalized, respondents indicated the per- ceived probability of engaging in unethical behavior.
asked respondents to imagine them- selves and the “average person” in a sit- uation involving the possibility of unethical behavior (such as cheating on a test at school). Within each vignette, the likelihood of being caught and pun- ished was manipulated from 0% to 100% (in 10% increments). Respon- dents indicated the perceived likelihood (from 0%-100% in 10% increments) that they or others would engage in the unethical behavior. In Figure 1, we pro- vide an example of a single vignette’s response option matrix. Subsequent questions asked for respondents’ per-
ceptions
zyxwvutsrqponmlkjihgfedcbaZYXWVUTSRQPONMLKJIHGFEDCBA
of self and others. For exam-ple, the following is an example of a question targeting individual respon- dents’ self-perceptions:
1. If the chance of being caught and penalized is -, the probability that YOU would engage in unethical behav- ior (cheat) in school would be
-.
2. If the chance of being caught and
penalized is -, the probability that DENT would engage in unethical behav- ior (cheat) in school would be -,
3. If the chance of being caught and penalized is -, the probability that YOU would engage in unethical behav- ior (cheat) in business would be
-.
4. If the chance of being caught and penalized is -, the probability that THE AVERAGE BUSINESSPERSON would engage in unethical behavior (cheat) in business would be
-.
We varied vignette characteristics systematically to maximize generaliz- ability of results. Characteristics included setting (school vs. business), amount of gain (low vs. high) to be achieved through cheating, and the gain’s scope (personal, organizational, or societal).
THE AVERAGE UNIVERSITY STU-
zyxwvutsrqponmlkjihgfedcbaZYXWVUTSRQPONMLKJIHGFEDCBA
Design. We used a common rater para- digm (CRP) approach to measure SEB
TABLE 1. Mean Self-Enhance- ment Bias (SEB) as a Function of Probability of Being Caught
and Penalized ( N
zyxwvutsrqponmlkjihgfedcbaZYXWVUTSRQPONMLKJIHGFEDCBA
= 87)Probability of being SEB
caughupenalized
zyxwvutsrqponmlkjihgfedcbaZYXWVUTSRQPONMLKJIHGFEDCBA
(96)zyxwvutsrqponmlkjihgfedcbaZYXWVUTSRQPONMLKJIHGFEDCBA
M SD0 10
20
30
40 50 60 70 80 90 100
27.36 21.84 29.92 20.09 27.59 19.26 24.29 18.50
19.72 16.37 15.66 14.47 12.48 12.21 9.72 10.34 7.01 7.89 4.39 5.75 2.24 4.21
(Sinha & Krueger, 1998). In the CRP approach, we used the difference between self and “other” (average per- son) ratings for each level of probability of being caught and punished to mea- sure SEB. We then aggregated SEB rat- ings across the various scenarios (e.g., high personal gain or low personal gain) for an overall measure of SEB. This aggregation of the vignette characteris- tics was necessary because of the rela- tively small sample size, which prevent-
ed an examination of these
between-factors effects. However, the variation in vignette characteristics enhanced external validity and general- izability of the results. Thus, the study was a repeated measures design with 11 levels of the within factor (chance of being caught and penalized) and two levels of the between factor (type of self-reported business major).
Analyses and Results
In Table 1, we report mean SEBs and standard deviations for the 11 levels of probability of being caught and penal- ized. With the exception of mean SEB at 0%, the means demonstrate a monotonic decreasing trend. Mean SEB increased between 0% and 10% chances of being caught and then proceeded downward as chance of being caught and penalized increased. SEB means and standard deviations for accounting and marketing majors were M = 13.44, SD = 13.32, and
M = 19.35, SD = 14.12, respectively.
24 Journal of Education f o r Business
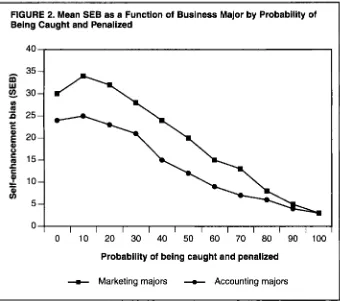
[image:5.612.48.383.67.387.2]FIGURE 2. Mean SEB as a Function of Business Major by Probability of
Being Caught and Penalized
zyxwvutsrqponmlkjihgfedcbaZYXWVUTSRQPONMLKJIHGFEDCBA
35
-
zyxwvutsrqponmlkjihgfedcbaZYXWVUTSRQPONMLKJIHGFEDCBA
zyxwvutsrqponmlkjihgfedcbaZYXWVUTSRQPONMLKJIHGFEDCBA
8
30-zyxwvutsrqponmlkjihgfedcbaZYXWVUTSRQPONMLKJIHGFEDCBA
E
25-6
u) m
4-
C
0 0
r E
=
;
20-5
15-10-
5-
$
.-
I
- 1 I I I I I I I I I I
0 10 20 30 40 50 60 70 80 90 100
Probability of being caught and penalized
-m-
zyxwvutsrqponmlkjihgfedcbaZYXWVUTSRQPONMLKJIHGFEDCBA
Marketing majors+
Accounting majorsA repeated measures analysis of vari- ance (ANOVA) for the within-subject effect across the 11 levels of probability of being caught and penalized yielded a significant main effect, F(10, 850) =
108.35, p
zyxwvutsrqponmlkjihgfedcbaZYXWVUTSRQPONMLKJIHGFEDCBA
< .0001,zyxwvutsrqponmlkjihgfedcbaZYXWVUTSRQPONMLKJIHGFEDCBA
MSE = 79.85. Thiseffect size was estimated at
o2
= .925, a large effect. This supports Hypothesis 1:SEB decreases as probability of being caught and penalized increases. Because of possible floor effects driving this main effect, we conducted a follow- up analysis using the Friedman test, a nonparametric two-way ANOVA by ranks (Conover, 1971), which also yielded a significant result T( 10) =23.9,
p < .O 1. Therefore, we can conclude that there was a tendency for SEB to change as risk levels shifted.
In addition, a repeated measures ANOVA yielded a significant between- subjects main effect in a comparison of means for accounting and marketing majors, F( 1, 85) = 5.08, p = .027, MSE =
1648.435. This effect was estimated at
o2 = .045, a small effect size according to Cohen’s (1 977) criteria of fixed effect sizes. Because of the directional nature of Hypothesis 2 and the fact that the effect was in the predicted direction, we conducted a one-tailed test of mean dif- ferences, t(85) = 2.254, p = .0135. This
supports Hypothesis 2: SEB is greater for marketing majors than for account- ing majors.
Finally, we observed a significant interaction effect between type of busi- ness major and levels of probability of being caught and punished, F( 10,850) = 2.55, p = .005, MSE = 79.85. The inter- action effect size was estimated at
o2
= .15. This supports Hypothesis 3: SEB differences between accounting and marketing majors are moderated by lev- els of probability of being caught and penalized. In Figure 2, we illustrate thisinteraction:
zyxwvutsrqponmlkjihgfedcbaZYXWVUTSRQPONMLKJIHGFEDCBA
As level of risk increased,SEB diminished at different rates for each major.
Discussion
Results suggested a generally decreasing monotonic trend of mean SEB as levels of perceived risk increased. Students exhibited less enhanced perceptions of their own ethi- cal behavior as the chance of being caught and punished increased. This finding supports Hypothesis 1. The same decreasing monotonic trend exist- ed for the standard deviations, although this was likely due to a simple floor effect (see Table I). Buckley et al.
(1998) reported that the probability of being caught and penalized predicted the likelihood of engaging in unethical behavior. This effect was replicated in our SEB results reported earlier: The higher the chances of being caught and penalized, the lower the amount of reported SEB. If we consider the restric- tion in range of perceived probability of engaging in unethical behavior as risk levels increase, this similarity is under- standable. The limited range of proba- bilities of engaging in unethical behav- ior exhibited as chance of being caught and penalized approached 100% effec- tively restricted the range of possible SEB (a floor effect). However, follow- up analysis of this main effect through the Friedman test, a nonparametric two- way ANOVA by ranks (Conover, 1971), yielded a significant result (p < .01). We can conclude that there was a tendency for SEB to differ according to risk lev- els. Thus, the decrease in SEB as risk increased could result from the stu- dents’ feeling that they would behave more like average people when their chances of getting caught and punished neared 100%.
In Figure 2, we illustrate the single exception to this trend. SEB was small- er for both groups at the 0% chance of being caught and punished, jumped upward at thelo% chance, and then pro- ceeded downward as the chance of being caught and penalized increased. When there was no perceived risk, stu- dents seemed to believe that they might engage in unethical behavior as fre- quently as the average person might, that is, they exhibited less SEB. Howev- er, the slightest chance of being caught and penalized caused students to indi- cate that they would not engage in unethical behavior as frequently as most people would. Thus, SEB appeared to be greatest at the smallest nonzero prob- ability of being caught and penalized (10%). This is a novel finding relative to past research and suggests that people may have less biased, more realistic self-perceptions under relatively extreme situational circumstances (i.e., zero probability of being caught and punished). Alternatively, the results hold interesting possible implications for individuals who nonetheless exhibit SEB when there is zero probability of
SeptembedOctober 2001 25
being caught-if most individuals exhibit less SEB under such conditions, those who continue to exhibit SEB may be especially deceitful (to themselves or others). Future researchers should examine whether SEB exhibited under such conditions is predictive of organi- zational outcomes of interest (e.g., crim- inal, citizenship, and other direct and indirect measures of ethical behaviors).
Personality variables may account for choice of career path or self-selection into college major (Assumption 3). In addition, personality variables such as narcissism, conscientiousness, agree- ableness, and neuroticism have been correlated with either scores on integri- ty tests or SEB (Gosling et al., 1998;
John
zyxwvutsrqponmlkjihgfedcbaZYXWVUTSRQPONMLKJIHGFEDCBA
& Robbins, 1994; Ones et al.,1996). Similarly, McLean and Jones (1992) reported that marketing students scored higher in Machiavellianism than other business students did. In the pre- sent study we posit that individual dif- ferences in personality contribute to self-selection into college business majors; therefore, group (i.e., account- ing vs. marketing majors) differences in personality may predict SEB differ- ences. The signiticant difference shown in SEB between accounting and busi-
ness majors supported Hypothesis
zyxwvutsrqponmlkjihgfedcbaZYXWVUTSRQPONMLKJIHGFEDCBA
2 .The SEB difference between academic majors has a number of interesting implications. In comparing accounting and marketing majors, one should not paint one group in a particularly bad ethical light. Rather, such a comparison demonstrates that there are fundamental differences in SEB depending on self- selected initial career path. Individuals pursuing marketing majors may be more motivated to enhance product sales, whereas those in accounting are subject to legal fiduciary responsibilities in ensuring the accuracy of standard finan- cial documents. Alternatively, SEB dif- ferences may reflect differences in career “climate” or environment, independent of incumbent individual differences.
In addition to a significant difference in SEB between marketing and account- ing majors, we found a significant inter- action effect between academic major and likelihood of being caught and penalized. In Figure 2, we illustrated this moderator effect: Group SEB dif- ferences diminished as risk levels
increased, supporting Hypothesis 3. The social contingency model of account- ability holds that accountability on the part of the observer reduces judgment biases such as SEB (Tetlock & Boettger, 1989; Tetlock & Lerner, 1999). Further, past researchers have found that increased levels of accountability elimi- nated occurrence of fundamental attri- bution error (Tetlock, 1985), a hallmark of SEB. It was assumed that attenuation of overattribution due to increased accountability is common across both types of majors. Nonetheless, findings confirmed the study’s three hypotheses: (a) SEB exhibited in ethical decision contexts decreases as probability of being caught and penalized increases, (b) differences in average amount of SEB exist between accounting and mar- keting majors, and (c) SEB differences between majors diminish as the chances
of being caught and punished increase.
zyxwvutsrqponmlkjihgfedcbaZYXWVUTSRQPONMLKJIHGFEDCBA
Implications for Future Research and Practice
Can SEB serve as an indicator of integrity? Terris and Jones (1982) reported that typical employee thieves attributed more theft to others, indicat- ing an overattribution i n unethical behavior. Increased SEB exhibited by students may predict propensity to engage in unethical behavior, especially under extreme conditions such as when there is zero likelihood of being caught. In future research, measures of SEB (as it pertains to ethical behavior) should be examined as possible predictors of theft and other aberrant organizational behavior.
Individual differences in SEB as it pertains to unethical behavior also might be useful in predicting outcomes of interest. Counterproductive behaviors associated with organizational delin- quency (i.e., insubordination, absen- teeism, bogus worker compensation claims, etc.) constitute costly unethical behaviors (Cascio, 2000). Hosmer (1996) argued that increasing global competition and advancing technologi- cal complexity is causing companies to be more dependent and trusting of workers, managers, stakeholders, and other business associates. Ethics of managers particularly may influence
subordinates’ behaviors, trust, and com- mitment (and vice versa). Using a CTP, Morgan (1 993) measured self-others’ ratings of managerial ethics and found managers’ self-ratings to be more favor- able. He also found that coworker per- ceptions of ethics were related to per- ceptions of leadership. A reliable predictor of ethical behavior would be useful in making personnel selection decisions in such an environment.
Finally, ethical SEB measures may be useful in diagnosing when worker empowerment practices should or should not be used. Pfeffer, Cialdini, Hanna, and Knopoff (1998) found evi- dence of SEB in tendencies of managers to evaluate work products more highly when they were more personally involved in its production. Evidence of high SEB may conceivably lead to a reluctance to empower otherwise com- petent workers.
In sum, use of SEB measures as an indirect assessment of personal integrity holds promise for personnel selection, given possible relationships of SEB (as it pertains to unethical behavior) with organizational outcomes. Future criteri- on validity research incorporating SEB measures in assessment of overt integri- ty tests should confirm whether SEB in ethics predicts propensity to engage in unethical behavior.
REFERENCES
Alicke, M. D., Klotze, M. L., Breitenbecher, D.
L., Yurak,
zyxwvutsrqponmlkjihgfedcbaZYXWVUTSRQPONMLKJIHGFEDCBA
T. J., & Vredenburg, D. ( I 995). Per- sonal contact, individuation, and the better-than-average-effect. Journal
zyxwvutsrqponmlkjihgfedcbaZYXWVUTSRQPONMLKJIHGFEDCBA
of Personality andBarrick, M. R., & Mount, M. K. (1991). The big five personality dimensions and job perfor- mance: A meta-analysis. Personnel Psychology, The best corporate citizens: Is your company on our list of the nation’s 100 most profitable, pub- lic, and socially responsible companies?
( 1996). Business Ethics Magazine, May/June, 10-12.
Bowen, D. E. (1982). Some unintended conse- quences of intention to quit. Academy of Man- agement Review, 7(2), 205-21 I ,
Brown, J. D. (1986). Evaluation
zyxwvutsrqponmlkjihgfedcbaZYXWVUTSRQPONMLKJIHGFEDCBA
of self and others:Self-enhancement biases in social judgements.
Social Cognition. 4 . 353-316.
Buckley, M. R.. Harvey, M., & Wiese, D. S.
(1997). Are people really
zyxwvutsrqponmlkjihgfedcbaZYXWVUTSRQPONMLKJIHGFEDCBA
u s unethicul us we think? A reinterpretation and some researchpropositions. Unpublished manuscript, Univer- sity of Oklahoma, Norman.
Buckley, M. R., Wiese, D. S., & Harvey, M. G . (1998). An investigation into the dimensions of
unethical behavior. Journal of Education
zyxwvutsrqponmlkjihgfedcbaZYXWVUTSRQPONMLKJIHGFEDCBA
forBusiness, 73, 284-290. Social Psychology, 69, 213-226.
41, 1-26.
26 Journal of Education ,for Business
Cascio, W. F. (2000).
zyxwvutsrqponmlkjihgfedcbaZYXWVUTSRQPONMLKJIHGFEDCBA
Costing human resources: The jinuncial impact of behavior in organiza-tions. Boston: Kent Publishing.
Cohen, J. (1977). Statistical power analysis for the behavioral sciences. New York: Academic Press.
Conover, W. J.
zyxwvutsrqponmlkjihgfedcbaZYXWVUTSRQPONMLKJIHGFEDCBA
(1 97 I). Practical nonparametric statistics. New York: Wiley.Eberhardt, B. J., & Muchinsky, P. M. (1984). Structural vlaidation of Holland’s hexagonal model: Vocational classification through use of
biodata. Journal of Applied Psychology.
zyxwvutsrqponmlkjihgfedcbaZYXWVUTSRQPONMLKJIHGFEDCBA
69,174-1 8 1.
Endo. Y. ( 1995). A false modesty/other-enhancing bias among Japanese. Psychofogia: An Inrerna-
tional Journal
zyxwvutsrqponmlkjihgfedcbaZYXWVUTSRQPONMLKJIHGFEDCBA
flf Psychology in the Orient, 38,59-69.
Folger. R. ( 1998). Fairness
zyxwvutsrqponmlkjihgfedcbaZYXWVUTSRQPONMLKJIHGFEDCBA
as a moral virtue. In M. Schminke (Ed.), Managerial ethics: Moral-1y managing people and processes (pp. 13-34). Mahwah, NJ: Erlbaum.
Folger, R., & Cropanzano, R. (1998). Orguniza- tionul justice and human resource management.
Thousand Oaks, CA: Sage.
Goethals, G. R. (1986). Fabricating and ignoring social reality: Self-serving estimates of consen- sus. In J. Olson, C. P. Herman, & M. P. Zanna (Eds.), Relative deprivation and social compar- ison: The Ontario Symposium on Social Cogni- tion (Vol. 4, pp. 137-157). Hillsdale, NJ: Erlbaum. Gosling, S. D., John, 0. P., Craik, K. H., & Rob- bins, R. W. (1998). Do people know how they behave? Self-reported act frequencies com- pared with on-line codings by observers. Jour- nal of Personality and Social Psychology, 74.
Hosmer, L. T. (1996). Research notes and com- munications: Response to “Do good ethics always make for good business?’ Strategic Management Journal, 17, 501.
133771349,
John, 0. P., & Robbins, R. W. (1994). Accuracy and bias in self perception: Individual differ- ences in self-enhancement and the role of nar- cissism. Journal of Personality and Social Psy- chology, 66, 206-219.
Jones, E. E., & Nisbett. R. E. (1971). The actor and the observer: Divergent perceptions of the causes of behavior: Morristown, NJ: General Learning Press.
Krueger, J. (199th). Enhancement bias i n descrip- tions of self and others. Personality and Social Psychology Bulletin, 24, 505-5 16.
McFarland, C., & Miller, D. T. (1990). Judge- ments of self-other similarity: Just like other people, only more so. Personality and Social Psychology Bulletin, 6, 475484.
McLean, P. A.. & Jones, D. B. (1992). Machiavel- lianism and business education. Psychological Reports, 71( lo), 57-58.
Miller, D. T., & McFarland, C. (1991). When social comparison goes awry: The case of pluralistic ignorance. Social comparison: Contemporary theory und research (pp. Mobley, W. H., Griffeth, R. W., Hand, H. H., &
Meglino, B. M. (1978). Review and conceptual analysis of the employee turnover process. Psy- chological Bulletin, 86. 493-522.
Morgan, R. B. (1993). Self- and co-worker per- ceptions of ethics and their relationships to
leadership and salary. Academy of Management Journal, 36, 200-2 14.
Narver, J., & Slater, S. (1990). The effect of mar- keting orientation on business profitability.
Journal ojMarketing, 54,
zyxwvutsrqponmlkjihgfedcbaZYXWVUTSRQPONMLKJIHGFEDCBA
1-1 8.Ones, D. S., Viswesvaran, C., & Schmidt, F. L.
( 1 996). Group differences in overt integrity tests and related personality variables: Impli- cations f o r adverse impact and test construc- tion. Paper presented at the conference of Soci- 287-313).
ety for Industrial and Organizational Psycholo-
gy, San Diego, CA.
Pfeffer, J.. Cialdini, R. B., Hanna, B., & Knopoff.
K. (1998). Faith in supervision and the self- enhancement bias: Two psychological reasons why managers don’t empower workers. Basic
and Applied Social Psychology, 20, 3 13-32
zyxwvutsrqponmlkjihgfedcbaZYXWVUTSRQPONMLKJIHGFEDCBA
1.Rhodes, S. R.,
zyxwvutsrqponmlkjihgfedcbaZYXWVUTSRQPONMLKJIHGFEDCBA
& Skarlicki, D. P. (1981). Conven- tional vs. worker-owned organizations. HumanRelations, 34, 1013-1035.
Sinha, R. R., & Krueger, J. (1998). Idiographic self-evaluation and bias. Journal of Research in Personality. 32, 131-155.
Skarlicki, D. P., & Folger, R. (1997). Retaliation for perceived unfair treatment: Examining the roles of procedural and interactional justice.
Journal of Applied Psychology, 82, 434443. Steers, R. M., & Rhodes, S. R. (1978). Major
Influences on employee attendance: A process model. Journal of Applied Psychology, 63.
39 1 4 0 7 .
Steers, R. M., & Rhodes, S. R. (1980). A new look at absenteeism. Per.sonnel, 57(6), 60-65. Terris, W., & Jones, J. (1982). Psychological fac-
tors related to employees’ theft in the conve- nience store industry. Psvchologicaf Reports.
51, 1219-1238.
Tetlock, P. E. (1985). Accountability: A social check on the fundamental attribution error.
Social Psychology Quarterly, 48(3), 227-236. Tetlock. P. E., & Boettger, R. (1989). Account-
ability: A social magnifier of the dilution effect.
Journal of Personality & Socinl Psychology,
Tetlock, F? E., & Lemer, J. S. (1999). The social contingency model: Identifying empirical and normative boundary conditions on the error- and-bias portrait of human nature. In Dual- process theories in social psychology (pp. 571-585). New York: Guilford Press. 57(3), 388-398.