Full Terms & Conditions of access and use can be found at
http://www.tandfonline.com/action/journalInformation?journalCode=vjeb20
Journal of Education for Business
ISSN: 0883-2323 (Print) 1940-3356 (Online) Journal homepage: http://www.tandfonline.com/loi/vjeb20
Student Perceptions of the Acceptance of
Communication Diverseness
Barbara D. Davis
To cite this article: Barbara D. Davis (2006) Student Perceptions of the Acceptance of Communication Diverseness, Journal of Education for Business, 82:2, 67-73, DOI: 10.3200/ JOEB.82.2.67-73
To link to this article: http://dx.doi.org/10.3200/JOEB.82.2.67-73
Published online: 07 Aug 2010.
Submit your article to this journal
Article views: 46
View related articles
ABSTRACT. Transacting business with
individuals who may speak English fluently
but have an accent is common today. Use of
translation services such as in transportation
facilities, government offices, educational
institutions, and manufacturers’ instruction
manuals is on the increase. Consequently,
linguistic diversity issues require relevant
academic discussion and attention. In this
article, the author examines university
stu-dents’ perceptions of the acceptance of
munication diverseness and provides
com-parisons of the data on demographic factors
such as age, gender, and ethnicity.
Analyz-ing the results provides insight into the
nature of particular groups to be inclusive or
exclusive on the basis of speech diversity
components.
Key words: communication, culture,
diver-sity, language
Copyright © 2006 Heldref Publications
Student Perceptions of the Acceptance of
Communication Diverseness
BARBARA D. DAVIS UNIVERSITY OF MEMPHIS MEMPHIS, TENNESSEE
ommunication, both oral and written, is fraught with variety. Students are encouraged to add variety to their sentence structure in writing and to use their voice tones to punctu-ate and accentupunctu-ate in speaking situa-tions. These variations in writing and speaking make the information being communicated more interesting and appealing (Lehman & Dufrene, 2002; Lesikar & Flatley, 2005)
Extending the principle that variety in communication is desirable would logi-cally lead to a conclusion that language, which is composed of communication speech patterns (style of speaking), accent, and dialect, would embrace diverseness. However, the degree to which linguistic diversity is recognized and acknowledged continues to be a current, debatable topic (Barrera, 1995). The previous melting pot concept has been replaced by a preference for the tossed salad model. A premise of this
tossed salad principle is that retention of unique cultural characteristics and language is one of the most dominant cultural markers, which members of groups retain for individuality (Plasser-aud, 1993). This linguistic discussion is gaining momentum as demographers document the increased shift in popula-tion of immigrants and minorities, and many in these growing populations are choosing to retain and emphasize their linguistic diverseness (Romano, 1995).
I examined how student perceptions of selected linguistic characteristics are affected by demographic factors such as age, gender, and ethnicity. The results could be useful in the context of inter-national, intercultural, and multicultural activities. An examination of the aspects of communication diverseness may pro-vide discussants of language issues with more insight into the ongoing debate.
Review of Literature
Many educators are ill–equipped in ability or resources to address or assess the needs of their multilingual students (Bradford, Bloch, & Starks, 1999; “English teachers not ready,” 2000; Francis, Kelly, & Bell, 1994; Kubota, 2001; Quisenberry, 1993; Reising, 1997). Because classrooms mirror the larger society, preferences for commu-nication characteristics that reflect the current, dominant societal trends tend to surface. This preference, at one point, was manifest in the workforce and polit-ical arenas by a push for English-only policies (Brady, 1996; Fletcher, 1998; Higley, 1997; McBee, 1986; Nunberg, 1997; Richards, 1993; Solomon, 1996) and what Tabbert (1994) termed lan-guage standardization. Today’s work environment is more open to communi-cation diversity.
Companies taking advantage of expanding business opportunities to globalize, to develop joint–venture
rela-C
tionships, and to form multinational corporations are simultaneously chal-lenged with addressing employee atti-tudes related to cultural suppositions (Domke–Damonte, 2001; Ryan, Chan, Ployhart, & Slade, 1999). The founda-tion of cross–cultural opportunities rests on the ability of organizations to operate effectively within diverse cultures. What constitutes a diverse culture is too often associated with only the most common factors of age, gender, and eth-nicity. However, the language compo-nent with its importance and relevance to a people’s cultural identity is often discounted or overlooked (Barrera, 1995; Davis, 2002; Tabbert, 1994). Communication differences may ulti-mately restrict the organization’s progress toward diversity goals (Kubo-ta, 2001; Solomon, 1996). If the lan-guage dilemma were viewed from the perspective of the 80/20 rule suggesting that the greatest results are generated by the smallest percent of contributors and conversely that the greatest percent of contributors produce the smallest results, its effect on diversity issues might be more discerning. For example, most of the world’s population speaks only one of the eight common lan-guages (Chinese, English, Hindi, Span-ish, Russian, Arabic, Portuguese, and French). The literature indicates that the majority of the linguistic diversity is manifest in a small percent of the world’s population (Russell, 1992; “Winners and Losers,” 2002). Further, Byfield (2001) reports “ninety percent of all languages have fewer than 100,000 speakers” (p. 40). Bilingual or multilingual senior level managers also are rare.
This realization might be unsettling to companies striving for the competi-tive edge in a global environment. Com-panies with business executives who relish the position of English as the international language or who hesitate to proactively prepare for a multilingual work environment may find themselves disadvantaged and in the minority (Bradford, Bloch, & Starks, 1999; “European Year of Language,” 2001; Ostler, 2000). In addition, the growing trend of immigrants and minorities retaining their language heritage war-rants special consideration from
organi-zations and business executives (Nun-berg, 1997; Plasseraud, 1993). Because there are over 6,000 languages spoken by the world’s population, the previous comfort zone for the English language is being challenged (Bloom, 2002; “European Year of Language”; Gibbs, 2002; Ostler; Raloff, 1995; “Winners and Losers,” 2002).
With so many different languages comes a plethora of other characteristics including variations in speech patterns, accent, and dialect. These variations are expected when researchers report esti-mates on the number of English speak-ers with figures such as 700 million, 1,800 million, or up to approximately 2 billion (Kubota, 2001; Macfarlane, 2002). Logically, as the research also indicates, the ratio of non native speak-ers to native speakspeak-ers has increased across the world (Bradford, Bloch, & Starks, 1999; Kubota; Ostler, 2000).
The boundaryless nature of the inter-national community dictates the need for further examination of linguistic issues. Recent appeals from government agen-cies to increase national language and cultural competence via higher educa-tion are now priority issues (Department of Defense, 2005). Research identifying stereotypes, preferences, legal ramifica-tions, and behavior associated with lan-guage nuances indicates specific preva-lent attitudes about the various aspects of linguistic diversity (Davis, 2002; Henderson, 2005; Wilkinson, 2004). Businesspeople can improve their inter-personal skills if they are more aware of the perceptual differences different groups embody.
A close analysis of the literature pro-vides insight into how age, gender, and ethnicity affect attitudes about linguistic diversity. The evidence sometimes requires inference, but it exists. For example, English-only policies are gen-erally supported by European Ameri-cans while minority populations are either neutral to or reject such proposals (Haggerty, 1995; Higley, 1997). Gener-ally, older immigrants retain their native language while younger immigrants are more bilingual or multilingual (Raloff, 1995). There are many instances of immigrant parents who do not speak English and rely upon their children to bridge the language gap. Researchers
also report that personal, social, and professional character traits are identi-fied or stereotyped positively or nega-tively by the country’s various cultures as determined by perceptions of other culture’s language usage, communica-tion speech patterns, accents, and dialects (Anderson, 1996; Cargile & Giles, 1997; Dobrow & Gidney, 1998; Dominic & Hogg, 1987; Edwards & Jacobsen, 1987; Gudykunst & Schmidt, 1987; Robinson, 1996; Tabbert, 1994; Tsalikis, DeShields, & LaTour, 1991; Tsalikis & Ortiz–Buonafina, 1992).
METHOD
I examined respondents’ perception of the acceptance of language diverse-ness including communication speech patterns, accent, and dialect on the basis of selected demographic factors (i.e., age, gender, and culture).
I developed a 20-item survey instru-ment (see Appendix), using topics from the literature, that addresses language, speech and accent patterns, English-only policies, and legal issues associated with linguistic diversity (Davis, 2002; Tab-bert, 1994; Tsalikis, et al., 1991; Tsalikis & Ortiz–Buonafina, 1992), and adminis-tered the survey to business communica-tion students in two Southern universi-ties. The goal was to determine the student perceptions of the acceptance of language characteristics on the basis of selected demographic factors. One of the schools was located in a metropolitan area whereas the other institution was in a small, rural town. Students responded using a Likert-type scale that ranged from 1 (low) to 5 (high) indicating the degree to which they held various per-ceptions of communication diverseness.
RESULTS
For statistical analysis, I used SPSS, Version 10.0. The majority of the 250 respondents, as shown in Table 1, were women, under age 25, and European American.
Mean responses for the 250 respon-dents to each statement are shown in Table 2. The majority of the respondents (a) considered oral communication a diversity component; (b) believed that being bilingual was an advantage; (c)
used language, speech, and accent pat-terns to help assess intelligence, compe-tence, or professionalism; (d) interpret-ed such personal traits as friendliness, helpfulness, and cheerfulness of the speaker; (e) perceived that they detected language, speech, and accent used stereotypically in entertainment (e.g., movies, TV); (f) preferred to receive information from people who spoke their native language; and (g) believed that listeners attach emotional associa-tions to certain accents and messages.
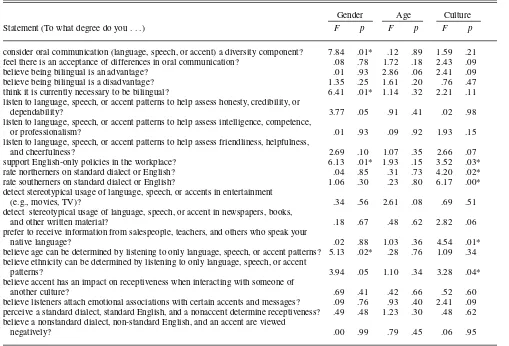
I performed a series of analysis of (ANOVA) to determine the influence of
gender, age, and culture on the respons-es. I applied Tukey’s post hoc test, where appropriate, to determine between group variances. Significant differences (p < .05) existed between demographic fac-tors on 4 of the 20 statements related to gender and on 5 related to culture. Table 3 shows the ANOVA results. No signifi-cant differences existed among age groups on the 20 statements.
DISCUSSION
Significant differences existed between the demographic factors of
gender and culture with the responses. Four of the 20 statements showed a sig-nificant difference by gender. Mean averages indicated that women were more likely than were men to consider oral communication (language, speech, and accent) a diversity component (M= 3.93) and to think it was currently nec-essary to be bilingual (M= 3.29). Men had higher mean averages for the state-ment that supported English-only poli-cies in the workplace (M = 2.96), and the statement that asked the degree to which age can be determined by listen-ing to language, speech, and accent pat-terns only (M = 2.58) than women, which meant that they perceived these as more likely than did women.
European American students showed higher mean averages for 5 of the 20 responses compared with African Amer-icans or other cultures (Asian, Hispanic, or Native American). Further analysis of between group differences indicated that compared with African Americans, European Americans showed greater support of English-only policies in the workplace (M = 2.46 and 2.92, respec-tively); rated northerners (M= 2.54 and 2.98, respectively) and southerners (M= 2.40 and 2.90, respectively) on their use of standard dialect or English; and
pre-TABLE 1. Demographic Breakdown of Respondents
Characteristic n %
Gender
Women 138 55.2
Men 112 44.8
Age
< 25 198 79.2
25–39 50 20.0
40–54 2 0.8
≥ 55 0 0.0
Culture
African American 88 35.2
European American 137 54.8
Other (Asian, Hispanic, Native American) 23 9.2
TABLE 2. Mean Averages for Respondents on Perceptions of Linguistic Factors
Statement (To what degree do you . . .) M SD
consider oral communication (language, speech, or accent) a diversity component? 3.79 0.87
feel there is an acceptance of differences in oral communication? 3.35 0.95
believe being bilingual is an advantage? 4.45 0.91
believe being bilingual is a disadvantage? 1.44 0.90
think it is currently necessary to be bilingual? 3.13 1.14
listen to language, speech, or accent patterns to help assess honesty, credibility, or dependability? 3.42 1.15 listen to language, speech, or accent patterns to help assess intelligence, competence, or professionalism? 3.76 1.08 listen to language, speech, or accent patterns to help assess friendliness, helpfulness, and cheerfulness? 3.77 1.05
support English-only policies in the workplace? 2.73 1.28
rate northerners on standard dialect or English? 2.81 1.15
rate southerners on standard dialect or English? 2.69 1.09
detect stereotypical usage of language, speech, or accents in entertainment (e.g., movies, TV)? 3.66 1.08 detect stereotypical usage of language, speech, or accent in newspapers, books, and other written material? 3.21 1.10 prefer to receive information from salespeople, teachers, and others who speak your native language? 3.82 1.24 believe age can be determined by listening to only language, speech, or accent patterns? 2.40 1.13 believe ethnicity can be determined by listening to only language, speech, or accent patterns? 2.90 1.14 believe a person’s accent has an impact on receptiveness when interacting with someone of another culture? 3.32 2.14 believe listeners attach emotional associations with certain accents and messages? 3.55 0.99 perceive a standard dialect, standard English, and a nonaccent determine receptiveness? 2.97 0.93 believe a nonstandard dialect, nonstandard English, and an accent are viewed negatively? 2.97 1.05
Note. Responses were based on 5-point scales (1 = low, 5 = high).
ferred to receive information from sales associates, teachers, and others who spoke their native language (M = 3.61 and 4.01, respectively).
Only the statement that respondents preferred to receive information from sales associates, teachers, or others who spoke their native language showed a higher mean average for European Americans than it did for people from other cultures (M = 4.01 and 3.35, respectively). Although no two groups differed significantly at the p< .05 level, respondents who believed ethnicity could be determined solely by listening to language, speech, and accent patterns only showed significant difference by culture.
No significant difference existed between the responses and the demo-graphic factor age. However, mean averages were higher for respondents 40 to 54 years of age than they were for those under 25 or 25 to 29 years of age
who thought there was an acceptance of differences in oral communication (M= 4.00); listened to language, speech, and accent patterns to help assess honesty, credibility, or dependability (M = 4.5); intelligence, competence, or profession-alism (M = 4.00); friendliness, helpful-ness, and cheerfulness (M= 4.00); sup-ported English-only policies in the workplace (M = 4.50); preferred to receive information from sales associ-ates, teachers, and others who spoke their native language (M = 5.00); believed ethnicity could be determined by listening only to language, speech, and accent patterns (M= 4.00); believed that a person’s accent determined recep-tiveness when interacting with someone of another culture (M= 4.50); believed listeners attach emotional associations with certain accents and messages (M= 4.50); and perceived a standard dialect, standard English, and a nonaccent determined receptiveness (M = 4.00).
Respondents 25 to 39 years of age (M= 4.54) believed more so than did respon-dents under 25 or 40 to 54 years of age that being bilingual is an advantage. All respondents completing the survey were below age 55.
Conclusions
The results of this survey indicate the degree to which university students per-ceive the influence of selected demo-graphic factors such as age, gender, and culture on the acceptance of communi-cation diverseness. Gender (20%) and culture (25%) were the demographic factors having the most influence. Women were more likely than men to consider oral communication a diversity component and believed it currently necessary to be bilingual. Men and European Americans, more than did women and people with other cultures, supported English-only policies in the
TABLE 3. Results of Analysis of Variance (ANOVA) for Demographic Factors and Responses
Gender Age Culture
Statement (To what degree do you . . .) F p F p F p
consider oral communication (language, speech, or accent) a diversity component? 7.84 .01* .12 .89 1.59 .21 feel there is an acceptance of differences in oral communication? .08 .78 1.72 .18 2.43 .09
believe being bilingual is an advantage? .01 .93 2.86 .06 2.41 .09
believe being bilingual is a disadvantage? 1.35 .25 1.61 .20 .76 .47
think it is currently necessary to be bilingual? 6.41 .01* 1.14 .32 2.21 .11
listen to language, speech, or accent patterns to help assess honesty, credibility, or
dependability? 3.77 .05 .91 .41 .02 .98
listen to language, speech, or accent patterns to help assess intelligence, competence,
or professionalism? .01 .93 .09 .92 1.93 .15
listen to language, speech, or accent patterns to help assess friendliness, helpfulness,
and cheerfulness? 2.69 .10 1.07 .35 2.66 .07
support English-only policies in the workplace? 6.13 .01* 1.93 .15 3.52 .03*
rate northerners on standard dialect or English? .04 .85 .31 .73 4.20 .02*
rate southerners on standard dialect or English? 1.06 .30 .23 .80 6.17 .00*
detect stereotypical usage of language, speech, or accents in entertainment
(e.g., movies, TV)? .34 .56 2.61 .08 .69 .51
detect stereotypical usage of language, speech, or accent in newspapers, books,
and other written material? .18 .67 .48 .62 2.82 .06
prefer to receive information from salespeople, teachers, and others who speak your
native language? .02 .88 1.03 .36 4.54 .01*
believe age can be determined by listening to only language, speech, or accent patterns? 5.13 .02* .28 .76 1.09 .34 believe ethnicity can be determined by listening to only language, speech, or accent
patterns? 3.94 .05 1.10 .34 3.28 .04*
believe accent has an impact on receptiveness when interacting with someone of
another culture? .69 .41 .42 .66 .52 .60
believe listeners attach emotional associations with certain accents and messages? .09 .76 .93 .40 2.41 .09 perceive a standard dialect, standard English, and a nonaccent determine receptiveness? .49 .48 1.23 .30 .48 .62 believe a nonstandard dialect, non-standard English, and an accent are viewed
negatively? .00 .99 .79 .45 .06 .95
*p= .05.
workplace. European Americans, more than African Americans or other cul-tures, preferred to receive information from sales associates, teachers, and oth-ers who spoke their native language.
Whereas the mean average for all respondents indicated that oral commu-nication was considered a diversity component and being bilingual was an advantage, the literature raises ques-tions about these percepques-tions. For exam-ple, past researchers attempted to adopt English-only policies in the workplace (Brady, 1996; Fletcher, 1998; Robinson, 1996; Solomon, 1996) reporting stereo-typical associations to nonstandard English, accents, or dialects.
Respondents’ agreement that they lis-ten to language, speech, and accent pat-terns to help assess intelligence, compe-tence, professionalism, friendliness, helpfulness, and cheerfulness, and that they prefer to receive information from sales associates, teachers, and others who speak their native language is con-sistent with previous findings.
Implications and Recommendations
Information in this study can help educators identify and assess the degree to which communication diverseness is acknowledged and accepted in their environments. There is also a clear inference to include and increase attention to this component in the curriculum, especially because of international business considerations. Another equally important rationale for emphasis on communication diverseness is its projected impact on persuasive communication techniques, business etiquette, listening effective-ness, nonverbal communication, busi-ness presentations, and interviewing or employment strategies.
Getting the attention of an individual of another ethnic group or convincing older employees to change their work behavior will often require students to be cognizant of perceptual differences when they exist in a situation. It is the responsibility of educators to integrate some of these instances into situational examples in lectures or into case studies in homework.
In addition, the demographic factors of age, gender, and ethnicity should
serve as an initial basis for developing curricula and creating programs to address diverse communication issues because they provide significant insight into attitudes about interpersonal and intercultural interactions. Communica-tion issues will inevitably become a major concern as world businesses evolve. Therefore, educators should take a proactive role in making sure stu-dents are adequately prepared to func-tion effectively in a multilingual envi-ronment. Hence, further research on issues of communication diverseness is necessary.
NOTE
Correspondence concerning this article should be addressed to Dr. Barbara D. Davis, Manage-ment DepartManage-ment Room 328, Fogelman College of Business and Economics, University of Mem-phis, MemMem-phis, TN 38152.
E–mail: bddavis@memphis.edu
REFERENCES
Anderson, J. L. (1996). The effects of foreign accent on perceptions of credibility.Stillwater: Oklahoma State University.
Barrera, I. (1995). To refer or not to refer: Untan-gling the web of diversity, “deficit,” and dis-ability. New York State Association for Bilin-gual Education Journal, 10,54–66.
Bloom, P. (2002). Explaining linguistic diversity.
American Scientist, 90,374–375.
Bradford, Bloch, B., & Starks, D. (1999). The many faces of English: Intralanguage variation and its implications for international business.
Corporate Communications, 4(2), 80–88. Brady, T. (1996). The downside of diversity.
Man-agement Review, 85(6), 29–31.
Byfield, M. (2001). Numbers. Report/News-magazine, 28(13), 40.
Cargile, A. C., & Giles, H. (1997). Understanding lan-guage attitudes: Exploring listener affect and iden-tity. Language & Communication, 17,195–117. Davis, B. D. (2002). Perceptions: Ethnolinguistic
issues and implications. The Association for Busi-ness Communication Southeast United States Region 2002 Refereed Proceedings, USA, 31–38. Department of Defense. (2005, April).
Transfor-mation efforts expand to include focus on lan-guages, culture (Publication No. 703-695-0192). Retrieved September 16, 2005, from FDCH Regulatory Intelligence Database via EbscoHost database.
Dobrow, J. R., & Gidney, C. L. (1998). The good, the bad, and the foreign: The use of dialect in children’s animated television. The Annals of the American Academy of Political and Social Science, 557,105–119.
Dominic, A., & Hogg, M. A. (1987). Language atti-tudes, frames of reference, and social identity: A Scottish dimension. Journal of Language and Social Psychology, 5,202–213.
Domke-Damonte, D. (2001). Language learning and international business. S. A. M. Advanced Management Journal, 66(1), 35–40.
Edwards, J., & Jacobsen, M. (1987). Standard and regional standard speech: Distinctions and sim-ilarities. Language and Society, 16,369–380.
English teachers not ready for language diversity. (2000). Retrieved August 13, 2002, from http://web5.infotrac.galegroup.com/itw/...!xm_ 24_0_A66751946?sw_aep=tel_a_uofmem
European year of languages 2001 – the celebra-tion of linguistic diversity. (2001). Retrieved September 28, 2001, from http://www.cactus language.com/info/europeanyearoflanguages essayonlinguisticdiversity
Fletcher, M. A. (1998, November 30). Language rules translate into litigation: Employers’ English-only policies called backlash against immigrants. The Washington Post,pp. A, A01. Francis, K. C., Kelly, R. J., & Bell, M. J. (1994). Language diversity in the university: Aspects of remediation, open admissions and multicultur-alism. Education,114,523–529.
Gibbs, W. (2002). Saving dying languages: Lin-guists have known for years that thousands of the world’s languages are at grave risk of extinction. Yet only recently has the field sum-moned the will––and the money––to do much about it. Scientific American, 287,78–85. Gudykunst, W., & Schmidt, K. L. (1987).
Lan-guage and ethnic identity: An overview and prologue. Journal of Language and Social Psy-chology, 6,157–170.
Haggerty, A. G. (1995). NW Mutual sued over “English proficiency” policy. National Under-writer, 99(25), 4.
Henderson, J. K. (2005). Language diversity in international management teams. International Studies of Management & Organization, 35(1), 66–82.
Higley, J. (1997). Language barrier leads to resigna-tions. Hotel & Motel Management, 212(9), 20–21. Kubota, R. (2001). Learning diversity from world
Englishes. The Social Studies, 92(2), 69. Lehman, C. M., & Dufrene, D. D. (2002).
Busi-ness communication(13th ed.). Cincinnati, OH: Thomson.
Lesikar, R. V., & Flatley, M. E. (2005). Basic business communication, skills for empowering the Internet generation (10th ed.). New York: McGraw-Hill.
Macfarlane, R. (2002). A crossroads with two signposts: Diversity and uniformity. Spectator, 288,46–47.
McBee, S. (1986, October). A war over words.
U.S. News & World Report, 101,64.
Nunberg, G. (1997). Lingo jingo: English only and the new nativism. The American Prospect, 8(33), 40–47.
Ostler, R. (2000). Disappearing languages of the 6,000 languages still on earth, 90 percent could be gone by 2100. Retrieved January 24, 2002, from http://www.findarticles.com/cf_0/m0GER/ 2000_Spring/61426207/print.jhtml
Plasseraud, Y. (1993, June). A sense of difference. Retrieved on November 7, 2006, from http://findarticles.com/p/articles/mi_m1310/is_ 1993_June/ai_14156380
Quisenberry, J. D. (1993). Linguistic and cultural differences teachers should know. Childhood Education, 70(2), 96.
Raloff, J. (1995, February 25). Languishing lan-guages: Cultures at risk. Science News, 147,117. Reising, B. (1997). Ebonics: When is dialect acceptable English? The Clearing House, 70(5), 228–229.
Richards, P. O. (1993). Authentic language lessons from my grandparents. Educational Leadership, 51(1), 87.
Robinson, J. A. (1996). The relationship between personal characteristics and attitudes toward Black and White speakers of informal
non–standard English. The Western Journal of Black Studies, 20(4), 211–221.
Romano, E. (1995). Opportunity in diversity. (impact of changing American demographics on real estate industry). Journal of Property Management, 60(2), 30–35.
Russell, B. H. (1992). Preserving language diver-sity,Human Organization, 51(1), 82. Ryan, A. M., Chan, D., Ployhart, R. E., & Slade,
L. A. (1999). Employee attitude surveys in a multinational organization: Considering lan-guage and culture in assessing measurement
equivalence. Personnel Psychology, 52(1), 37–58.
Solomon, C. M. (1996). Testing at odds with diversity efforts? Personnel Journal, 75(4), 131–138.
Tabbert, R. (1994). Linguistic diversity in America: Will we all speak “General American?”(Report No. FL 022 275). Opinion paper. (ERIC Docu-ment Reproduction Service No. ED 374 658) Tsalikis, J., DeShields, O. W. Jr., & LaTour, M. S.
(1991). The role of accent on the credibility and effectiveness of the salesperson. Journal of
Per-sonal Selling & Sales Management, 11(1), 31–41.
Tsalikis, J., & Ortiz–Buonafina, M. (1992). The role of accent on the credibility and effective-ness of the international busieffective-ness person: The case of Guatemala. International Marketing Review, 9(4), 57–72.
Wilkinson, K. T. (2004). Language difference and communication policy in the information age.
Information Society, 20(3), 217–229. Winners and losers. (2002, April). UNESCO
Courier,20.
To what degree (1 = low, 5 = high) do you:
1. consider oral communication (language, speech, accent) a diversity component?
1 2 3 4 5
2. feel there is an acceptance of differences in oral com-munication?
1 2 3 4 5
3. believe being bilingual is an advantage? 1 2 3 4 5
4. believe being monolingual is a disadvantage? 1 2 3 4 5
5. think it is currently necessary to be bilingual? 1 2 3 4 5
6. listen to language, speech, accent patterns to help assess honesty, credibility, or dependability?
1 2 3 4 5
7. listen to language, speech, accent patterns to help assess intelligence, competence, or professionalism?
1 2 3 4 5
8. listen to language, speech, accent patterns to help assess friendliness, helpfulness, and cheerfulness?
1 2 3 4 5
9. support English-only policies in the workplace? 1 2 3 4 5
10. rate northerners on standard dialect or English? 1 2 3 4 5
11. rate southerners on standard dialect or English? 1 2 3 4 5
12. detect language, speech, accent used stereotypically in entertainment (movies/TV, etc.)?
1 2 3 4 5
APPENDIX
Perceptions of Oral Communication as a Diversity Component
13. detect language, speech, accent used stereotypically in newspapers, books, etc.?
1 2 3 4 5
14. prefer to receive information from sales associates, teach-ers, etc. who speak your native language?
1 2 3 4 5
15. believe age can be determined by listening to language, speech, accent patterns only?
1 2 3 4 5
16. believe ethnicity can be determined by listening to lan-guage/speech/accent patterns only?
1 2 3 4 5
17. believe that people’s accents have an effect on their receptiveness when interacting with someone of another culture?
1 2 3 4 5
18. believe listeners attach emotional associations with cer-tain accents and messages?
1 2 3 4 5
19. perceive a standard dialect, standard English, and a nonaccent determine receptiveness?
1 2 3 4 5
20. believe a nonstandard dialect, nonstandard English, and an accent are viewed negatively?
1 2 3 4 5
Directions: Please place a checkmark by the appropriate item for each question.
21. How often to you have contact with people whose native language is NOT English?
____Regularly ____Seldom ____Occasionally ____Never
Directions: On a scale of 1 to 5, with 5 being the highest rating, indicate your perceptions pertaining to oral communication (language, speech, accent) and diversity.
22. What aspect of a speaker’s voice influences you the most? (Choose only one)
____speed ____intonation ____accent _____grammar ____pronunciation _______________other (please specify)
23. Gender: ____Female _____Male
24. Age: ____Under 25 ___25–39 ____40–54 ____55 or above
25. Culture:____African American or Black ____Asian _____European American or White ____Hispanic _____Native American ___Other (please specify)