70
Fish stock estimation in Sikka Regency Waters, Indonesia using Single
Beam Echosounder (CruzPro fish finder PcFF-80)
with
hydroacoustic survey
method
Muhammad Zainuddin Lubis
*, Wenang Anurogo
Department of Informatics Engineering, Geomatics Engineering Batam Polytechnic, Batam Kepulauan Riau 29461. Indonesia. *Corresponding author email: [email protected]
ABSTRACT
Sikka regency waters including fishery management with a high utilization status so that the necessary stages of an intensive monitoring and research potential of fish resources. This study aimed to obtain the estimated value of stock biomass and density of fish resources with the acoustic method. Quantitative data obtained will be a source of current information on the state of fish resources in the Sikka regency waters, Indonesia. The research was conducted in May 2015. Acoustic data retrieval, using instruments CruzPro fish finder PcFF-80 with sound velocity of 1516 m / s, power 2560 Watt, and method in survey acoustic use hydroacoustic long transect. The horizontal distribution shows a fluctuation striking at research location has the highest salinity levels in the range of 29.3-29.8 psu. Total biomass of fish in this study showed more the number is at a depth of 11-20 m that is 2,008 tons/km and at a depth of 1-10 m have the total fish biomass is 12.33 tons/km, single detection is done using a single target hydroacoustic show more dominance at a depth of 11-20 m in Sikka regency waters, MTB, Indonesia in May 2015. Number of data from results obtained by looking at the relationship between the number of the data with the total biomass in 1-10 m depth has equation Y = 0.0967x + 0.0486 with R2 is 0.0464 (4%) , while at a depth of 11-20 m has a regression equation is Y = 0.0003x + 0041 with the R2 is 0.0091 (0.9%). Variations in the data or the detection of single targets have variations over the data that is at a depth of 11-20 m with the lowest regression is 0.9%. Keywords: Hydroacoustic, Salinity, Biomass, Stock estimation, Sikka regency waters.
INTRODUCTION
Quantitative estimation of the size of fish populations is needed in the development and management of fish resources. Utilization of fish resources can be optimally done when stocks and distribution of fish resources were certainly known, as its importance for policy and sustainability. Sikka regency waters have significance for the business activities of fisheries which exploit small pelagic fish resources. Fishing tools that commonly used were gill nets and longlines. Study of oceanography parameters in Sikka regency waters that related to fish distribution is still limited, hence this study becomes important.
The aggregation of pelagic fish into schools or shoals is presumed to confer potential benefits of reduced predation risk, achieved through a variety of different mechanisms (Godin, 1986; Pitcher and Parrish, 1993) and increased foraging success. Despite constant progress in understanding the complex processes involved in the variability of pelagic stock abundance, especially at short and medium time scales, our ability to predict abundance and catches are limited, which in turn limits our capacity to properly manage the fisheries and ensure sustainable exploitation. Substantial progress can be expected from an integrated modeling approach to spatialized models coupling hydrodynamics, biogeochemical, and ecological processes (Watson and Pauly, 2001). However, the foraging value of schooling may shift from benefit to cost if prey densities decline. Under low food conditions, individual foraging success is reduced due to local depletion of food by fellow group members (Folt, 1987). Another potential cost of compact schools includes the energy expended in maintaining position within the echo processing (Lubis
et al., 2016a).
Because pelagic fish are highly aggregated, the time was taken to catch them is short in comparison to the time spent searching for them. Modern fishing of pelagic fish is mostly dependent on detection and location of fish shoals by hydroacoustic instruments (Misund, 1997). Larger purse seiners (> 40 m) have a low frequency, low-resolution sonar (18–34 kHz) for detecting fish shoals at long range, and a high-frequency, high-resolution sonar (120–180 kHz) for more detailed mapping of shoal size and fish behavior in relation to the vessel and the net. In addition to this equipment, pelagic trawlers have
71
computing power have led to a gradual movement away from using acoustic biomass estimates merely as relative indices to their use as absolute estimates of abundance (Boyer and Hampton 2001, Løland et al. 2007), sometimes with quantitative estimates of uncertainty.
Quantifying sea bottom surface backscattering strength with echosounder and identifying bottom fish by using the hydroacoustic method most recently in the years 2003-2015 is (Manik et al., 2006) and (Manik, 2010), and using Cruzpro Fishfinder according to (Lubis and Pujiyati, 2016), while research about acoustic backscatter quantification of seabed in (Pujiyati, 2008; Pujiyati et al., 2011). The hydroacoustic method also use in estimation of zooplankton (Moniharapon et al., 2014). The aim of this hydroacoustic survey was to estimate the total biomass of fish in Sikka regency waters using long transects sampling patterns and calculation methods of biomass (Lubis and Pujiyati, 2016). The results of this study were described in the map of fish density distribution for each stratum depth.
MATERIALS AND METHODS
Time and Site
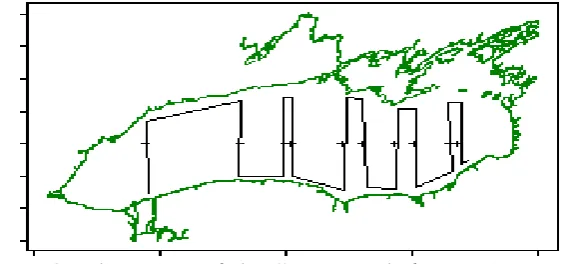
The research was conducted in May 2015 in Sikka regency waters, East Nusa Tenggara Province, Indonesia with latitude 8°41'50.77"S , longitude 122° 8'32.67"E. Data collections in this research were using a traditional fishing boat. Sampling points and “long” transect in hydroacoustic survey method (Figure 1). Acoustic data acquisition was done using instruments Cruzpro fish finder PcFF-80 (www.cruzpro.com) with a sound velocity of 1516 m/s and power of 2560 Watt (Figure 2).
Figure 1. Sampling points and “long” transect in hydroacoustic survey method
Data Collection
The acoustic data were collected using a Cruzpro fish finder PcFF-80 at a frequency 200 and 50 kHz. An equipment calibration was conducted according to Cruzpro fish finder PcFF-80 specifications before the start of each survey. Midwater trawls were used to identify echo-traces and to determine the species size-frequency distribution (MacLennan and Simmonds, 1992).The target strength (TS) was assumed from the equation suggested by Foote (1987).
72
a b c d
Figure 2. Hydroacoustic Instruments CruzPro fish finder PcFF-80 with a)Pc/ Computer , b)Interface , c) Hand GPS, d) Transducer (Single beam echosounder) ( personal documentation)
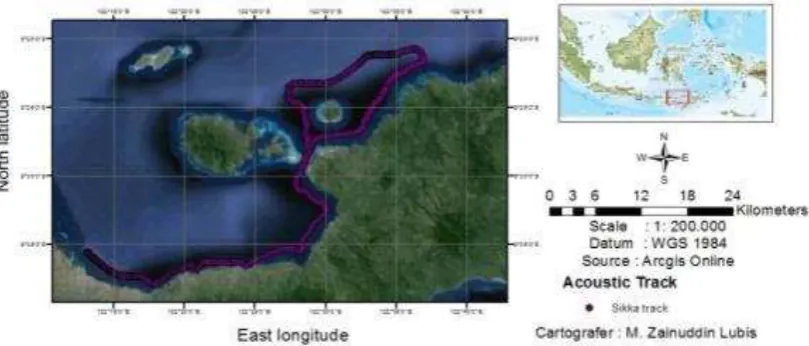
Figure 3. Tracking of cruise acoustic survey (fish stock estimation and research location) in Sikka Regency Waters, Indonesia
Data Processing and Analysis
Acoustic data were processed using Sonar software ver.4 and Matlab R2008b. Analysis of fish estimation was done starting from a depth of 1-10 m, with units of fish biomass yield is (tail/1000m3). acoustic formula namely Target strength (TS) which described as the ability of the underwater target to return an echo. Based domain is used, the target strength is defined into two, namely in the form of Intensity Target Strength (TSi) and Energy Target Strength (TSE). Target strength can be defined as the quotient between the value of the reflected intensity of the target to the sound intensity hit the target in logarithmic function (Johanesson and Mitson, 1983).
TSi =10 log ………. (1)
TSe =10 log q ……….. (2)
Where, Tsi= Intensity of target strength, Ii= Intensity of sound on targets , Ir = intensity of the reflected sound energy targets , Tse= Target Strength , Ei= Energy sound on targets , Er= Energy reflection sound at a distance of 1 meter from the target.
In additio (Natsir et al., 2005) has a long -weighs equation to convert length into weight as follows:
73
Sikka regency waters can be seen in (Figure 4b), and the spatial distribution of resources fish. Acoustic detection results at the time of the survey showed that in (Figure 5a, and 5b).
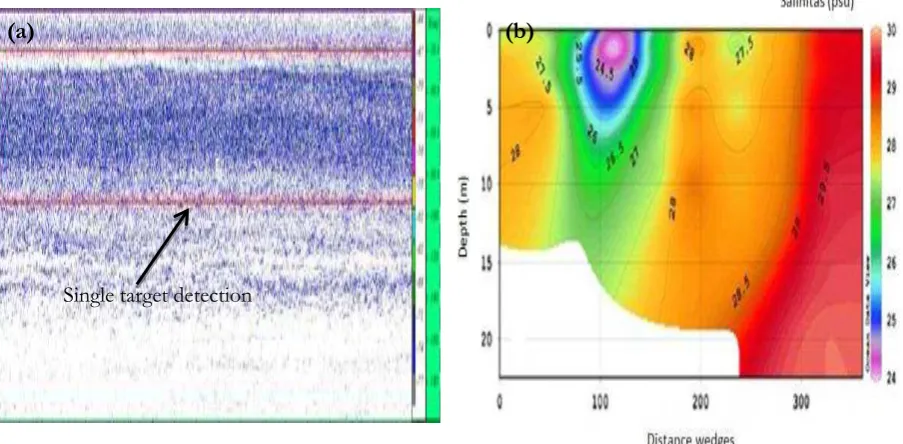
At a depth of 1-10 have the results of the spatial distribution of fish distribution (Figure 5a) have very little it is expected due to dilution by the relatively higher rainfall in May. In (Figure 5b) shows the vertical distribution of salinity, the horizontal distribution shows fluctuations striking at research location has the highest salinity levels in the range of 29.3-29.8 psu. The 3D spatial distribution of fish at depth of 1-10 meters (Figure 5a) show more fish biomass values were in the range of 0 to 50 (tail / 1000 m3), whereas the biomass was highest, namely 3101 to 7177 (tail / 1000 m3). This clearly provides that the information of the distribution of fish at depths of 1-10 m in Sikka waters, Indonesia has very little biomass.
Fish stock estimation of biomass results obtained at a depth of 11-20 meters has a spatial distribution that is more than the depth of 1-10 meters (Figure 5b), these results can be seen in (Figure 5a) in the 3D spatial distribution of fish at the depth of 1-10 meters, with the highest distribution is 0 to 50 (tail / 1000 m3), the spatial distribution of the most prevalent is 51-100, and distribution of at least the biomass is 201-310 (tail / 1000 m3). The total biomass of fish in this study showed more the number is at a depth of 11-20 m that is 2,008 tons/Km and at a depth of 1-10 m have the total fish biomass is 12.33 tons/ km with a total different single target detection, the results obtained are the actual results of the tool hydroacoustic a single beam and do not use the fishing gear for example aids gillnet is not the same with other research (Mehner and Schulz, 2002, Patterson et al., 2001). Single detection is done using a single target hydroacoustic show more dominance at a depth of 11-20 m in Sikka Regency waters, Maluku Tenggara Barat, Indonesia in May 2015.
Figure 4. (a) Single target echogram in depth 1-10 m, (b) Vertical distribution of salinity in Sikka regency waters
Single target detection
(b)
(a)
74
Figure 5. (a) 3D Spatial distribution of fish at depth of 1-10 meters, (b) 3D Spatial distribution of fish at depth of 11-20 m
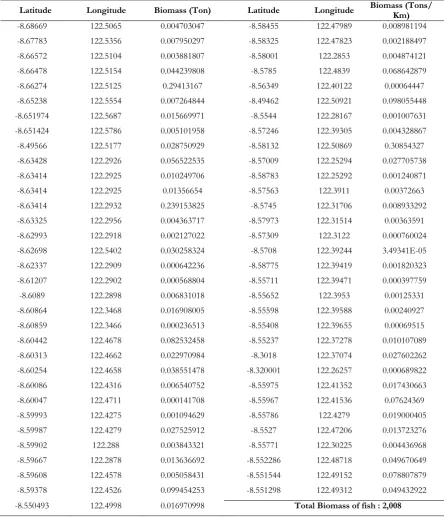
Table 1. Biomass estimation of fish (ton) in depth 1-10 m
Longitude Latitude Biomass (Tons/Km)
122.21957 -8.51704 3.82266
122.22368 -8.51561 0.02488
122.29318 -8.53414 0.02487
122.40081 -8.59689 0.03478
122.39901 -8.5009 0.00146
122.39796 -8.50294 0.10224
122.39796 -8.50295 0.18051
122.3966 -8.50494 0.16814
122.3928 -8.51017 0.04713
122.39069 -8.53182 0.00373
122.39319 -8.54317 0.00501
122.39593 -8.55063 0.00936
122.49183 -8.36976 0.09491
122.50689 -8.35369 0.63692
122.39939 -8.49581 7.17615
75
-8.66274 122.5125 0.29413167 -8.56349 122.40122 0.00064447
-8.65238 122.5554 0.007264844 -8.49462 122.50921 0.098055448
-8.651974 122.5687 0.015669971 -8.5544 122.28167 0.001007631
-8.651424 122.5786 0.005101958 -8.57246 122.39305 0.004328867
-8.49566 122.5177 0.028750929 -8.58132 122.50869 0.30854327
-8.63428 122.2926 0.056522535 -8.57009 122.25294 0.027705738
-8.63414 122.2925 0.010249706 -8.58783 122.25292 0.001240871
-8.63414 122.2925 0.01356654 -8.57563 122.3911 0.00372663
-8.63414 122.2932 0.239153825 -8.5745 122.31706 0.008933292
-8.63325 122.2956 0.004363717 -8.57973 122.31514 0.00363591
-8.62993 122.2918 0.002127022 -8.57309 122.3122 0.000760024
-8.62698 122.5402 0.030258324 -8.5708 122.39244 3.49341E-05
-8.62337 122.2909 0.000642236 -8.58775 122.39419 0.001820323
-8.61207 122.2902 0.000568804 -8.55711 122.39471 0.000397759
-8.6089 122.2898 0.006831018 -8.55652 122.3953 0.00125331
-8.60864 122.3468 0.016908005 -8.55598 122.39588 0.00240927
-8.60859 122.3466 0.000236513 -8.55408 122.39655 0.00069515
-8.60442 122.4678 0.082532458 -8.55237 122.37278 0.010107089
-8.60313 122.4662 0.022970984 -8.3018 122.37074 0.027602262
-8.60254 122.4658 0.038551478 -8.320001 122.26257 0.000689822
-8.60086 122.4316 0.006540752 -8.55975 122.41352 0.017430663
-8.60047 122.4711 0.000141708 -8.55967 122.41536 0.07624369
-8.59993 122.4275 0.001094629 -8.55786 122.4279 0.019000405
-8.59987 122.4279 0.027525912 -8.5527 122.47206 0.013723276
-8.59902 122.288 0.003843321 -8.55771 122.30225 0.004436968
-8.59667 122.2878 0.013636692 -8.552286 122.48718 0.049670649
-8.59608 122.4578 0.005058431 -8.551544 122.49152 0.078807879
-8.59378 122.4526 0.099454253 -8.551298 122.49312 0.049432922
76
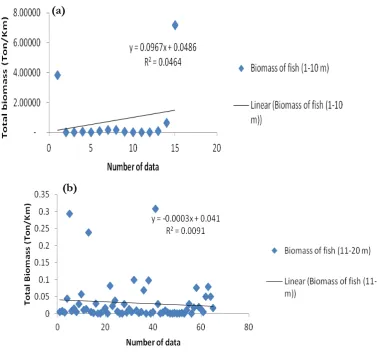
Figure 6. (a).Relationships between number of data with total biomass (Ton) in depth 1-10 m, (b) relationships between number of data with total biomass (Ton) in depth 11-20 m
Total biomass of estimation fish in depth range 1-10 m is 12,33275 tons/km, Biomass estimation of fish (ton) in depth 11-20 m is 2,008 tons/km. The largest biomass in the estimation of fish stock with a depth of 1-10 meters is on longitude 122.39939, latitude -8.49581, with biomass value 7.17615 tons/km. The largest biomass in the estimation of fish stock with a depth of 11-20 meters is on longitude 122.5402, latitude -8.62698, with biomass value 0.030258324 tons/km. On the results of the simple regression performed, at a depth of 11-20 looks variation data is lower than data variation in depth of 1-10 m (Figure 6a, and 6b).Lowest biomass at a depth of 1-10 m range, namely 0.00373 tons/km, while the depth range of 11-20 m has the lowest biomass that is 0.001094629 ton/km. Vertical distribution of salinity in Sikka regency waters have low salinity values is 24 psu while the highest score is 30 psu at a depth of 0-20 meter range. Distance wedges with a range of 250-350 (Figure 4b). Total biomass of fish in this study showed more the number is at a depth of 11-20 m that is 2,008 tons/km and at a depth of 1-10 m have the total fish biomass is 12.33 tons/km, single detection is done using a single target hydroacoustic show more dominance at a depth of 11-20 m in Sikka Regency waters using Cruzpro Fishfinder , Single beam echosounder dual frequency.
Number of data from results obtained by looking at the relationship between the number of the data with the total biomass in depth 1-10 m has to generate Y = 0.0967x + 0.0486 with R2 is 4% (Figure 6a), while at a depth of 11-20 m has a regression equation is Y = 0.0003x + 0041 with the R2 is 0.9%). Variations in the data or the detection of single targets have variations over the data that is at a depth of 11-20 m with regression low percentage is 0.9% (Figure 6b).
(a)
77
ACKNOWLEDGEMENTS
The study was financed by the marine and fisheries department, Bali, Indonesia. We would like to thank Dr. Ir. Totok Hestirianoto, M.Sc, Dr.Ir. Sri Pujiyati, M.Si, Sri Ratih Deswati, M.Si, and Pratiwi Dwi Wulandari, S.Ik from Marine Science and Technology Depertment, Bogor Agricultural University, Indonesia.
REFERENCES
Boyer, D.C., I. Hampton. 2001. Development of acoustic techniques for assessment of orange roughy Hoplostethus atlanticus biomass of Namibia, and of methods for correcting for bias. In: Payne AIL, Pillar SC, Crawford RJM (eds) A Decade of Namibian Fisheries Science. South African Journal of Marine Science, 23: 223–240. Folt, C.L. 1987. An experimental analysis of costs and benefits of zooplankton aggregation. pp. 300–324. In: W.C.
Kerfoot & A. Sih (ed.) Predation: Direct and Indirect Impacts on Aquatic Communities, University Press of New England, Hanover.
Foote, K. 1987. Fish target strengths for use in echo integrator surveys. Journal of Acoustical Society of America, 82: 981–987.
Godin, J.G. 1986. Antipredator function of shoaling in teleost fishes: a selective review. Naturaliste Canadien, 113: 241–250.
Johannson, K. A., R. B. Mitson. 1983. Fisheries acoustics. A practical manual for aquatic biomass estimation, FAG. Fisheries Technical Paper, 240: 1-249.
Løland, A., M. Aldrin, E. Ona, V. Hjellvik, J.C. Holst. 2007. Estimating and decomposing total uncertainty for survey-based abundance estimates of Norwegian spring-spawning herring. ICES Journal of Marine Science, 64: 1302–1312.
Lubis, M. Z. 2016. Identifikasi karakteristik whistle dan tingkah laku lumba-lumba (Tursiops Aduncus) di Taman Safari Indonesia, Cisarua Bogor. Ph.D Dissertation, Bogor Agricultural University, Bogor.
Lubis, M. Z., S. Pujiyati. 2016. Detection backscatter value of mangrove crab (Scylla sp.) using Cruzpro Fishfinder Pcff-80 hydroacoustic instrument. Journal of Biosensor and Bioelectronic, 7(2): 1000205
Lubis, M. Z., P.D. Wulandari, M. Mujahid, J. Hargreaves, V. Pant. 2016a. Echo Processing and Identifying Surface and Bottom Layer with Simrad Ek/Ey 500. Journal of Biosensors and Bioelectronics, 7(3): 1000212 Lubis, M. Z., P.D. Wulandari, M.S. Harahap, M. Tauhid, J.R. Moron,. 2016b. Bioacoustic: percentage click sound of
Indo-Pacific bottlenose dolphins (Tursiops aduncus) in captivity, Indonesia. Journal of Biosensor and Bioelectronic, 7(2): 1000207
Lubis, M. Z. 2014. Bioakustik stridulatory gerak ikan guppy (Poecilia reticulata) saat proses aklimatisasi kadar garam Skripsi, Institut Pertanian Bogor, Bogor.
MacLennan, D., E.J. Simmonds. 1992. Fisheries Acoustics. Chapman and Hall, London.
Manik, H. M. 2010. Measurement of acoustic reflection of tuna fish using echosounder instrument. Journal of Marine Sciences, 14(2): 84-88.
Manik, H. M., M. Furusawa, K. Amakasu. 2006. Quantifying sea bottom surface backscattering strength and identifying bottom fish habitat by quantitative echo sounder. Japanese Journal of Applied Physics, 45(5S): 4865.
Mehner, T., M. Schulz. 2002. Monthly variability of hydroacoustic fish stock estimates in a deep lake and its correlation to gillnet catches. Journal of Fish Biology, 61(5): 1109-1121.
Moniharapon, D., I. Jaya, H. Manik, S. Pujiyati, T. Hestirianoto, A. Syaihailatua. 2014. Daily migration and contribution of calanoida zooplankton to scattering volume in Banda Sea, Indonesia. Journal of Environment and Ecology, 5(1): 103.
Misund, O. A., J. Kolding, P. Fréon. 2002. Fish capture devices and their influence on fisheries management. Pages 13–36 in P. J. B. Hart and J. D. Reynolds (eds). The handbook of fish biology and fisheries. Vol. 2: Fisheries. Blackwell, London.
78
Natsir, M., B. Sadhotomo, Wudianto. 2005. Pendugaan biomassa ikan pelagis di perairan Teluk Tomini dengan metode akustik BIM terbagi. Jurnal Penelitian Perikanan Indonesia, 11 (6): 101-107.
Patterson, K., R. Cook, C. Darby, S. Gavaris, L. Kell, P. Lewy, G. Stefánsson. 2001. Estimating uncertainty in fish stock assessment and forecasting. Fish and Fisheries, 2(2): 125-157.
Pitcher, T.J., J.K. Parrish. 1993. Functions of shoaling behaviour in teleosts. pp. 363–439. In: T.J. Pitcher (ed.) Behaviour of Teleost Fishes, Chapman and Hall, London.
Pujiyati, S., H.M. Manik, Z.A. Harahap. 2011. Acoustic backscatter quantification of seabed using multibeam echosounder instrument. Proceedings of the Third International Conference on Mathematics and Natural Sciences, 911-922.
Pujiyati, S. 2008. Pendekatan metode hidroakustik untuk analisis keterkaitan antara tipe substrat dasar perairan dengan komunitas ikan demersal. Disertasi. Institut Pertanian Bogor, Bogor.
Simmonds, E. J. , D. N. Maclennan. 2005. Fisheries acoustics. Theory and Practice. Blackwell Science Ltd., Oxford. 437 pp.
Watson, R., D. Pauly. 2001. Systematic distortions in world fisheries catch trends. Nature, 414: 534–536.
Wulandari, P.D. 2016. Bioakustik lumba-lumba jantan hidung botol (Tursiops Aduncus) pada kolam karantina, Taman Safari Indonesia, Cisarua Bogor. Skripsi, Institut Pertanian Bogor, Bogor.