39
Whistle sound detection and behavior of male dolphin bottle nose (Tursiops
aduncus) using noisy time domain modelling in captivity
Muhammad Zainuddin Lubis1*, Mahendra Kumar2, Kasih Anggraini3
1Department of Informatics Engineering, Geomatics Engineering, Politeknik Negeri Batam, Batam Kepulauan Riau 29461. Indonesia; 2Department of Electronics Engineering, Rajasthan, Village Ghaghatana post manasgaon Tehsil Ladpura, India; 3Research Center for Oceanography, Jl. Pasir Putih 1 Ancol Timur, Jakarta 14430 Indonesia. *Corresponding author email: [email protected]
ABSTRACT
Whistle sound is a voice that is intended to echolocation, whistle sound is a major role in internal and inter-group communication. The objective research passive acoustic was to examine the power spectral patterns and fluctuations in sound based on the frequency of the sounds produced by male bottle nose dolphin and observing the position of male bottle nose dolphin. Data recording was taken at the Safari Park of Cisarua Bogor in Indonesia, by taking data in show captivity. The results showed that salinity before feeding time in the show captivity
with replication 1,2, and 3 has salinity value that is equal to 30 ‰. Data at the show captivity before feeding with
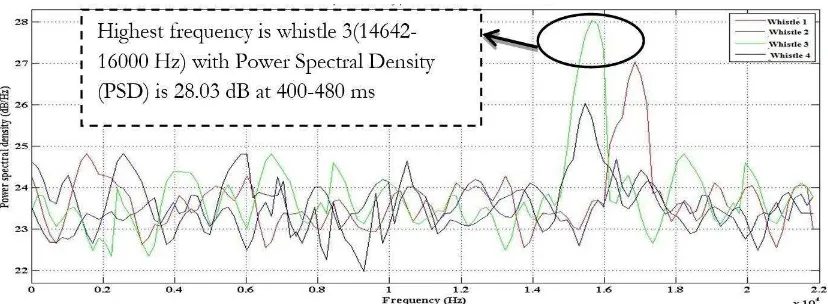
replications 1,2, and 3 has a salinity of 29 ‰. Sound whistle 3 before feeding time of 28.03 dB with the frequency interval of 14 642 Hz-16000 Hz. F-test at the show captivity before meals has heterogeneous value. Treat before meals at the show captivity has a value of P <0.001 and P <0.001. Value Noisy Time Domain have differences with each other and have a lot of different sound patterns. In general, there are real differences are evidenced by F test on a range of time at each whistle on show captivity in the time before meals. The behavior of male bottle nose dolphin have a habit that has the movement toward the surface of the captivity and movement and position will be influenced frequency and intensity value (Meals time is done in the morning, afternoon, and afternoon with the difference before and after meals have a 4-hour interval). In general, there is a significant difference evidenced by the F test at 4-hour intervals at each whistle sound in captivity at both before meals.
Keywords: Whistle sound, Noisy Time Domain (NTD), Salinity, Intensity, Frequency.
INTRODUCTION
In Fisheries field studies in mammals of echolocation signals, data can be obtained from animals under natural conditions for which their sonar evolved. However, in field studies, there is limited or no experimental control to test specific features of echolocation from male bottle nose dolphin Tursiops aduncus (Lubis, 2014; Lubis et al., 2016). The animals will use their sonar in a manner that is representative of free-ranging animals. Bioacoustics is a science that involves neurophysiology and anatomy for the production and detection of sound, and the relationship with the acoustic signal dispersion medium (Lubis and Pujiyati, 2015; Lubis et al., 2017; Lubis, 2016a; Lubis, 2016b; Lubis and Wenang, 2016).
Limited reports on the behavior and vocalizations of male bottle nose dolphin, have been made (Caldwell, 1965). From early recordings of male bottle nose dolphin biosonar, click source levels were estimated to be 170 dB re 1 lPa peak to peak (PP), with a frequency emphasis 35–60 kHz (Norris et al., 1961). These measurements were made of an animal in a relatively small and highly reverberant tank. Biosonar capabilities of male bottle nose dolphin under much less reverberant conditions with performed long-range target detection experiments with animals in a relatively shallow, open-water environment (Hastie et al., 2013). In these experiments, the dolphins emitted whistle with source levels of up to 228 dB re 1 lPa (PP) at 1 m and peak frequency above 100000 Hz when successfully echolocating a 5 cm steel sphere out to ranges of 89 m.
Male dolphins bottle nose have small groups of dolphins frequently approached the recording platform. Data acquisition was manually initiated when male bottle nose dolphin was observed surfacing within 100 m of and toward the array. The acquisition lasted until the male
40
bottle nose dolphin had passed the recording platform, interrupted 5 s every minute for data storage. The noise level, measured with a B & K 8101 hydrophone (receiving sensitivity 184 dB re 1 lPa/V) was high, up to 60 dB re 1lPa in the measured frequency range 200–40000Hz, probably below this level in the whole frequency range of interest for Tursiops echolocation (up to some 120000 Hz). Ambient noise was broad spectral noise from snapping shrimps (for details on noise measurements, see (Jensen et al., 2009). The purpose of this study was to analyze the spectral use of Noisy Time Domains (NTD) for the sound and to see its relation to the behavior of male bottle nose dolphin in captivity.
MATERIALS AND METHODS
Time and location
We collect the data with made the recordings between in May 2016 in captivity (Safari Park Indonesia, Cisarua Bogor). Indonesia with two male bottle nose dolphin (Tursiops aduncus), weight 358 kg, length 2.46 m. Sounds were recorded with a High Tech SQ 03 hydrophone (sensitivity -162 dB re 1VµPa-1 @ 20ºC with frequency response is ±1.5 dB from 7 Hz to 22 kHz) placed just above the rim of a territorial in aquaria with connected to Sea Phone Sensor (Dolphin Ear).
Power Spectral Density (PSD)
Power Spectral Density (PSD) function to equalize the number of rows and columns of data matrix m-file of the results of the voice recording process. Power spectral density is a useful concept to determine the optimum frequency band of the signal transmission system. PSD is a variation of power (energy) as a function of the frequency spectrum in the form of density estimated using FFT, PSD method is one of the modern spectral estimation technique proposed during this decade for identification of whistle sound and relation to the behavior of male bottle nose dolphin (Kostenko and Vasylyshyn, 2014). Power Spectral value can be obtained equation (1,2 and 3): corresponds to the frequency range of whistle contours in bottlenose dolphins. We continuously noted the location (large or small captivity) of each dolphin. Recordings were made either while all the animals were swimming together in the main captivity or whenever one animal swam separately from the others in one of the captivity Pressure wave propagating away from the sound in the medium by a particle velocity component No recordings were made during feeding or training sessions. Each session was started after the animals had been undisturbed for at least 10 min. Observations were made from an elevated point 3 m from the captivity.
(v) and a pressure component (p), product defines the acoustic intensity (I):
I = p.v (4)
Velocity by the pressure divided by the acoustic impedance of the medium. The acoustic impedance of the medium (p).
41 In decibel units the equation is :
10 log10 (I/I0) (6)
I0 is the intensity from sound pressure of 1 mPa in water measured, quantify the sound pressure
as
dB re µPa = 20 log10 (p/p0) (7)
This Research of whistle sound from underwater video and sound recordings made between Mei and Juni 2015 with video cameras (GoPro Hero 3+) and a SQR 3 hydrophone instrument, flat to 22 kHz with a –192 dB re 1 µPa in show captivity, before meals. Whistles were assigned to specific individuals when a dolphin was alone in the camera/hydrophone vicinity, in sole proximity (< 1 m) of the camera/hydrophone, or showed simultaneous bubble emissions correlated with a whistle. Dolphin vocalizations, individuals more than 5 m away from the recording equipment never emitted whistles as loud as dolphins within 1 m. If a group of dolphins was present, the intensity of the whistle was only used to determine the whistling individual when one dolphin was close to the hydrophone (< 1 m) and the rest of the group was further away (≥ 5 m). Some previous studies have relied on only bubble streams to identify the vocalizing individuals (McCowan & Reiss, 2001; Sayigh et al., 2007). However, our unique underwater viewing allowed us to note not only bubble streams but also the directional orientation and proximity of individuals to the recording equipment and the lack of other dolphins at the park of safari, Cisarua Bogor in Indonesia. Whistles were digitized from audio recordings using Raven Pro 1.5 software at 44.1 kHz sampling rate (Whistle 1, 2, 3, and 4). Data Analysis with Test F, All statistical tests were run with SPSS 14.0 software, and Noisy Time Domain were run with Matlab R 2010.
Data Analysis
The data analysis this research using FFT, the basis of characteristic frequency on a signal is transformation fourier. Fast Fourier Transform (FFT) is a algorithm to count discrette fourier transform instead (DFT). Functions of a general of transformation fourier is find components frequency signal that is hidden by a signal the domain time of with noise is:
S = fft (y) (8)
S = fft(y,n) (9)
There is complete the example of the sound spectrum that is processed using software Wavelab 6 used is the result of recording dolphin sounds of Indo-pacific bottlenose dolphins (Tursiops aduncus). Colour spectrum looks brighter is the signal or the noise from the center of dolphins. With a color bar that is shown by the brighter (high) is the source of the sound or voice centre. The high value of the linear intensity with bright colour produced on the noise spectrum of dolphins Dolphin. The top and bottom are the voice that comes together with one another, but results of the following view is a view that issued stereo.
42
Statistical analysis used in this study by using whistle sound data is by using Test F (simultaneously). Test F or regression test simultaneously is to determine the effect of dependent variables, whether significant or not. Test phase as follows:
Determining the null hypothesis (Ho) and alternative hypothesis (Ha) Ho: β1 = β2 = β3= 0
This means that the variables X1 and X2 simultaneously are not significantly different from the Y variable
Ha: β1 ≠ β 2 ≠ β 3 ≠ 0
This means that the variables X1 and X2 simultaneously differ significantly to the variable Y
F test is the test of the regression coefficient simultaneously. The test is performed to determine the effect of all independent variables, X1 is intensity (dB), X2 is time (ms), and Y is the Frequency contained in the model simultaneously to the dependent variable. F test in this research is used to test the significance of current ratio influence, debt ratio, total assets turn over, return on assets to fixed asset investment decisions simultaneously, the test formula is:
(10)
RESULTS
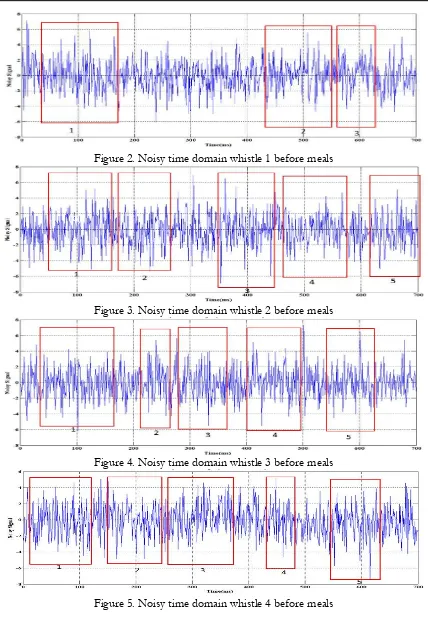
Sound of mamals (male bottle nose dolphin) to in this research is the noise that derived from dolphin out of the skull of dolphins, sound is a very important thing to behavior while communicating to several kinds of fish. Mammals can issue various amplitude votes for communicating in exchange information. Result from a voice too the impact of behavior such as at eating, move, escape the enemy, and reproduction (sexuality and phase enlargement). Figure 2,3,4 and 5 have the highest peak value which is located at 2 and whistles whistle sound 3 with a noisy value of 6.2 at 370 and 600 ms contained in the pattern- 3 and the pattern of all five whistle sound (Figure 2 and Figure 3). Results Noisy time domain has the same relationship with the original spectrum produced (Figure 1 and 2). The noisy lowest value in this is equal to -7.8 is at whistle sound 4 with time 620 ms on the 5th pattern (Figure 4)
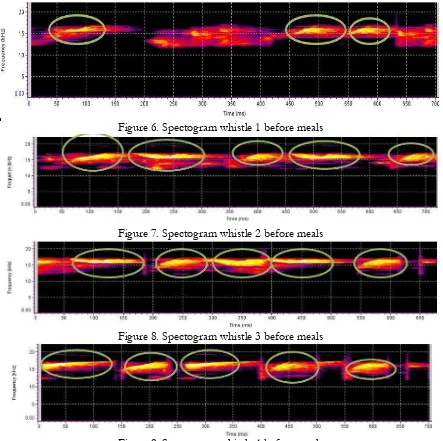
Figure 7 has 6 sound patterns that were at the time of 70-140 ms, ms 1190-260, 3900-440 ms, 460-560 ms, and 6600-720 ms. In Figure 8 have a sound pattern 5 which is located at 70-160 ms, 230-260 ms, 280-300 ms, 400-480 ms and 560-620 ms. In Figure 8 also has five sound patterns with a time that is 20-100 ms, 150-270 ms, 270-350 ms, 440-470 ms and 560-630 ms. Shape pattern is marked by a green circle, with a maximum time whistle sound original 1, 2, 3, 4 which is 700 ms.
43
Figure 2. Noisy time domain whistle 1 before meals
Figure 3. Noisy time domain whistle 2 before meals
Figure 4. Noisy time domain whistle 3 before meals
Figure 5. Noisy time domain whistle 4 before meals (b)
44
Figure 6. Spectogram whistle 1 before meals
Figure 7. Spectogram whistle 2 before meals
Figure 8. Spectogram whistle 3 before meals
Figure 9. Spectogram whistle 4 before meals
Table 1. F Test before meals in show captivity
No Time (ms) Whistle Sound before meals show captivity Whistle1 Whistle2 Whistle3 Whistle
4
1 100 with 200 * - - -
2 200 with 300 - - * -
3 300 with 400 * * - -
4 400 with 500 - - * *
5 500 with 600 - - * -
6 600 with 700 * * - *
-) No significant effect (Thank H0) (Fhit <Ftabel) *) Significant (Reject H0) (Fhit> Ftabel)
45
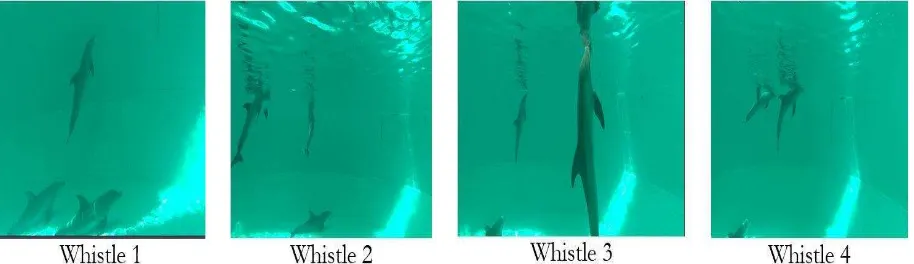
and 600 to 700 ms has a P value> 0.001. 4 whistle sound at 200 to 300 ms, 400 to 500, and 500 to 600 ms, have P> 0.001, while 100 to 200, 300 to 400, 600 to 700 ms has a value of P <0.001. F-test nothing in common (Heterogeneous) whistle 1 until 4 while the value of P> 0.001 contained on whistle sound 1, 2, and 3, while the sound of the whistle 4 p <0.001 at 300 with 400 to 700 ms and 600 ms. Behavior of dolphin showed by Figure 10.
Figure 10. Position of male dolphin bottlenose before meals in show captivity (whistle sound 1,2,3, and 4)
DISCUSSION
Power Spectral Density (PSD) function to equalize the number of rows and columns of data matrix m-file of the results of the voice recording process. Power spectral density is a useful concept to determine the optimum frequency band of the signal transmission system. PSD is a variation of power (energy) as a function of the frequency spectrum in the form of density estimated using FFT, PSD method is one of the modern spectral estimation technique proposed during this decade (López, 2011; Killebrew et al., 2001). Figure 1 obtained that there are four (4) whistles, the value of Power Spectral Density (PSD), which is found in the highest with 28.03 dB are shown in green colour on a whistle sound three at a time before meals in show captivity (indicated by black circles). The highest intensity values at an interval of 14 642 Hz frequency-16000, while the lowest value that is currently on a whistle 4 with a frequency of 9300 Hz with a value of Power Spectral Density (PSD) 21.97 dB are indicated by black lines. By looking at the pattern of spectral, whistle 3 has a sound frequency in the range of 14642-16000 Hz which is the highest compared to the intensity of the sound 1,2, and 4. The frequency range of peaks sounds 14642-16000 Hz in frequency (Figure 1). The behaviour of male bottle nose dolphin will greatly affect the high level of low voice, and on the habit of living during being in captivity, this can be explained and seen in Figure 10. So with this, it can be stated dolphins have a close relationship with the voice of his behaviour.
Average frequency in each pattern shown in the Figure is located at 15000-16000 Hz frequency range. From the results obtained can be identified as the whistle sounds emanating from dolphins by calculating or viewing range interval whistle sound itself (May-Collado & Wartzok, 2008). Highest intensity on a whistle 4 can also be affected by the position with the position of the dolphin is horizontal, because according to (Dudzinski et al., 2003; Warren-Smith & Dunn, 2006; Swift & Marzluff, 2015; Miksis et al., 2002). Movement in the vertical position will probably affect the magnitude of the sound and the inconsistency of the sound emitted by the dolphins using conservation methods energy obtained by dolphins and will require a lot of energy to expend greater voice intensity value.
CONCLUSIONS
46
time before meals with whistle 1,2,3, and 4. This can prove that there is a close relationship between the sounds produced by male bottle nose dolphin and the behaviour of dolphins during life in a row, and the position of dolphins in a show captivity more dominant and often in the bottom of the captivity, the position of the dolphins affects the frequency.
ACKNOWLEDGEMENTS
The study was financed by Safari Park, Cisarua Bogor, Indonesia. We would like to thank Dr. Ir. Totok Hestirianoto, M.Sc, Dr.Ir. Sri Pujiyati, M.Si, and Pratiwi Dwi Wulandari, S.Ik from Marine Science and Technology Department, Bogor Agricultural University, Indonesia.
REFERENCES
Caldwell, M. C., D. K. Caldwell. 1965. Individualized whistle contours in bottle-nosed dolphins (Tursiops truncatus). Nature, 207: 434-435.
Dudzinski, K. M., M. Sakai, K. Masaki, K. Kogi, T. Hishii, M. Kurimoto. 2003. Behavioral observations of bottlenose dolphins towards two dead conspecifics. Aquatic Mammals, 29(1): 108-116.
Janik, V. M., L.S. Sayigh. 2013. Communication in bottlenose dolphins: 50 years of signature whistle research. Journal of Comparative Physiology A, 199(6): 479-489.
Jensen, F.H., L.Bejder, M. Wahlberg, P.T. Madsen. 2009. Biosonar adjustments to target range of echolocating bottlenose dolphins (Tursiops sp.) in the wild. Journal of Experimental Biology, 212(8): 1078-1086.
Killebrew, D., E. Mercado, L. Herman, A. Pack. 2001. Sound production of a neonate bottlenose dolphin. Aquatic Mammals, 27(1): 34-44.
Kostenko, P.Y., V.I. Vasylyshyn. 2014. Signal processing correction in spectral analysis using the surrogate autocovariance observation functions obtained by the ATS-algorithm. Radioelectronics and Communications Systems, 57(6): 235-243.
López, B.D. 2011. Whistle characteristics in free-ranging bottlenose dolphins (Tursiops truncatus) in the Mediterranean Sea: Influence of behaviour. Mammalian Biology-Zeitschrift für Säugetierkunde, 76(2): 180-189.
Lubis, M. Z., P. D. Wulandari, T. Hestrianoto, 2017. Karakteristik bioakustik dan tingkah laku lumba-lumba jantan hidung botol (Tursiops aduncus). Jurnal Teknologi Perikanan dan Kelautan, 7(2): 179-190.
Lubis, M.Z. 2016a. Produksi suara dan tingkah laku lumba-lumba jantan hidung botol (Tursiops
Aduncus) dengan metode bioakustik. Jurnal Integrasi, 8(1): 42-49.
Lubis, M. Z. 2016b. Identifikasi karakteristik whistle dan tingkah laku lumba-lumba (Tursiops aduncus) di Taman Safari Indonesia, Cisarua Bogor. Tesis, Program Pascasarjana, Institut Pertanian Bogo,. Bogor.
Lubis, M. Z., W. Anurogo. 2016. Fish stock estimation in Sikka Regency Waters, Indonesia using Single Beam Echosounder (CruzPro fish finder PcFF-80) with hydroacoustic survey method. Aceh Journal of Animal Science, 1(2): 70-78.
Lubis, M. Z., P. D. Wulandari, S Pujiyati, T. Hestirianoto, K. Sultan, D. P. Mahdi, M. Mujahid, 2016. Spectral analysis using Haar wavelet (original signal, denoised signal, residual signal) and source level (SL) for whistle sound of dolphin (Tursiops aduncus) in captivity. Aceh Journal of Animal Science, 1(1): 29-38.
47
Lubis, M. Z. 2014. Bioakustik stridulatory gerak ikan guppy (Poecilia reticulata) saat proses aklimatisasi kadar garam. Skripsi, Institut Pertanian Bogor, Bogor.
May-Collado, L. J., D. Wartzok. 2008. A comparison of bottlenose dolphin whistles in the Atlantic Ocean: factors promoting whistle variation. Journal of Mammalogy, 89(5): 1229-1240.
McCowan, B., D. Reiss. 2001. The fallacy of ‘signature whistles’ in bottlenose dolphins: a comparative perspective of ‘signature information’in animal vocalizations. Animal Behaviour, 62(6): 1151-1162.
Miksis, J. L., P. L. Tyack, J. R. Buck. 2002. Captive dolphins, Tursiops truncatus, develop signature whistles that match acoustic features of human-made model sounds. The Journal of the Acoustical Society of America, 112(2): 728-739.
Norris, K. S., J. H. Prescott, P. V. Asa-Dorian, P. Perkins, 1961. An experimental demonstration of echolocation behaviour in the porpoirs, Tursiops truncatus (Montagu). Biological Bulletin, 120: 163–176.
Sayigh, L. S., H. C. Esch, R. S. Wells, V. M. Janik. 2007. Facts about signature whistles of bottlenose dolphins, Tursiops truncatus. Animal Behaviour, 74(6): 1631-1642.
Swift, K. N., J. M. Marzluff. 2015. Wild American crows gather around their dead to learn about danger. Animal Behaviour, 109, 187-197.
Warren-Smith, Á. B., W. L. Dunn. 2006. Epimeletic behaviour toward a seriously injured juvenile bottlenose dolphin (Tursiops sp.) in Port Phillip, Victoria, Australia. Aquatic Mammals, 32(3): 357.