12
Seasonal variation of fish species and genotoxic effects as a result of human
activities at the Ologe Lagoon, Nigeria
Simeon Oluwatoyin Ayoola*, Taiwo David Aina
Department of Marine Sciences, University of Lagos, Lagos State, Nigeria. *Corresponding author, email: [email protected],[email protected]
ABSTRACT
The fish abundance was determined by monitoring and recording the fish-catch data at the Otto Jetty in the Ologe lagoon. The diversity indices used for the purpose of this project were Species richness (S) and Shannon – Weiner index (H´). Three fish species from the lagoon were used for the micronucleus assay and nuclear aberrations; these are Tilapia guineensis, Sarotherodon melanoteron, and Chrysichthys nigrodigitatus. Diversity indices (H) obtained for the months of June, July, August and September were 2.61, 2.54, 2.54, 2.61 respectively while evenness (J) for the months were 0.64, 0.60, 0.53, 0.44 respectively. Apart from the presence of micronucleus, the genotoxicity assay also showed the presence of binucleated nucleus and blebbed nucleus. These are evidences that Ologe lagoon has a certain level of pollution, though in a minimal level. As advanced by this research work, there is great variation in fish composition and abundance in Ologe lagoon in relation to changes in the physical and chemical state of the water in the lagoon during the months of this research and this is very crucial to the biological life of the lagoon. However, anthropogenic activities should be regulated so as to prevent the level of pollution from increasing beyond tolerable limits.
Keywords:Fish Species, genotoxic, human Activities, Ologe Lagoon
INTRODUCTION
Ologe lagoon is characterized by several human activities such as sand mining, motorized boat operation, cattle rearing, and fishing, it also serves as receiving water for the wastes that are produced in a close-by market (Morogbo Market) as well as industrial effluents which are produced in the neighboring towns (Olukolajo and Oluwaseun, 2008). The lagoon also receives municipal effluents through drainage canals at Agbara Industrial Estate and wastes from an abattoir in Ijanikin. These activities and effluents lead to increased dissolved nutrients which may result in eutrophication, habitat destruction and alteration of species diversity and the addition of toxic substances which can have either acute or chronic effects on aquatic organisms (Don-Pedro et al., 2004).
In Lagos, Nigeria, there are many industries that discharge their effluents into the different water bodies around the metropolis. There are very few reports on genotoxicity of industrial effluents in Nigeria. Most reports concentrated on the genotoxicity evaluation of leachates from solid industrial/domestic wastes and landfills (Odeigah et al., 1995). The main anthropogenic pressure on the lagoon is from the adjacent Agbara industrial estate. According to Oyewo (1998), over 20 factories belonging to the food and beverages, pharmaceutical, breweries, metal finishing industries, chemical and pulp and paper companies presently occupy the industrial area. These untreated discharges coupled with domestic inputs from the Agbara residential estates and satellite communities cause significant levels of pollution (Clarke et al., 2003). The effluents of these industries are discharged in the lagoon all year round, with their immediate impacts on the ecology of the lagoon system. It is well established that pollution lowers the quality of life in various aspects and affects health and life span (Grover and Kaur, 1999). Apart from the fact that these pollutants have direct effects on the fishes that inhabit the lagoon, these fishes may also be unsafe
13
to consume. If consumed by humans, they may cause mutagenicity or toxicity and lead to several human afflictions like cancer, atherosclerosis, cardiovascular diseases and premature ageing (Grover and Kaur, 1999). As it was observed by Vos et al. (2004) that chemical variables like nitrate-nitrogen (NO3 - N) showed very strong relationships to site constant and temperature. One
of these factors includes the diurnal and seasonal variations in salinity level of the water usually caused by tidal effects and influx of inshore waters (Soldner and Stephen, 2004).
The assessment of genotoxic potential in aquatic environment is one of the main tasks of environmental monitoring to control pollution. The biomonitoring of genotoxicity in aquatic organisms is important for several reasons. First, from the ecological perspective, the protection of genetic diversity in natural populations is important for population survival, and avoiding contaminant-induced mutations that skew genetic diversity is desirable (Würgler and Kramers, 1992). Second, the detection of carcinogenic effects in aquatic organisms is needed to assess the health of aquatic organisms, as well as to prevent carcinogens from entering the food chain to humans (Uannoke et al., 1980). The Lagoon however, serves as a source of fisheries supply to Nigerians in spite of the level of pollution of the lagoon. Ologe lagoon is therefore of great importance not only to Lagos state and Nigeria, but to the entire West-African sub-region as ecological catastrophes occurring upstream, could have severe consequences downstream if unchecked.
Industrial effluents are a main source of direct and often continuous input of pollutants/toxicants into aquatic ecosystems with long-term implications on ecosystem functioning (Odeigah and Osanyipeju, 1995). Arabatizis and Kokkinakis (2005) observed that lagoon systems are places of great biological importance where fishery is the main economic activity but intensive agriculture, industry and tourism have degraded their sensitive environmental structure. Furthermore, it has been shown that exposure to industrial effluents can inhibit the reproduction of fish (Jaji et al., 2007). One of the problems affecting the health of aquatic organisms is the exposure of their aquatic environment to several hazards, which may be chemical, physical or biological contaminants. These hazards may induce genetic alterations and carcinogenesis in aquatic organisms (Abdel-Migid et al., 2007).
Fishes and other aquatic organisms in the lagoon live in this polluted water, these fishes may be unsuitable for consumption by human due to the polluted water in which they live. The frequency of micro-nucleated erythrocytes was determined from blood smears; there is therefore the need to analyze the genotoxicity effects on these industrial effluents on fish species that inhabit the lagoon. Due to the continued production and release of these hazards into the aquatic environment, the investigation of the genotoxic potential of aquatic environment has become a major task in the monitoring of environmental pollution (Bates et al., 2001). The analysis of environmental genotoxicity provides early warning signals of adverse long-term effects of the contamination (Bilger and Atkinson, 1997).The objectives of this study are to investigate the occurrence, abundance, distribution, as well as the diversity of the fish fauna in Ologe Lagoon, to determine the physico-chemical parameters and to investigate the results of micronucleus and nuclear abnormalities in the erythrocytes of three fish species from the Ologe Lagoon.
.
MATERIALS AND METHODS Description of the Study Site
14
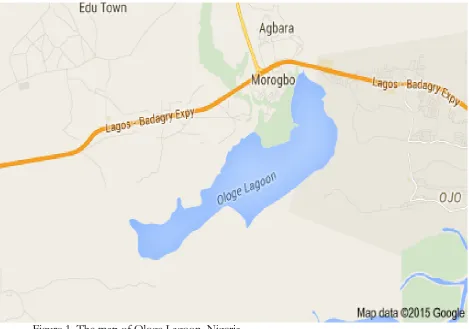
brought by the Northeast trade winds. The dry season usually heralds an increase in temperature and reduction in water levels. The water of Ologe lagoon at this period is very dilute with pH being neutral (Brown and Oyenekan, (1998). This may be due to low tidal influence since the lagoon is more inwardly situated. Ologe Lagoon is a freshwater lagoon situated in the south western part of Lagos state, Nigeria (Figure 1).
Figure 1. The map of Ologe Lagoon, Nigeria
Fish distribution and abundance
The sampling is done twice a month for four consecutive months (June through September). Different fish species were sampled from the study site using gill nets of length 6m and mesh size 9 inches, hook of size 2 inches and line as well as cast nets of mesh size 9 inches. The fish abundance was determined by monitoring and recording the fish-catch data at the Otto Jetty in the Ologe lagoon. The fish sample data were collected from the landing sites and from some of the local fishermen at the lagoon. The fish species caught were identified appropriately using FAO (1992), as well as Holden and Reed (1972). The total weight of the fish was taken using a pan balance (Salter Model), the weight was measured to the nearest gram. Also, the standard length of the fish was taken using a measuring board and the length was recorded to the nearest centimeter.
Determination of fish diversity
The diversity indices used were Species richness (S) and Shannon – Weiner index (H´). Species richness is the total number of different fish species obtained. It is expressed as follow:
15
Shannon – Weiner index (H´) on the other hand measures the order or disorder observed with a particular system. This order is characterized by the number of individuals observed for each species in the sample site (Simpson, 1949). It is expressed as:
Where; Pi = the number of given species divided by the total number of fishes observed, Ln = natural log, the formula for finding ‘evenness’ is: J' = H'/H´max
H´max = ln(S)
Experimental procedure Test organisms
Three fish species were used for this study. These are Tilapia guineensis, Sarotherodon melanoteron, and Chrysichthys nigrodigitatus. They were purchased from local fishermen on landing at the Otto jetty of the Ologe lagoon.
Procedure for micronucleus assay and nuclear aberrations
Blood from each fish species was smeared on four glass slides per species. The smears were prepared by the method of Das and Nanda (1986) with some modifications. Peripheral blood samples were obtained from the caudal vein of three fish species that had being caught from the lagoon. At each assessment, 1000 cells per fish species were analyzed. The genotoxicity assay was carried out on the three different fish species that were used for this study. These fish species are of great economic value. They serve as food and they are also of high commercial value. The blood of the fishes was extracted at the jetty with a syringe and stored in an already labeled EDTA (Ethylene diaminetetraacetic acid) bottle one after the other. The EDTA bottle prevents coagulation of the blood samples. The EDTA bottles containing blood samples were then taken to the marine sciences laboratory where they were being smeared on glass slides. The slides were left to dry in air for about twenty four hours, they were fixed in absolute methanol for 45 minutes and stained in Geimsa (10%, pH 7.0) for another 45minutes. The slides were left to dry and viewed under the microscope. Objective lens of x100 was used to examine the slides. Immersion Oil was applied on each slide before they were examined.
Statistical Analysis
Data were expressed as Mean ± Standard Deviation (SD). All statistical analyses were carried out using Microsoft Excel (2014) statistical packages.
RESULTS
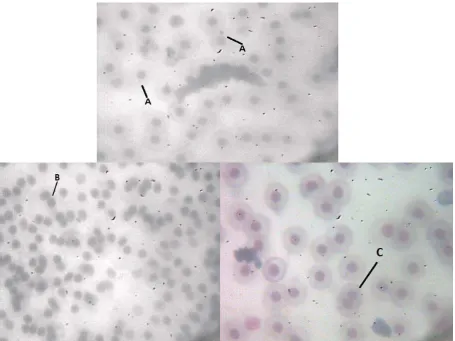
Fifteen families of twenty species were identified during these months. Fish species are more abundant in September. Chchlids contributed the highest number of fish in all month. Fish composition and abundance are presented in Table 1 while species biomass and length range are presented in Table 2. Diversity indices (H) obtained for the months of June, July, August and September were 2.61, 2.54, 2.54, 2.61 respectively while evenness (J) for the months were 0.64, 0.60, 0.53, 0.44 respectively. Tables 3 to Table 6 represent the results for diversity index and evenness. Micronucleus assay and nuclear aberrations that were observed in the three fish species are presented in Table 7 while their micrographs as observed under the microscope are presented in Figures 2 to Figure 4.
16
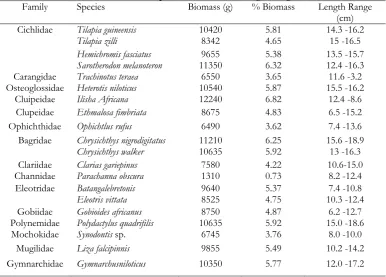
Table 1. Composition and abundance of fish species in the Ologe Lagoon from June to September 2015
Abundance Proportion
Family Species Biomass (g) % Biomass Length Range (cm) Cichlidae Tilapia guineensis 10420 5.81 14.3 -16.2
Tilapia zilli 8342 4.65 15 -16.5
Hemichromis fasciatus 9655 5.38 13.5 -15.7 Sarotherodon melanoteron 11350 6.32 12.4 -16.3 Carangidae Trachinotus teraea 6550 3.65 11.6 -3.2 Osteoglossidae Heterotis niloticus 10540 5.87 15.5 -16.2
Cluipeidae Ilisha Africana 12240 6.82 12.4 -8.6 Clupeidae Ethmalosa fimbriata 8675 4.83 6.5 -15.2 Ophichthidae Ophichtlus rufus 6490 3.62 7.4 -13.6 Bagridae Chrysichthys nigrodigitatus 11210 6.25 15.6 -18.9
Chrysichthys walker 10635 5.92 13 -16.3
Clariidae Clarias gariepinus 7580 4.22 10.6-15.0 Channidae Parachanna obscura 1310 0.73 8.2 -12.4 Eleotridae Batangalebretonis 9640 5.37 7.4 -10.8
Eleotris vittata 8525 4.75 10.3 -12.4
Gobiidae Gobioides africanus 8750 4.87 6.2 -12.7 Polynemidae Polydactylus quadrifilis 10635 5.92 15.0 -18.6
Mochokidae Synodontis sp. 6745 3.76 8.0 -10.0
17
Table 3. Shannon–Weiner index for the month of June 2015
Species Abundance Pi Ln(Pi) -1* Pi Ln(Pi)
Tilapia guineensis 3 0.050847 -2.97893 0.15147
Tilapia zillii 2 0.033898 -3.38439 0.11473
Hemichromis fasciatus 4 0.067797 -2.69124 0.18246 Sarotherodon melanoteron 5 0.084746 -2.4681 0.20916
Trachinotus teraea 0 0 0 0
Heterotis niloticus 8 0.142857 -1.94591 0.27799
Ilisha africana 0 0 0 0
Ethmalosa fimbriata 3 0.050847 -2.97893 0.15147
Ophichtlus rufus 0 0 0 0
Chrysichthys nigrodigitatus 2 0.033898 -3.38439 0.11473 Chrysichthys walkeri 2 0.033898 -3.38439 0.11473 Clarias gariepinus 3 0.050847 -2.97893 0.15147 Parachanna obscura 5 0.084746 -2.4681 0.20916 Batangale bretonis 3 0.050847 -2.97893 0.15147 Eleotris vittata 8 0.142857 -1.94591 0.27799 Gobioides africanus 4 0.067797 -2.69124 0.18246
Polydactylus quadrifilis 0 0 0 0
Synodontis sp. 5 0.084746 -2.4681 0.20916
Liza falcipinnis 0 0 0 0
Gymnarchusniloticus 2 0.033898 -3.38439 0.11473
Total 59 2.61316
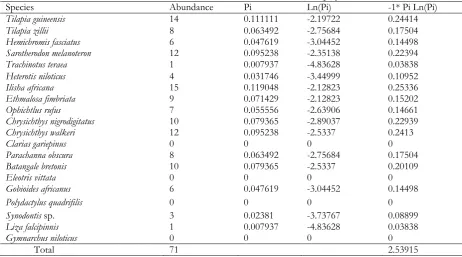
Table 4. Shannon–Weiner index for the month of July 2015
Species Abundance Pi Ln(Pi) -1* Pi Ln(Pi)
Tilapia guineensis 14 0.111111 -2.19722 0.24414
Tilapia zillii 8 0.063492 -2.75684 0.17504
Hemichromis fasciatus 6 0.047619 -3.04452 0.14498
Sarotherodon melanoteron 12 0.095238 -2.35138 0.22394
Trachinotus teraea 1 0.007937 -4.83628 0.03838
Heterotis niloticus 4 0.031746 -3.44999 0.10952
Ilisha africana 15 0.119048 -2.12823 0.25336
Ethmalosa fimbriata 9 0.071429 -2.12823 0.15202
Ophichtlus rufus 7 0.055556 -2.63906 0.14661
Chrysichthys nigrodigitatus 10 0.079365 -2.89037 0.22939
Chrysichthys walkeri 12 0.095238 -2.5337 0.2413
Clarias gariepinus 0 0 0 0
Parachanna obscura 8 0.063492 -2.75684 0.17504
Batangale bretonis 10 0.079365 -2.5337 0.20109
Eleotris vittata 0 0 0 0
Gobioides africanus 6 0.047619 -3.04452 0.14498
Polydactylus quadrifilis 0 0 0 0
Synodontis sp. 3 0.02381 -3.73767 0.08899
Liza falcipinnis 1 0.007937 -4.83628 0.03838
Gymnarchus niloticus 0 0 0 0
18
Table 5. Shannon–Weiner index for the month of August 2015
Species Abundance Pi ln(Pi) -1* Pi ln(Pi)
Tilapia guineensis 22 0.15493 -1.86478 0.28891
Tilapia zilli 11 0.077465 -2.55793 0.19815
Hemichromis fasciatus 9 0.06338 -2.7586 0.23744
Sarotherodon melanoteron 15 0.105634 -2.24778 0.23744
Trachinotus teraea 3 0.021127 -3.85721 0.08149
Heterotis niloticus 5 0.035211 -3.34639 0.08149
Ilisha africana 18 0.126761 -2.06546 0.26182
Ethmalosa fimbriata 14 0.098592 -2.31677 0.22841
Ophichtlus rufus 8 0.056338 -2.87639 0.16205
Chrysichthys nigrodigitatus 14 0.098592 -2.31677 0.22841
Chrysichthys walkeri 1 0.007042 -4.95583 0.0349
Clarias gariepinus 2 0.014085 -4.26268 0.06004
Parachanna obscura 2 0.014085 -4.26268 0.06004
Batangale bretonis 0 0 0 0
Eleotris vittata 9 0.06338 -2.7586 0.17484
Gobioides africanus 0 0 0 0
Polydactylus quadrifilis 0 0 0 0
Synodontis sp. 2 0.014085 -4.26268 0.06004
Liza falcipinnis 7 0.049296 -3.00992 0.14838
Gymnarchus niloticus 0 0 0 0
Total 142 2.54385
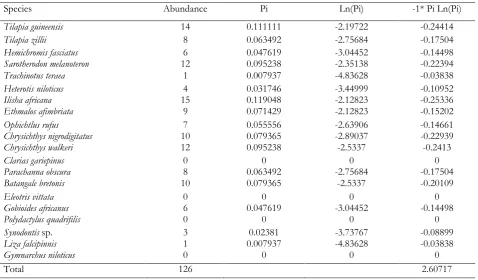
Table 6. Shannon–Weiner index for the month of September 2015
Species Abundance Pi Ln(Pi) -1* Pi Ln(Pi)
Tilapia guineensis 14 0.111111 -2.19722 -0.24414
Tilapia zillii 8 0.063492 -2.75684 -0.17504
Hemichromis fasciatus 6 0.047619 -3.04452 -0.14498
Sarotherodon melanoteron 12 0.095238 -2.35138 -0.22394
Trachinotus teraea 1 0.007937 -4.83628 -0.03838
Heterotis niloticus 4 0.031746 -3.44999 -0.10952
Ilisha africana 15 0.119048 -2.12823 -0.25336
Ethmalos afimbriata 9 0.071429 -2.12823 -0.15202
Ophichtlus rufus 7 0.055556 -2.63906 -0.14661
Chrysichthys nigrodigitatus 10 0.079365 -2.89037 -0.22939
Chrysichthys walkeri 12 0.095238 -2.5337 -0.2413
Clarias gariepinus 0 0 0 0
Parachanna obscura 8 0.063492 -2.75684 -0.17504
Batangale bretonis 10 0.079365 -2.5337 -0.20109
Eleotris vittata 0 0 0 0
Gobioides africanus 6 0.047619 -3.04452 -0.14498
Polydactylus quadrifilis 0 0 0 0
Synodontis sp. 3 0.02381 -3.73767 -0.08899
Liza falcipinnis 1 0.007937 -4.83628 -0.03838
Gymnarchus niloticus 0 0 0 0
19
Table 7. Micronucleus assay and nuclear abnormalities for the 3 fish species
MN BL BN NT LB
5.33±2.52 2.00±1.00 2.33±0.58 ˗ -
Note: MN= Micronucleus, LB=Lobed, BN= Binucleated, NT= Notched, BL= Blebbed.
Figure 2. The micrographs (a) Micronucleus (MN), (b) Blebbed (BL), (c) Binucleated (BN)
DISCUSSION
20
Emmanuel and Onyema (2007) also noted that the presence of fish species such as S. melanotheron, T. guineensis, H. fasciatus, E. vittata and B. lebretonis in a tidal creek denote their ability to adapt to harsh environments at the expense of species that are less influential.
A similar finding was obtained by Albaret and Lae (2003) that to inhabit brackish waters (Fagade and Olaniyan, 1974), T. guineensis thrive in fresh waters (Fagade and Olaniyan, 1972).Although Schneider, (1990) observed that E. lacerta inhabits shallow coastal waters and estuaries throughout the year, this species was not encountered during the period of this study. Soyinka and Kassem (2008) reported that C. senegalensis species were seen when the salinity of the lagoon was high, this was not the case during the course of this study. This may be due to the fact that the salinity of the lagoon was very low virtually throughout the months of carrying out this study. However, from the report of Fagade and Olaniyan (1974) on the fish fauna of Lagos Lagoon in which 72 species (34 families) and Soyinka and Kusemiju (2007) on the fish fauna of Badagry Lagoon in which 37 species (21 families) were caught, it can be easily deduced that there is greater species richness in the lagoons that have a more direct link with the sea than those further away from it. This is due to the greater exchange of individuals especially as nursery grounds. The Ologe Lagoon is further away from the sea than the Lagos and Badagry Lagoons. Furthermore, Emmanuel and Onyema (2007) reported 21 species of fish from 12 families in a tidal creek adjourning the Lagos Lagoon and attributed such a low fish diversity and abundance as a good indicator of a possibly stressed ecosystem.
From the results of the MN obtained above, Sarotherodon melanoteron showed the highest MN frequencies. The lowest MN frequencies were found in Tilapia guineensis. The results of this study confirmed the usefulness of the erythrocyte micronucleus as a powerful monitoring tool for detecting genotoxic agents in an aquatic environment. Although there are a very large number of genotoxicity assays, only a relatively small number have been used for field evaluation of domestic, agricultural and industrial effluents on aquatic ecosystems (Pacheco, 2005). Pacheco (2005) noted that only field studies based on the capture of wild specimens could provide a definite indication about the environmental state and the ichthyic population’s health. MN test in fish has the potential for detecting clastogenic substances in aqueous media. Since teleost erythrocytes are nucleated, MN has being scored in fish erythrocytes as a measure of clastogenic activity. Various studies showed that the peripheral erythrocytes of fish display a high incidence of MN after exposure to different pollutants under field and lab conditions (Osman and Harabawy, 2010).Using MN test, Wirzinger et al., (2007) detected a more pronounced relation between the amount of sewage and level of genotoxic damage in field-collected three-spined sticklebacks.
CONCLUSION
21
REFERENCES
Abdel-Migid, H.M., Azab, Y.A., Ibrahim, W.M. 2007. Use of plant genotoxicity bioassay for the evaluation of efficiency of algal bio filters in bioremediation of toxic industrial effluent, Ecotoxicology and Environmental Safety, 66: 57-64.
Abowei, J.F.N., Sikoki, F.D. 2005. Water pollution management and control. Double Trust Publications Company, Port Harcourt.
Ajao, E. A. 1989. The influence of domestic and industrial effluent on populations of sessile and benthic organisms’ in Lagos Lagoon. Ph.D. Thesis, University of Ibadan.
Ajao, E. A. 1990. The influence of domestic and industrial effluents on populations of sessile and benthic organisms in Lagos lagoon. Ph.D. Thesis, University of Ibadan, Nigeria.
Ajao E.A. 1996. Review of the State of Pollution of the Lagos Lagoon. NIOMR Tech. paper No 106. Albaret, J.J., Lae, R. 2003. Impact of fishing on fish assemblages in tropical lagoons, the example of the
Ebrie Lagoon, West Africa. Aquatic. Living Resoures, 16: 1-9.
Arabatzis G.D, Kokkinakis A.K 2005. Typology of the lagoons of Northern Greece According to their environmental characteristics and fisheries Production. ORIJ, 5(1): 114-118.
Bates, D.E., Fanning, K.A.,Walsh, J.J., 2001. Iron fertilization and the Trichodesmium response on the West Florida Shelf. Limnology Oceanography, 46: 1261-1277.
Bilger R.W., Atkinson M.J 1997. Effect of nutrient loading on mass transfer rates of a coraleef community. Limnology Oceanography, 49 (2): 279-289.
Brown, C.A., Oyenekan, J.A., 1998. Temporal variability in the structure of benthic macro fauna communities of the Lagos lagoon and harbor, Nigeria Pollution Archives Hydrobiology, 45:45-54. Clarke, A. L., Juggins, S., Conley, D.J. 2003. A 150-yearreconstruction of the history of coastal
eutrophication in Roskilde Fjord, Denmark. Marine Pollution Bulletin, 46: 1614–1617.
Das, R.K., Nanda, N.K. 1986. Induction of micronuclei in peripheral erythrocytes of fish heteropneustes fossils by mitomycin C and paper mill effluent. Mutation Resources, 175: 67.
Don-Pedro, K.N., Oyewo, E.O., Otitoloju, A.A. 2004. Trend of heavy metal concentrations in Lagos lagoon ecosystem, Nigeria. West African Journal of Applied Ecology, 5: 23-24.
Fagade, S.O., and Olaniyan, C.I.O 1974. Seasonal distribution of the fish fauna of the Lagos Lagoon: Bull. de. IFANSER. A., 36(1): 244-252.
Emmanuel, B.E., Onyema, I.C. 2007. The plankton and fishes of a tropical creek in Southwest Nigeria. Turkey Journal of Fisheries Aquatic Science, 7: 105-114.
Fagade, S.O, Olaniyan, C.I.O. 1974. Seasonal distribution of the fish fauna of the Lagos Lagoon. Bulletin De I’.I.F.A.N.T. Service Aquaculture 36(1): 244 -252.
Fagade S.O., Olaniyan, C.I.O 1972. The Biology of the West African shade Ethmalosa fimbricata (Bowditch) in the Lagos Lagoon. Nigeria Journal of Fish Biology, 4: 519 -534.
FAO. 1992. Guidelines for the promotion of Environmental Management of Coastal Agriculture Development. Fish Technical Paper. 328: 55-57.
Grover, I.S., Kaur, S. 1999. Genotoxicity of wastewater samples from sewage and industrial effluent detected by the Allium root anaphase aberration and micronucleus assays. Mutation Research, 426: 183 – 188.
Holden, M., Reed, W. 1972. West African freshwater fish. Willey-Inter Science, Sydney.
Horsfall, M., Spiff, A.I. 2001. Environmental pollution with biological, chemical and physical emphasis. Metro Print Ltd., Port Harcourt, Nigeria.
Jaji, M.O., Bamgbose, O., Odukoya, O.O., Arowolo, T.A. 2007. Water quality assessment of Ogun River, South West Nigeria. Environmental Monitoring and Assessment, 133(1-3):447-482.
Nwankwo, D. I. 2004. Studies on the environmental preferences of blue-green algae (Cyanophyta) in Nigeria coastal waters. Journal of Nigeria Environmental Society, 2 (1): 44-51.
Odeigah, P.G., Osanyinpeju, A.O. 1995.Genotoxic effects of two industrial effluents and ethyl methane sulfonate in Clarias lazera.ChemistryToxicology, 33 (6): 501-5.
22
Olaniyan C.I.O 1969. The seasonal Variations in the hydrography and total plankton of the Lagoons of SouthwestNigeria. Nigerian Journal of Science, 3(2 :) 101-119.
Olukolajo, S.O., Oluwaseun, K.A. 2008. Seasonal variation in the distribution and fish species diversity of a tropical Lagoon in south-west Nigeria. Journal of fish and Aquatic Science, 3(6): 375-383.
Onianwa, P.C., Ogunniyi, O.J., Ogunlowo, A.A. 1999. General physicochemical quality of drinking water in Ibadan, Nigeria, International. Journal of Environmental Education Information, 18(2): 143–154. Osman, A.G.M., Harabawy, A.S. 2010.Hematotoxic and genotoxic potential of Ultraviolet–A radiation on
the African catfish Clarias gariepinus (Burchell, 1822). Journal of Fisheries International,5 (3): 44-53. Oyewo E.O., Ajayi T.O., Dublin – Green G.O., Ajao E.A., Anosike L.F. 1999. Impact of pollution in
aquatic living resources in Africa. Proceedings of the 5th session of the Inter-African Committee Oceanography Sea and in land fisheries.
Oyewo E.O. 1998. Industrial sources and distribution of heavy metals in Lagos Lagoon and biological effect on estuarine animals. Ph.D. Thesis, University of Ibadan, Ibadan.
Pacheco, M. 2005. Biotransformation and DNA genotoxic biomarkers in mullet species (Liza sp.) from a contaminated coastal lagoon (Ria de Aveiro, and Portugal). Environmental Monitoring and Assessment, 107: 133-53.
Solarin, B.B.,Kusemiju, K. 2003. Fish shelters as fisheries enhancement techniques in the Lagos lagoon, Nigeria. Nigerian Journal of Fisherie,s 1: 57-61
Soldner, M., Stephen, I. 2004. Relationship between macro invertebrate fauna and environmental variables in small streams of the Dominican Republic. Water Resources, 38: 863-874.
Soyinka, O.O., Kassem, A.O. 2008. Seasonal variation in the distribution and fish species diversity of a tropical lagoon in south-west. Nigeria Journal of Fish and Aquatic Science,3 (6): 375-383.
Soyinka, O.O., Kusemiju, K. 2007. The growth pattern, food and feeding habits of young bonga, Ethmalosa fimbriata (Bowdich) from the Lagos and Lekki Lagoons, Nigeria. Nigerian Journal of Fisheries, 4: 1-8.
Uannoke R.L., Minshall G.W., Cummins K.W., Schell .J.R., Cushing C.E. 1980. The inner continuum. Canadian Journal of Fisheries and Aquatic Science, 37:130–137.
Vos, M., Kooi, B.W., DeAngelis, D.L. and Mooij, W.M. 2004. Inducible defenses and the paradox of enrichment. Oikos, 105: 471–480.
Vannote, R.L., Minshall, G.W., Cummings, K.W., Sedell. J.R., Cushing, C.E. 1980. The river continuum concept. Canadian Journal of Fisheries and Aquatic Sciences. 37: 130-137.
Wirzinger, G., Weltje, L., Gercken, J., Sordyl, H. 2007. Genotoxic damage in field-collected three- spined sticklebacks (Gasterosteu saculeatus L.): A suitable biomonitoring tool. Mutation Research, 628: 19-30.
Wooton, R.J. 1992. Fish ecology. Tertiary Level Biology Blackie, NewYork.
Wurgler, F.E., Kramers, P.G.N. 1992. Environment effects of genotoxins (ecogenotoxicology). Mutagenesis, 7: 321-341.