1
Additional information on calculating the emission factors of Indonesian electricity grids for the JCM project development
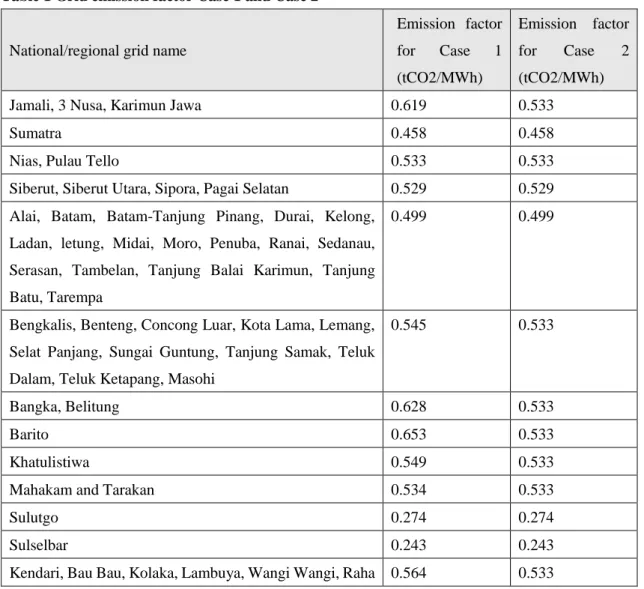
In order to secure net emission reductions in the methodology, the following emission factors will be applied depending on the regional grid to which a proposed project activity will connect in Indonesia: Table 1 summarizes the emission factors to be applied for renewable energy system(s) in a proposed project activity which is directly connected, or connected via an internal grid not connecting to either an isolated grid or a captive power generator, to a national/regional grid (Case 1).
Table 1 also summarizes the emission factors to be applied for renewable energy system(s) in a proposed project activity which is connected to an internal grid connecting to both a national/regional grid and an isolated grid and/or a captive power generator (Case 2).
Table 1 Grid emission factor Case 1 and Case 2
National/regional grid name
Emission factor for Case 1 (tCO2/MWh) Emission factor for Case 2 (tCO2/MWh)
Jamali, 3 Nusa, Karimun Jawa 0.619 0.533
Sumatra 0.458 0.458
Nias, Pulau Tello 0.533 0.533
Siberut, Siberut Utara, Sipora, Pagai Selatan 0.529 0.529
Alai, Batam, Batam-Tanjung Pinang, Durai, Kelong, Ladan, letung, Midai, Moro, Penuba, Ranai, Sedanau, Serasan, Tambelan, Tanjung Balai Karimun, Tanjung Batu, Tarempa
0.499 0.499
Bengkalis, Benteng, Concong Luar, Kota Lama, Lemang, Selat Panjang, Sungai Guntung, Tanjung Samak, Teluk Dalam, Teluk Ketapang, Masohi
0.545 0.533
Bangka, Belitung 0.628 0.533
Barito 0.653 0.533
Khatulistiwa 0.549 0.533
Mahakam and Tarakan 0.534 0.533
Sulutgo 0.274 0.274
Sulselbar 0.243 0.243
2
Ampana, Balantak, Bualemo, Bulungkobit, Bunta, Lelang, Lipulalong, Lumbi-lumbia, Luwuk, Palapas-Palu, Salakan, Toili, Toli-Toli, Wakai
0.515 0.515
Lombok, Bima, Sumbawa 0.568 0.533
Adonara, Alor, Ende, Maumere, Rote, Timor, Waingapu 0.537 0.533 Ambon, Buano, Bula, Dobo, Geser, Haruku, Kairatu,
Kesui, Kian Darat, Kisar, Kobisonta, Laimu, Larat, Liran, Mako, Moa, Ondor, Pasanea, Piru, Saumiaki, Serwaru, Taniwel, Tehoru, Tual, Wahai, Werinama, Wetar
0.557 0.533
Bere-Bere, Bicoli, Buli, Daruba, Ibu, Kedi, Lolobata, Maba, Ternate - Tidore, Tobelo
0.532 0.532
Biak, Genyem, Jayapura, Merauke, Nabire, Serui, Timika 0.491 0.491
Manokwari, Sorong 0.518 0.518
Bantal, Ipuh, Kota Bani, Mukomuko 0.532 0.532
An emission factor of 0.533 tCO2/MWh is applied, for renewable energy system (s) in a proposed project activity which is connected to an internal grid only connecting to an isolated grid and/or a captive power generator (Case 3).
3
Background information and emission factors calculation methods
1. Current status of electric power source mix in Indonesia
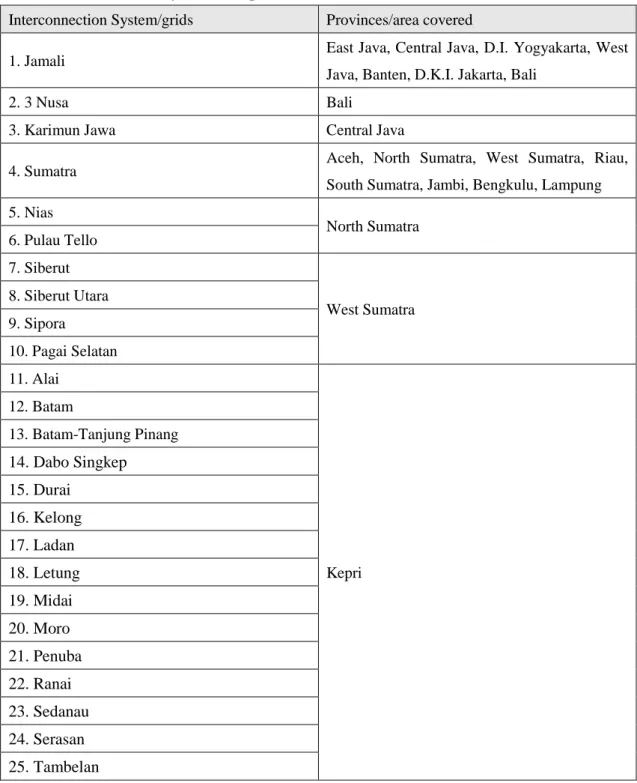
There are five major islands in Indonesia: Sumatra, Java, Kalimantan, Sulawesi, and Papua, and 134 electricity interconnection systems or grids which cover 34 provinces as shown in Table 2.
Table 2 Interconnection systems and provinces covered
Interconnection System/grids Provinces/area covered
1. Jamali East Java, Central Java, D.I. Yogyakarta, West
Java, Banten, D.K.I. Jakarta, Bali
2. 3 Nusa Bali
3. Karimun Jawa Central Java
4. Sumatra Aceh, North Sumatra, West Sumatra, Riau,
South Sumatra, Jambi, Bengkulu, Lampung 5. Nias North Sumatra 6. Pulau Tello 7. Siberut West Sumatra 8. Siberut Utara 9. Sipora 10. Pagai Selatan 11. Alai Kepri 12. Batam 13. Batam-Tanjung Pinang 14. Dabo Singkep 15. Durai 16. Kelong 17. Ladan 18. Letung 19. Midai 20. Moro 21. Penuba 22. Ranai 23. Sedanau 24. Serasan 25. Tambelan
4 26. Tanjung Balai Karimun
27. Tanjung Batu 28. Tarempa 29. Bengkalis Riau 30. Benteng 31. Concong Luar 32. Kota Lama 33. Lemang 34. Pulau Halang 35. Selat Panjang 36. Sungai Guntung 37. Tanjung Samak 38. Teluk Dalam 39. Teluk Ketapang 40. Tembilahan 41. Masohi* 42. Bangka Bangka Belitung 43. Belitung
44. Barito Kalselteng (South and Central Kalimantan)**
45. Khatulistiwa West Kalimantan
46. Mahakam East Kalimantan
47. Tarakan North Kalimantan
48. Sulselbar South and West Sulawesi
49. Sulutgo North Sulawesi and Gorontalo
50. Bau Bau Southeast Sulawesi 51. Kendari 52. Kolaka 53. Lambuya 54. Raha 55. Wangi Wangi 56. Ampana Central Sulawesi 57. Balantak 58. Bualemo 59. Bulungkobit 60. Bunta
5 61. Kotaraya 62. Lelang 63. Lipulalongo 64. Lumbi-lumbia 65. Luwuk 66. Palapas-Palu 67. Paposta 68. Salakan 69. Toili 70. Toli-Toli 71. Wakai 72. Lombok
West Nusa Tenggara 73. Bima
74. Sumbawa 75. Adonara
East Nusa Tenggara 76. Alor 77. Ende 78. Maumere 79. Rote 80. Timor 81. Waingapu 82. Ambon Maluku 83. Buano 84. Bula 85. Dobo 86. Geser 87. Haruku 88. Kairatu 89. Kesui 90. Kian Darat 91. Kisar 92. Kobisonta 93. Laimu 94. Larat 95. Liran
6 96. Mako 97. Moa 98. Namlea 99. Ondor 100. Pasanea 101. Piru 102. Pulau Buru 103. Saumiaki 104. Serwaru 105. Taniwel 106. Tehoru 107. Tual 108. Wahai 109. Werinama 110. Wetar 111. Bere-Bere North Maluku 112. Bicoli 113. Buli 114. Daruba 115. Ibu 116. Jailolo 117. Kedi 118. Lolobata 119. Maba 120. Tenate - Tidore 121. Tobelo 122. Biak Papua 123. Genyem 124. Jayapura 125. Merauke 126. Nabire 127. Serui 128. Timika 129. Manokwari West Papua 130. Sorong
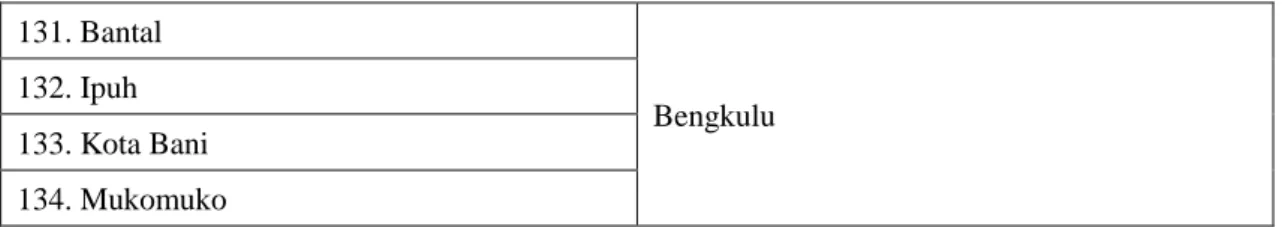
7 131. Bantal Bengkulu 132. Ipuh 133. Kota Bani 134. Mukomuko
* Masohi is in Riau and Maluku, but it is included in Riau, which has more conservative emission factor than Maluku.
** Kalselteng is considered as South and Central Kalimantan.
(Data source: Directorate General of Electricity, Ministry of Energy and Mineral Resources, Indonesia, 2020)
There are six types of primary energy used for electricity generation in Indonesia, namely, coal, oil and diesel, natural gas, hydro, geothermal, and solar power1. The share of electricity generated from 2016 to 2018 by each type of primary energy is shown in Table 3. The electricity generation from hydro, geothermal, and solar power plants are deemed as low cost/must run (LCMR) power sources.
Table 3 Electricity generation by primary energy type2 Electricity generation by primary energy type,
PLN only (TWh)
2016 2017 2018
Coal 91.70 105.78 114.40
Oil (HSD, IDO, MFO) and diesel 17.31 56.83 56.09
Natural gas 56.95 2.29 3.47
Hydro 13.89 12.43 10.73
Geothermal 3.96 4.10 4.01
Solar power 0.01 0.01 0.00
Total 183.81 181.42 188.70
*There is a difference between the values listed as “Total“ and the summation of each value of “Coal”, “Oil (HSD, IDO, MFO) and diesel”, “Natural gas”, “Hydro”, “Geothermal” and “Solar power” because these values are rounded.
**Electricity generation represents a net amount which is the amount of electricity generated by a power plant that is transmitted and distributed for consumer use.
When the share of LCMR is less than 50% of the total grid generation, the operation of LCMR
1 Directorate General of Electricity, Ministry of Energy and Mineral Resources Indonesia (2015) The Book of Electricity Statistics Number 28-2015.
2
Directorate General of Electricity, Ministry of Energy and Mineral Resources Indonesia (2019) The Book of Electricity Statistics Number 32-2019.
8
resources would not be affected by a newly installed power plant including a hydro power project3. Therefore, only electricity from gas-fired, coal-fired, oil and diesel-fired power plants are taken into account for calculating the official regional grid emission factor in Indonesia. Based on this assumption, the Government of Indonesia published emissions factor of each regional grid (Appendix 2).
2. Calculation of emission factors of the national/regional grids
In order to identify the emission factors of the Indonesian regional electricity systems which can secure net emission reductions, the emission factors in this methodology are established by an operating margin that is calculated using emission factors of power plants including LCMR resources. In calculating the emission factors of each fossil fuel power generation, the best heat efficiencies among currently operational plants in Indonesia are applied.
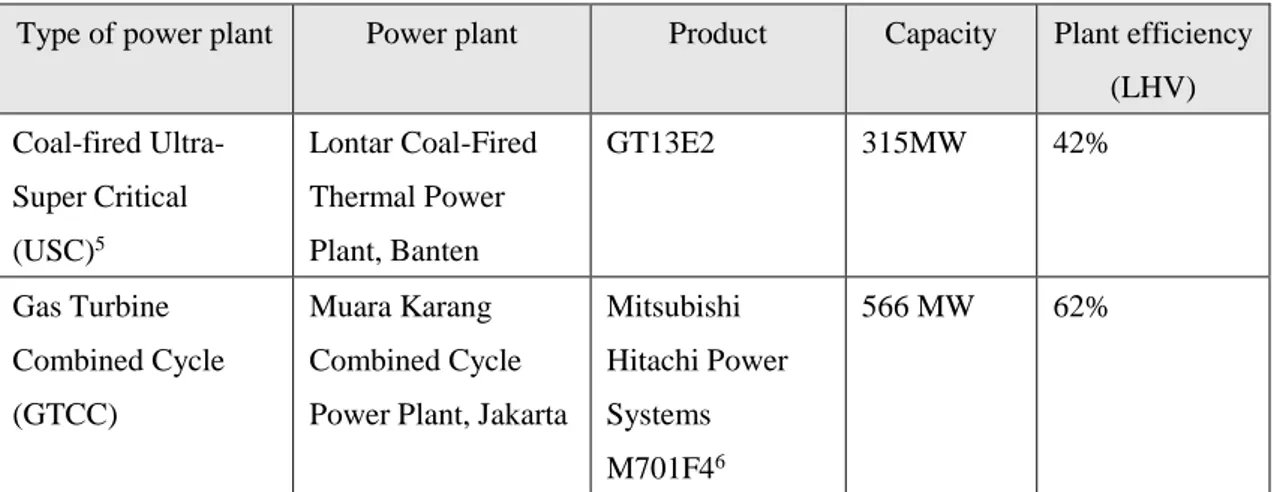
The most efficient coal-fired power plants and gas-fired power plants currently operational in Indonesia are identified in Table 4 and the best heat efficiencies are determined as 42% and 62%, respectively. With regard to diesel-fired power plants, the heat efficiency of 49%, an efficiency level which has not been achieved yet by the world’s leading diesel generator, is applied due to the data limitation4.
Table 4 Best efficiency of fossil fuel power plants in Indonesia
Type of power plant Power plant Product Capacity Plant efficiency
(LHV) Coal-fired Ultra-Super Critical (USC)5 Lontar Coal-Fired Thermal Power Plant, Banten GT13E2 315MW 42% Gas Turbine Combined Cycle (GTCC) Muara Karang Combined Cycle Power Plant, Jakarta
Mitsubishi Hitachi Power Systems M701F46 566 MW 62% 3
CDM EB (2015) Tool to calculate the emission factor for an electricity system.
4 The approved JCM methodologies (e.g. BD_AM002, CR_AM001, KE_AM002, KH_AM002, MN_AM003, PW_AM001 and MV_AM001, VN_AM007) also applied this value.
5 https://www.toshiba.co.jp/tech/review/2008/09/63_09pdf/a03.pdf 6 https://www.mhps.com/jp/products/gasturbines/lineup/m701f/
9
The emission factor of power generation by each fuel source is calculated from the plant efficiency using the following equation:
Emission factor of fossil fuel power plant [tCO2/MWh]
= (Emission factor of fuel source [kgCO2/TJ]*10-3*0.0036[TJ/MWh] / (Plant heat efficiency (LHV) [%]/100)
Applying the emission factors of coal, gas and diesel combustion, which are 92,800 kgCO2/TJ, 54,300 kgCO2/TJ and 72,600 kgCO2/TJ, respectively, derived from “2006 IPCC Guidelines for National Greenhouse Gas Inventories, Chapter 2, stationary combustion”, together with the plant efficiency (LHV) of 42% for the coal-fired power plant, 62% for the gas-fired power plant and 49% for diesel-fired power plant, and using conversion factors (10-3 for conversion from kgCO2 to tCO2 and 0.0036 for conversion from TJ to MWh), the conservative emission factors are calculated at 0.795 tCO2/MWh for coal-fired power plants, 0.315 tCO2/MWh for gas-fired power plants and 0.533 tCO2/MWh for diesel-fired power plants.
Using the data of electricity generation including LCMR resources (Appendix 1) and the
conservative emission factors of each power source, operating margins of each national/regional grid are obtained, as follows:
ܧܨ
ோா,=
∑ ܧܩ,
∑ ܧܩ,
× ܧܨ
Where:
EFRE,j = The reference emission factor of regional grid j [tCO2/MWh] EFi = Conservative emission factor of power plant type i [tCO2/MWh]
EGi,j = Electricity generated and delivered to the regional grid from power plant type i including LCMR resources in grid j during 2016-2018 [MWh]
As a result, the emission factor of each national/regional grid is calculated and shown in column “Emission factor for Case1 (tCO2/MWh)” of Table 1, to be applied for renewable energy system(s) in a proposed project activity which is directly connected, or connected via an internal grid not connecting to either an isolated grid or a captive power generator, to a national/regional grid. For most national/regional grids, those values are lower than the 2017 emission factors of the respective national/regional grids published by the Government of Indonesia (Appendix 2). Therefore, net emission reductions will be ensured by applying the emission factors determined above. For some national/regional girds (Dabo Singkep, Pulau Halang, Tembilahan, Kotaraya, Paposta, Namlea, Pulau
10
Buru, Jailolo), the values obtained as a result of calculation are higher than the 2017 emission factors of the respective national/regional grids published by the Government of Indonesia (Appendix 2). In order to secure net emission reductions, those national/regional grids are excluded from “Table 1 Grid emission factor Case 1 and Case 2”, and this additional information is not applicable for those grids.
3. Calculation of the emission factor of a captive power generator
To determine the emission factor of a captive power generator, which normally uses a diesel generator, in a conservative and simple manner, the heat efficiency of 49%, an efficiency level which has not been achieved yet by the world’s leading diesel generator, is applied.
The emission factor of diesel power generation is calculated from the heat efficiency using the following equation:
Emission factor of diesel power plant [tCO2/MWh]
= (CO2 emission factor of diesel oil [kgCO2/TJ]*10-3*0.0036[TJ/MWh] / (Plant heat efficiency (LHV) [%]/100)
Applying the default value of the emission factor of diesel combustion which is 72,600 kgCO2/TJ derived from “2006 IPCC Guidelines for National Greenhouse Gas Inventories, Chapter 2, stationary combustion”, together with the heat efficiency of 49%, the emission factor of an isolated grid and/or captive power generator is calculated at 0.533 tCO2/MWh.
4. Selection of the calculated emission factors
In case the renewable energy system(s) in a proposed project activity is directly connected, or connected via an internal grid not connecting to either an isolated grid or a captive power generator, to a national/regional grid (Case 1), the value of operating margin including LCMR resources, using the best heat efficiency among currently operational plants in Indonesia in calculating emission factors of fossil fuel power plants, are applied. The emission factors to be applied are shown in column “Emission factor for Case 1 (tCO2/MWh)” of Table 1.
In case that the renewable energy system(s) in a proposed project activity is connected to an internal grid connecting to both a national/regional grid and an isolated grid and/or a captive power generator (Case 2), the lower values between “Emission factor for Case 1 (tCO2/MWh)” of Table 1 and the conservative emission factor of diesel-fired power plant of 0.533 tCO2/MWh are applied. The emission factors to be applied are shown in column “Emission factor for Case 2 (tCO2/MWh)” of Table 1.
11
In case that the renewable energy system(s) in a proposed project activity is only connected to an internal grid connecting to an isolated grid and/or a captive power generator (Case 3), the emission factor of 0.533 tCO2/MWh is applied.
12
Appendix I Electric power source mix of each regional grid
81 94 96 0 34 2 45 1 39 9 7 6 50 100 150 200 2016 2017 2018
Electricity generation in Jamali grid, by typeof fuel used (TWh)
Coal Oil and diesel Natural gas Hydro Geothermal
Coal 64% Oil and diesel 9% Natural gas 20% Hydro 5% Geothermal 2%
Share of electricity generation during 2016-2018 in Jamali grid
7.57 7.10 7.98 4.08 12.33 2.11 10.66 0.72 9.84 3.44 3.53 3.82 5.00 10.00 15.00 20.00 25.00 30.00 2016 2017 2018
Electricity generation in Sumatra grid, by type of fuel used (TWh)
Coal Oil and diesel Natural gas Hydro Geothermal
Coal, 30.0% Oil and diesel, 24.5% Natural gas, 28.1% Hydro, 14.3% Geothermal, 3.0%
Share of electricity generation during 2016-2018 in Sumatra grid
- -0.12 0.14 0.15
-
-- 0.10 0.20 2016 2017 2018Electricity generation in Nilas and Pulau Tello grids, by type of fuel used
(TWh)
Coal Oil and diesel Natural gas Hydro Geothermal
Oil and diesel, 100.0%
Share of electricity generation during 2016-2018 in Nilas and Pulau
13
-
-
-0.11 0.08 0.02 0.02 0.04 0.06 0.08 0.10 0.12 2016 2017 2018Electricity generation in Pagai Selatan, Siberut, Siberut Utara, and Sipora grids,
by type of fuel used (TWh)
Coal Oil and diesel Natural gas Hydro Geothermal
Oil and diesel, 99.1% Hydro,
0.9%
Share of electricity generation during 2016-2018 in Pagai Selatan,
Siberut, Siberut Utara, and Sipora grids 0.84 - -0.13 0.15 0.00 0.72 0.15 0.53
--
1.00 2.00 2016 2017 2018Electricity generation in Alai, Batam, Batam-Tanjung Pinang, Durai, Kelong, Ladan, letung, Midai, Moro, Penuba, Ranai, Sedanau, Serasan, Tambelan, Tanjung Balai Karimun, Tanjung Batu,
and Tarempa grids, by type of fuel used (TWh)
Coal Oil and diesel Natural gas
Hydro Geothermal Oil and diesel, 18.0% Natural gas, 82.0%
Share of electricity generation during 2016-2018 in Alai, Batam, Batam-Tanjung
Pinang, Durai, Kelong, Ladan, letung, Midai, Moro, Penuba, Ranai, Sedanau, Serasan, Tambelan, Tanjung Balai Karimun, Tanjung Batu,
and Tarempa grids
0.14 0.13 0.20 1.10 1.10 0.86 0.13 -0.23 -- 0.50 1.00 1.50 2016 2017 2018
Electricity generation in Bengkalis, Benteng, Concong Luar, Kota Lama, Lemang, Selat Panjang,
Sungai Guntung, Tanjung Samak, Teluk Dalam, Teluk Ketapang, and Masohi grids, by type of fuel
used (TWh)
Coal Oil and diesel Natural gas Hydro Geothermal Coal, 13.1% Oil and diesel, 77.9% Natural gas, 9.0%
Share of electricity generation during 2016-2018 in Bengkalis, Benteng, Concong Luar, Kota Lama, Lemang, Selat Panjang, Sungai Guntung, Tanjung Samak, Teluk Dalam, Teluk Ketapang, and Masohi grids
14 0.33 0.29 0.45 0.67 0.67 0.51
-
-
-0.01 - 0.20 0.40 0.60 0.80 1.00 1.20 2016 2017 2018
Electricity generation in Bangka and Belitung grids, by type of fuel used
(TWh)
Coal Oil and diesel Natural gas Hydro Geothermal Coal, 38.4% Oil and diesel, 61.6%
Share of electricity generation during 2016-2018 in Bangka and
Belitung grids 1.77 2.12 0.54 1.27 1.30 0.53 - 0.01 0.19 0.15 0.15 1.00 2.00 3.00 4.00 2016 2017 2018
Electricity generation in Barito grid, by type of fuel used (TWh)
Coal Oil and diesel Natural gas
Hydro Geothermal Coal, 55.0% Oil and diesel, 37.9% Natural gas, 4.0% Hydro, 3.1% Share of electricity generation during 2016-2018 in Barito grid
0.07 0.16 0.04 1.73 1.33 0.71 -0.01 0.50 1.00 1.50 2.00 2016 2017 2018
Electricity generation in Khatulistiwa grid, by type of fuel used (TWh)
Coal Oil and diesel Natural gas Hydro Geothermal Coal 9% Oil and diesel 91%
Share of electricity generation during 2016-2018 in Khatulistiwa grid
15 -0.39 0.15 1.05 1.18 0.52 0.25 0.11 0.27 0.50 1.00 1.50 2.00 2016 2017 2018
Electricity generation in Mahakam and Tarakan grids, by type of fuel used
(TWh)
Coal Oil and diesel Natural gas
Hydro Geothermal Coal, 20.6% Oil and diesel, 64.8% Natural gas, 14.6%
Share of electricity generation during 2016-2018 in Mahakam and
Tarakan grids - 0.23 0.07 0.59 0.16 0.18 -0.09 -0.20 0.27 0.07 0.20 0.40 0.60 0.80 1.00 1.20 1.40 2016 2017 2018
Electricity generation in Sulutgo grid, by type of fuel used (TWh)
Coal Oil and diesel Natural gas
Hydro Geothermal Coal, 18.7% Oil and diesel, 20.6% Natural gas, 5.4% Hydro, 20.5% Geother mal, 34.7%
Share of electricity generation during 2016-2018 in Sumatera grid
-0.42 0.26 0.23 0.29 0.08 0.47 0.01 0.10 1.11 1.05 0.29 0.50 1.00 1.50 2.00 2016 2017 2018
Electricity generation in Sulselbar grid, by type of fuel used (TWh)
Coal Oil and diesel Natural gas Hydro Geothermal Coal, 27.5% Oil and diesel, 14.6% Natural gas, 4.4% Hydro, 53.4%
Share of electricity generation during 2016-2018 in Sulselbar grid
16 0.14 0.15 0.03 0.74 0.66 0.27
-
0.05
-0.01 0.01 0.00 0.20 0.40 0.60 0.80 1.00 2016 2017 2018Electricity generation in Kendari, Bau Bau, Kolaka, Lambuya, Wangi Wangi,
and Raha grids, by type of fuel used (TWh)
Coal Oil and diesel Natural gas
Hydro Geothermal Coal, 15.7% Oil and diesel, 79.1% Natural gas, 4.5% Hydro, 0.7%
Share of electricity generation during 2016-2018 in Kendari, Bau Bau, Kolaka, Lambuya, Wangi Wangi,
and Raha grids
- 0.03 -0.50 0.35 0.40
--
-0.03 0.02 0.02 0.20 0.40 0.60 2016 2017 2018Electricity generation in Ampana, Balantak, Bualemo, Bulungkobit, Bunta,
Kotaraya, Lelang, Lipulalongo, Lumbi-lumbia, Luwuk, Palapas-Palu, Paposta, Salakan, Toili, Toli-Toli, and Wakai
grids, by type of fuel used (TWh)
Coal Oil and diesel Natural gas
Hydro Geothermal Coal, 3.9% Oil and diesel, 91.8% Hydro, 4.3%
Share of electricity generation during 2016-2018 in Ampana, Balantak, Bualemo, Bulungkobit, Bunta, Kotaraya, Lelang, Lipulalongo,
Lumbi-lumbia, Luwuk, Palapas-Palu, Paposta, Salakan, Toili, Toli-Toli, and
Wakai grids, 0.25 0.16 0.27 1.48 1.35 1.20
--
-0.01 0.01 0.01 0.50 1.00 1.50 2.00 2016 2017 2018Electricity generation in Lombok, Bima, and Sumbawa grids, by type of fuel used
(TWh)
Coal Oil and diesel Natural gas
Hydro Geothermal Coal, 14.3% Oil and diesel, 85.2% Hydro, 0.5%
Share of electricity generation during 2016-2018 in Lombok, Bima,
17 0.09 0.14 0.14 0.77 0.44 0.44
--
-0.02 0.01 0.01 0.50 1.00 2016 2017 2018Electricity generation in Adonara, Alor, Ende, Maumere, Rote, Timor, and Waingapu grids, by type of fuel used
(TWh)
Coal Oil and diesel Natural gas
Hydro Geothermal Coal, 22.1% Oil and diesel, 68.9% Hydro, 2.0% Geotherm al, 6.9% Solar, 0.1%
Share of electricity generation during 2016-2018 in Adonara, Alor,
Ende, Maumere, Rote, Timor, and Waingapu grids 0.03 0.07 0.09 0.84 0.54 0.53 0.50 1.00 2016 2017 2018
Electricity generation in Ambon, Buano, Bula, Dobo, Geser, Haruku,
Kairatu, Kesui, Kian Darat, Kisar, Kobisonta, Laimu, Larat, Liran, Mako,
Moa, Ondor, Pasanea, Piru, Saumiaki, Serwaru, Taniwel, Tehoru, Tual, Wahai, Werinama, and Wetar grids, by
type of f
Coal Oil and diesel Natural gas
Hydro Geothermal Coal, 13.1% Oil and diesel, 86.8%
Share of electricity generation during 2016-2018 in Ambon, Buano, Bula, Dobo, Geser, Haruku, Kairatu, Kesui, Kian Darat, Kisar, Kobisonta, Laimu, Larat, Liran, Mako, Moa,
Ondor, Pasanea, Piru, Saumiaki, Serwaru, Taniwel, Tehoru, Tual,
Wahai, Werinama, and
0.18 0.24 0.23 0.05 0.10 0.15 0.20 0.25 2016 2017 2018
Electricity generation in Bere-Bere, Bicoli, Buli, Daruba, Ibu, Kedi, Lolobata,
Maba, Ternate - Tidore, and Tobelo grids, by type of fuel used (TWh)
Coal Oil and diesel Natural gas
Hydro Geothermal Oil and diesel, 99.8% Solar, 0.2%
Share of electricity generation during 2016-2018 in Bere-Bere,
Bicoli, Buli, Daruba, Ibu, Kedi, Lolobata, Maba, Ternate - Tidore,
18
(Data source: Directorate General of Electricity, Ministry of Energy and Mineral Resources, 2019)
- 0.02 -0.86 0.66 1.00
-0.10 0.06 0.07 0.50 1.00 1.50 2016 2017 2018Electricity generation in Biak, Genyem, Jayapura, Merauke, Nabire, Serui, and
Timika grids, by type of fuel used (TWh)
Coal Oil and diesel Natural gas
Hydro Geothermal Coal, 1.2% Oil and diesel, 91.5% Hydro, 7.4%
Share of electricity generation during 2016-2018 in Biak, Genyem, Jayapura, Merauke, Nabire, Serui, and
Timika grids - 0.02 -0.29 0.51 0.15
-0.01 0.02 0.00 0.10 0.20 0.30 0.40 0.50 0.60 2016 2017 2018Electricity generation in Manokwari and Sorong grids, by type of fuel used (TWh)
Coal Oil and diesel Natural gas
Hydro Geothermal Coal, 2.6% Oil and diesel, 93.6% Hydro, 3.7% Solar, 0.2%
Share of electricity generation during 2016-2018 in Manokwari and Sorong
grids 0.08 0.08 0.08
-
-
0.02 0.04 0.06 0.08 0.10 2016 2017 2018Electricity generation in Bantal, Ipuh, Kota Bani, and Mukomuko grids, by type of fuel used (TWh)
Coal Oil and diesel Natural gas
Hydro Geothermal Oil and diesel, 99.6% Hydro, 0.4% Share of electricity generation during 2016-2018 in Bantal, Ipuh,
19
Appendix 2 Emission factors of grids published by the Government of Indonesia (2017)
No. Interconnection of Electric Power Systems
Emission Factor (tCO2/MWh) No. Interconnection of Electric Power Systems Emission Factor (tCO2/MWh)
1 3 Nusa N/A 26 Bunta 0,72
2 Adonara N/A 27 Concong Luar
(Riau)
0,64
3 Alai (Kepri) 0,53 28 Dabo Singkep
(Kepri)
0,07
4 Alor 0,78 29 Daruba (Morotai) 0,82
5 Ambon 0,66 30 Dobo 0,72
6 Ampana N/A 31 Durai 0,53
7 Balantak 0,77 32 Ende 2,02
8 Bangka 1,27 33 Genyem 0,82
9 Bantal N/A 34 Geser 0,78
10 Barito 0,95 35 Haruku N/A
11 Batam 0,62 36 Ibu 0,76
12 Batam-Tanjung Pinang 1,13 37 Ipuh 0,74
13 Bau-Bau 0,71 38 Jailolo 0,43
14 Belitung 1,77 39 Jamali 0.89
15 Bengkalis (Riau) 0,70 40 Jayapura 0,73
16 Benteng (Riau) N/A 41 Kairatu N/A
17 Bere-Bere (Morotai) N/A 42 Karimun Jawa N/A
18 Biak 0,70 43 Kedi 0,87 19 Bicoli (Halmahera Timur) N/A 44 Kelong 0,61 20 Bima 0,86 45 Kendari 1,67 21 Bualemo 0,67 46 Kesui 1,01
22 Buano (Seram Barat) 0,76 47 Khatulistiwa 0,90
23 Bula (Seram Timur) N/A 48 Kian Darat 0,69
24 Buli (Halmahera Timur)
0,78 49 Kisar 0,98
20 No. Interconnection of
Electric Power Systems
Emission Factor (tCO2/MWh) No. Interconnection of Electric Power Systems Emission Factor (tCO2/MWh)
51 Kolaka 0,73 78 Mukomuko N/A
52 Kota Bani 0,74 79 Nabire 0,70
53 Kota Lama 0,57 80 Namlea 0,49
54 Kotaraya 0,51 81 Nias 0,77
55 Ladan 0,77 82 Ondor (Seram
Utara)
0,79
56 Laimu 0,82 83 Pagai Selatan 0,86
57 Lambuya N/A 84 Palapas-Palu 0,55
58 Larat 0,76 85 Paposta 0,38
59 Lelang 0,57 86 Pasanea (Seram
Utara Barat)
N/A
60 Lemang (Riau) 0,78 87 Penuba (Kepri) N/A
61 Letung 0,81 88 Piru (Seram Barat) N/A
62 Lipulalongo 0,86 89 Pulau Buru 0,39
63 Liran N/A 90 Pulau Halang (Riau) 0,51
64 Lolobata (Halmahera TImur)
N/A 91 Pulau Tello 0,62
65 Lombok 0,66 92 Raha 0,77 66 Lumbi-lumbia 0,82 93 Ranai 0,70 67 Luwuk 0,58 94 Rote 0,80 68 Maba (Halmahera Timur) 0,81 95 Salakan N/A 69 Mahakam 1,08 96 Saumlaki 0,71
70 Mako (Buru) N/A 97 Sedanau 0,80
71 Manokwari 0,70 98 Selat Panjang (Riau) 0,68
72 Masohi (Maluku Tengah) N/A 99 Serasan 0,76 73 Maumere 0,72 100 Serui 0,73 74 Merauke 0,71 101 Serwaru 1,01 75 Midai 0,79 102 Siberut 0,94
76 Moa 0,83 103 Siberut Utara 0,96
21 No. Interconnection of
Electric Power Systems
Emission Factor (tCO2/MWh) 105 Sorong 0,69 106 Sulselbar 0.87 107 Sulutgo 1.49 108 Sumatera 0.89 109 Sumbawa 0,69
110 Sungai Guntung (Riau) 0,59
111 Tambelan (Kepri) N/A
112 Taniwel (Seram Barat) 0,66 113 Tanjung Balai Karimun 1,13
114 Tanjung Batu 0,55
115 Tanjung Samak (Riau) 0,76
116 Tarakan 0,69
117 Tarempa 0,77
118 Tehoru (Seram Selatan) 0,79
119 Teluk Dalam (Riau) N/A
120 Teluk Ketapang (Riau) 0,67
121 Tembilahan (Riau) 0,52 122 Ternate - Tidore 1,24 123 Timika 0,69 124 Timor 0,68 125 Tobelo 0,63 126 Toili 0,60 127 Toli-Toli 0,76 128 Tual 0,58
129 Wahai (Seram Utara) 0,81
130 Waingapu 0,70 131 Wakai 0,70 132 Wangi-Wangi 0,86 133 Werinama (Seram Timur) 0,83 134 Wetar N/A
(Data source: Directorate General of Electricity, Ministry of Energy and Mineral Resources, Indonesia, 2020)