Full Length Research Paper
Early warning system modeling for food security
campaign in Bali, Indonesia
*I Nyoman Gede Ustriyana
1, Made Antara
2, D.P. Darmawan
2, and IGAA.
Ambarawati
21
Doctorate Program on Agricultural Science, School of Postgraduate Udayana University. 2
Dept. of Agribusiness Faculty of Agriculture, Udayana University, Bali, Indonesia
*Corresponding author email: [email protected]
ABSTRACT
Food stock sufficiency in the future is influenced by some factors related to the rice stock and demand, either individually or as a result of interaction within the factors. This study aims to formulate the early warning method of food security in Bali Province, as guidance for the local government to make any regulations. The method applied is dynamic system, using Powersim software. The dynamic system consists of two subsystems or sub models; population subsystem and production subsystem. The interaction between subsystems is visualized by the cause-effect diagram. The early detection method leads to two important issues. Firstly, the system or model is able to visualize the stated rice stock dynamic (ratio of rice normative consumption towards production per capita). Second, ratio of rice normative consumption towards production per capita on each region is factually precise compared to the actual data. These results show that the model could be applied to predict the rice volume if one of the determinant factors has changed.
Keywords: early warning system, rice stock, dynamic system.
INTRODUCTION
According to Law No. 7 year 1996, concerning sufficiency of domestic food shown by the adequate rice stock, both quality and quantity, and as well as the purchasing power. Food security includes, (1) physical food security, (2) food accessibility, which means that each household is able to obtain sufficient food, either domestic production, imported or donation, and (3) food consumption which refer to domestic food consumption, and individual ability of absorbing and metabolizing nutrition.
Food deficiency and food security could not be separated from the rice commodity, considering that rice is the main food consumed by nearly entire Indonesian population. It is seen from the high point of rice consumption, 100% which means that almost all of the households are consuming rice (Erwidodo et al., 1996).
Bali as a world tourism destination has its own carbohydrate source of rice with fluctuating production level, although it seems to tend to be increasing, 0,43%
per year, average production of 854.562 ton (table 1). This increasing production has been achieved through some efforts: maximizing the intensification quality, efficient technology application, maximizing cultivation index, as well as maximizing harvest and post-harvest treatment (Department of Agriculture, 2005). It all leads to the increasing rice productivity from 11.737 pounds per hectare in 2001, to 12.375 pounds per hectare in 2011, or it increases 118.8 pounds on average per hectare per year.
Table 1. Average Production of Food Commodity and Growth per Year in Bali Province 2006 – 2011
Commodity Average Production per Year (ton) Growth (% / year)
Rice 854.562 0,43
Corn 74.815 -2,14
Cassava 167.417 1,01
Sweet Potato 81.716 -5,36
Source: Central Agency of Statistic, Bali in Numbers (various years) Department of Agriculture, Council of Food Crops, Bali Province
Table 2. Development of Food Security in Bali Province, 2006 – 2011
Food variety Food Stock per Capita (kg/capita/year) Average Growth (%/year)
2006 2007 2008 2009 2010 2011 2006-2011 2001-2011
Rice 142,70 140,50 129,93 138,80 127,46 122,99 -2,78 -2,21
Corn 20,41 17,72 19,38 22,93 15,03 14,30 -4,96 -3,17
Cassava 40,02 42,58 41,11 40,65 40,35 40,04 0,06 -0,33
Sweet Potato 23,98 23,06 22,11 19,39 15,90 15,37 -8,32 1,15
Source: Central Agency of Statistic, Bali in Numbers (various years) Department of Agriculture, Council of Food Crops, Bali Province
(Nurmalina, 2007). If this problem soon not be solved, thus the need of importing rice will grow greater, that may lead to a high dependability which will exhaust our foreign exchange.
Rice sufficiency does face the degradation of natural resources quality and quantity, for examples, land and water resources (Saad, 1999). Rice production in Bali in 2010 is 869.160 ton, with average production of 12.564,2 pounds/ hectare (Central Agency of Statistic, Bali Pro-vince, 2011). Before 2005, there is 87.850 hectare of semi technical irrigated rice fields, but today, there are only 82.664 ha left (decreasing of 5.186 ha). Land use conversion, from agricultural use to tourism or residential use, surely be followed by the degradation of water and land quality as the result of non-agricultural sector deve-lopment, that less concerns about the environmental aspect.
Pressures toward natural resources without any sufficient structural change on economic sector will become a threat to rice stock, both on micro and macro level. On micro level, land and water degradation will cause a limitation on maximal natural resource explo-ration. This may lead to a degradation of rice cultivation productivity. On macro level, there will be an increasing number of poor population or group of people with low purchasing power, or even those without any food accessibility (rice), so that they are living in the risk of food insecurity (Maxwell and Timothy, 1992).
On the other hand, poverty provides greater pressure against uncontrolled natural resources exploration. This cycle should be ended that the sustainable rice stock could be steadily realized, thus food policy should
determine rice policy as one of its main pillars (Rachman, 2001).
Since 1997, Indonesian rice policy is under market mechanism (Timmer, 1996). Frankly said, it is indeed risky for such main need of more than 240 millions Indonesian to be attached fully to the market mechanism, which empirically shows price fluctuation as a result of demand and bargain.
The census in 2000 pictures that Bali populated by 3.150.057 people and in 2010, there are 3.890.757 people (census in 2010) or it has been increasing of 2,15% per year. The rice stock for eleven years tends to be decreasing of -2,21% (Table 2). Population demands rice stock and economic activity which provide job opportunity, as well as land for the use of industry, residences, roads and other public facilities. Therefore, such pressures may race the competition towards resources use, especially land and water (Saad, 1999).
Food stock sufficiency in the future is influenced by some factors related to the rice stock and demand, either individually or as a result of interaction within the factors. Concerning that rice is a strategic product, thus the stocking treatment, rice consumption and rice stock are necessarily to be understood for the importance of planning. This kind of information could be applied by the planner or the rule makers to give priority to the food security program, particularly on rice as the main food of the population
1.
Dominant variables from literatures, Expert and Stakeholder
Dominant variables/key
Early Warning system modeling for food securitycampaign
Implementation design
Model
Prospective analysis
Dynamic System Analysis
Model Validation
OK
Model Implementation
NO
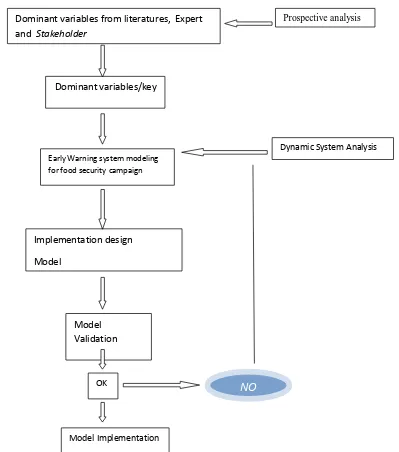
Figure 1. Steps of Research Process
RESEARCH METHOD
This study is initially begun with the research of food management system (rice in particular) which conducted through literature study, FGD-Focus Group Discussion, and direct observation. Secondary data related to the production aspect, cultivation, land use, population and consumption are collected from the related departments, such as Central Agency of Statistic, Logistic Depot of Bali and Department of Agricultural Food Crops, either Provincial or regional. Entire collected data is used to construct the system or food security early warning detection. The research sequence is shown in Figure 1.
Result and Discussion
Empty grain to rice
Increase of GKP Decrease of GKP
Percentage of
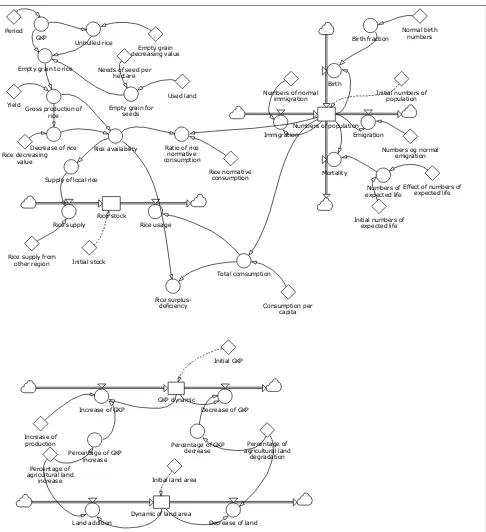
Figure 2. Early Warning System Modeling for Food Security
Some values of common variable have initial values are important for the rice production, such as harvest area, rate of land changes, rate of productivity changes, yield, and decrease level. Meanwhile, the common variable of rice consumption uses the initial value such as numbers of population, normative consumption, and population growth rate.
Model Development
The dynamic system is built upon the causal diagram which provides the image of relation between total production and normative consumption numbers in a certain region. Based on both variables then the value of rice normative consumption ratio towards net production per capita in that region could be obtained
The system test result or modeling on eight regions shows that such modeling is able to explain the rice stock dynamic with 97.6% of accuracy, and error level (mean
square error) of 0.09. Therefore, this kind of developing
modeling could be applied as an initial step for the rules makers (on regional level), in particular for the rice stock regulation.
The application of early warning modeling system depends on the government rule (Council of Regional Food Security), and private/ public institute that works on food security. Food security could only be realized if all of the stakeholders would take their own part in such integrated coordination.
Also, this modeling implementation must be supported by the accurate data availability, such as land and harvest measurement, as well as productivity rate which still depends on eye measurement.
Spatial data related to the land resources is to be used as one of the basic information for the next modeling development. The processing technology and spatial information presentation such as GIS (Geographical
Information System) and Remote Sensing are also
needed for data accuracy. Thus, the advance research which integrating such dynamic modeling and spatial data would provide a better and more complete data.
Conclusion and Suggestion
The modeling simulation result shows that the model or dynamic early warning modeling of rice stock is successfully explaining the dynamic on each sub model. With accurate initial data, this model could be used for procurement or anticipation towards changes on regulation related to rice stock. The simulation result also shows the matching data on spot, especially those related to the rice stock and population.
Researches related to the information technology, particularly on computer and spatial data utilization could be suggested to be integrated with the dynamic model, from Badan Pengkajian dan Penerapan Teknologi (BPPT), Jakarta for his help in discussion of the model. We gratefully acknowledged the Rector of Udayana
University, Denpasar Bali for supporting and funding this study.
REFERENCES
Central Agency of Statistic, Bali Province (2011). Downloaded from Central Agency of Statistic, Bali http://www.bps.bali.go.id., tanggal 12 Maret 2012.
Chechland PB (1981). System Thinking, Systems Practices. Wiley Chichester.
Daalen V, WAH Thissen (2001). Dynamics Systems Modeling Continous Models. Faculteit Techniek, Bestuur en Management (TBM). Technische Universiteit Delft.
Department of Agriculture (2005). Prospect and Rice Agribusiness Development. Jakarta.
Erwidodo T Sudaryanto, A Purwono, M Ariani dan KS Endraningsih (1996). Study of Rice Consumption Trend in Indonesia. Cooperation of Agricultural Economic Social Research Centre and DPG Project. Department of Agriculture. Bogor.
Gardner B (1987). The Economics of Agricultural Policies. Macmillan Publishing Company. New York. USA.
Manetsch RP, GL Park (1977). System Analysis and Simulations with Application to Economic and Social System. Michigan State University, USA.
Marimin (2004). Technique and Application of Plural Criteria Decision Makings. Jakarta.
Maxwell S, RF Timothy (1992). Household Food Security: Concepts, Indicators, Re-measurements, a Technical Review. Rome: International Fund for Agriculture Development.
Nurmalina R (2007). Balance Modeling of Sustainable Rice Stock in Supporting National Food Security. Dissertation. Sekolah Pascasarjana, Institut Pertanian Bogor. Bogor. Rachman HP (2001). Kajian Pola Konsumsi dan Permintaan
Pangan di Kawasan Timur Indonesia. Dissertation. School of Post Graduate, Bogor Agricultural Institute. Bogor.
Richardson GP, AL Pugh (1986). Introduction to System Dynamics Modeling with Dynamo. The MIT Press, Cambridge, Massachussete, and London, England.
Saad MB (1999). Food Security for the Food Insecure; New Challengers and Renewed Commitment. Centre for Development Studies, University College Dublin, Ireland. Tasrif M (2004). Simulation Modeling for Policy Analysis:
Dynamic System Methodology Approachment. Group of Research and Energy Development. Institute of Technology Bandung. Bandung.