Dyah Indriana Kusumastuti1
Abstract
Kota Tinggi located in the southern state of Malaysia, i.e. Johor Baru, experienced severe floods in December 2006 and January 2007, which was due to prolonged and intense rainfall. Johor River was inadequate to accommodate the water and at the same time the flow unable to escape the swolen river, hence water inundated the town. One of the river characteristics that may contribute in flooding is the meandering shape. Therefore it was proposed to do a hydraulic model that simulated some alternate channels that straightened some parts of the river. The model used one dimensional steady state approach using HEC-RAS software. The simulation result of the existing condition estimated that January 2007 flood event had a return period of 100 years. From the hydraulic model, it can be concluded that the choice of location and the length of the alternate channel had an effect on how much water level reduced.
Abstrak
Kota tinggi yang terletak di negara bagian Malaysia bagian selatan, yaitu Johor Baru, mengalami banjir besar pada Desember 2006 dan Januari 2007 yang disebabkan oleh hujan dengan intensitas tinggi dan berdurasi lama. Sungai Johor saat itu tidak mampu menampung air dan pada saat yang bersamaan aliran tidak dapat menghindari air sungai yang sudah membludak, hingga air akhirnya menggenangi kota. Salah satu karakteristik sungai yang memberikan kontribusi dalam kejadian banjir adalah bentuknya yang berkelok. Oleh karenng mensimulasikan a itu diusulkan untuk melakukan pemodelan hidraulika yang mensimulasikan beberapa saluran yang berbentuk lurus di beberapa bagian sungai. Model yang digunakan menggunakan pendekatan steady state satu dimensi menggunakan software HEC-RAS. Hasil simulasi pada kondisi existing menunjukkan bahwa banjir yang terjadi pada Januari 2007 disebabkan oleh kejadian hujan dengan kala ulang 100 tahun. Dari hasil simulasi juga dapat disimpulkan bahwa pemilihan lokasi dan panjang saluran alternatif berdampak terhadap seberapa tinggi air yang tereduksi.
1. INTRODUCTION
Kota Tinggi experienced severe floods in December 2006 and January 2007, which was due to prolonged and intense rainfall. In December flood event, heavy rain fell in several places in southern Johor for few days, and the highest rainfall recorded was 289 mm which fell on December 19, 2006. At those situations Johor River was inadequate to accommodate the water and at the same time the flow unable to escape the swollen river. Therefore water inundates the neighbouring area of Sungai Johor.
Floods have consequences for a wide range of structural, economic, social, and environmental factors. At the period of December 2006 to January 2007, severe floods not only occurred in Malaysia but also in Singapore and Sumatra. The overall losses in these countries are RM 1.5b. Six people were dead as a result from this severe flood in Malaysia.
1
To understand the hydrology and hydraulic processes which have transformed the rainfall into severe flood disaster as the flood events occurring in Kota Tinggi, a flood model is needed. The flood modeling works include hydrological analysis (Kusumastuti, 2009) and hydraulic analysis. Based on the result of design flood from the hydrology analysis done by Kusumastuti (2009), this paper discusses the hydraulic analysis. Meteorological data has been collected from Bureau of Meteorology and hydraulic data has been collected from JPS and own Survey conducted on 14 and 15 December 2007.
The hydraulic model was performed using HEC-RAS software. The HEC-RAS modeling system is a software that allows us to perform one-dimensional steady flow and unsteady flow calculations. HEC-RAS is the US Army Corps of Engineers River Analysis System developed by the Hydrologic Engineering. HEC-RAS is an integrated system of software, designed for interactive use in a multi-tasking, multi-user network environment. The system is comprised of a graphical user interface (GUI), separate hydraulic analysis components, data storage and management capabilities, graphics and reporting facilities. This software is widely used in water resources area, especially in hydraulic analysis and modeling. Some of the works are done by Kusumastuti (2008), Kastamto (2009), Hazarika (2008), Tate dan Maidment (1999).
One of the problems of the Johor River is the meandering shape at the downstream section. Because of that, water could not escape the part of the river quickly. When the rain still falls in addition to discharge from the upstream, the river cannot hold the water anymore. Water inundates to the surrounding area and therefore flood happens. Such situation occurred in Kota Tinggi during December 2006 and January 2007 flood events. There was an idea to alter the existing flow route to obtain a straight channel in order to the water flows faster. This study investigates several alternate flows and the impact on reducing water level of the river. The aim of the study is to do hydraulic analysis of the Johor River at existing condition as well as at proposed alternate flows
2. METHODOLOGY
This study used Steady flow surface profiles in the analysis. Based on available hydraulic data, the hydraulic model was based on a one-dimensioanl steady state computation. HEC-RAS is capable of performing one-dimensional water surface profile calculation for steady gradually varied flow in natural or constructed channels. The model also can be used in the subcritical, supercritical, and mixed flow regime. The equation for basic profile calculation involves cross section subdivision for conveyance calculations; Manning’s n for the main channel; velocity weighting coefficient alpha; and friction loss.
2.1. Equations for basic profile calculations
Water surface profiles are computed from one cross section to the next by solving the energy equation with an iterative procedure called the standard step method. The energy equation is written as follows.
Where : Y1, Y2 = depth of water at cross sections
Z1, Z2 = elevation of the main channel inverts
V1, V2 = average velocities (total discharge/total flow area)
α1, α2 = velocity weighting coefficients
g = gravitational accelerationα
he = energy head loss
2.2. Input Data for the Model
2.2.1.Geometric Data
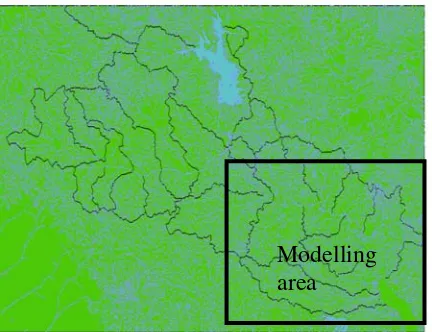
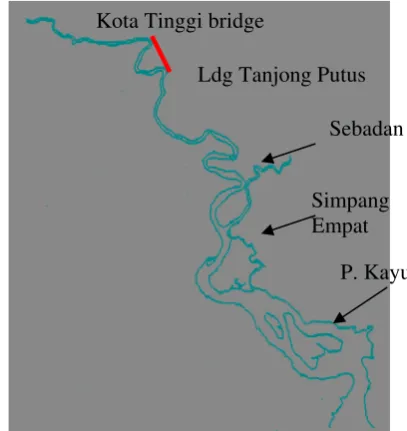
The study area is Johor River basin with the downstream part of the river as the modeling area (Figure 1). A contour map of Sg Johor Basin (Figure 2 ) was used as a basis to draw the schematic river system. However, the modelling area was confined to the town of Kota Tinggi and down stream until Simpang Empat (Figure 3).
Modelling
area
Figure 1. Sg Johor Basin and the modeling area
Tributary
Main channel
Sebadan Kota Tinggi bridge
Ldg Tanjong Putus
P. Kayu Simpang Empat
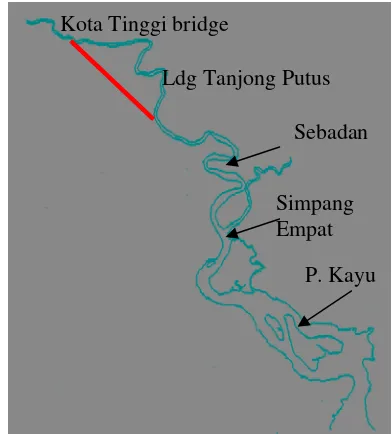
Figure 2. Modelling area Figure 3. Schematization of (main channel and tributaries) the river system
For the modeling purpose, the river system was simplified as in Figure 3 and only major tributary was considered.
JPS (Jabatan Pengaliran dan Saliran Malaysia) has carried out detailed survey from Kota Tinggi to Simpang Empat and the grid distance is about 100 meters. Sametime a simple survey was carried out on the 15 December 2007 by the author with two other colleagues from Malaysia to determine the depth and width of the Sg. Johor from Simpang Empat to Kg Panchor(Kuala).
2.2.2.Flow Data (Design Discharge)
Design discharges with various return periods as calculated in the Flood frequency analysis (Kusumastuti, 2009) were used as flow data input.
3. RESULTS AND DISCUSSION
3.1. Existing Condition
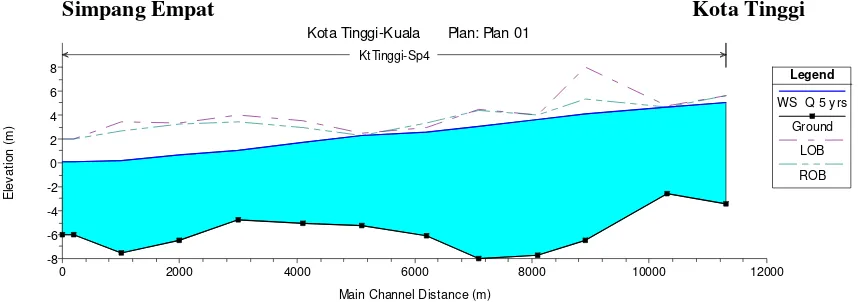
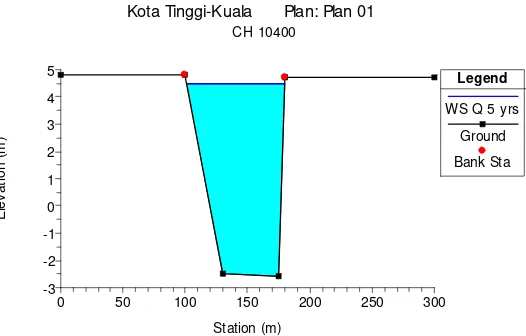
The simulation used 5 years return period of flood, and the result is presented in Figure 4. The elevation of the river bottom is negative assuming that the elevation of the water surface during survey is 0.0 meter. Simulation was done to the section between Kota Tinggi to Simpang Empat.
Simpang Empat Kota Tinggi
0 2000 4000 6000 8000 10000 12000
-8
Figure 4. Long profile Kota Tinggi – Simpang Empat
Dash lines (legend : LOB and ROB) represent left of bank and right of bank of the river. Solid line with dot (legend : ground) is the ground and solid line with no dot (legend : WS Q 5 yrs) represents water surface.
3.2. Proposals for Alternate River Flow
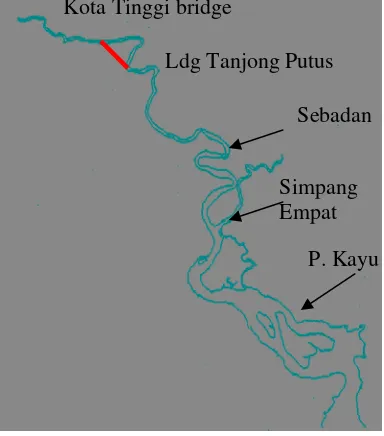
To reduce flood in Kota Tinggi, several alternate flows were proposed to see the impact on flood level. Alternate Channel 1 alters the flow before Kota Tinggi bridge to after Ldg Tanjong Putus into a straight channel. Alternate Channel 2 propose a shorter straight channel after Kota Tinggi bridge until before Ldg Tanjong Putus. Alternate Channel 3 similar to Alternate Channel 2, only it is proposed at the other side of the meandering section.
a. Alternate Channel 1
Kota Tinggi bridge
Ldg Tanjong Putus
P. Kayu Simpang Empat
Sebadan
Figure 5. River schematization with alternate channel 1
The alternate channel is proposed before Kota Tinggi bridge (Figure 5; represented by red line) in which the alternate flow bypassing the existing flow. The length of the alternate channel is 2.5 km.
The result shows that the alternate channel significantly reduces the water level in Kota Tinggi to 1.92 meters (Figure 6). A cross section of the alternate channel is presented in Figure 7, where the elevation of the river bed and river were adopted from the river channel. In Figure 7, bed channel width, top channel width and channel depth are 80 meters, 108 meters, and 9.6 meters respectively.
Figure 6. Long profile from Kota Tinggi to Simpang Empat using Alternate Channel 1
0 2000 4000 6000 8000 10000
-8 -6 -4 -2 0 2 4 6 8
Simpang Empat Kota Tinggi
Kota Tinggi-Kuala Plan: Plan 01
Main Channel Distance (m)
E
lev
at
ion (
m
)
Legend WS Q 5 y rs
Ground LOB ROB KotaTinggi2
0 50 100 150 200 250 300
-6 -4 -2 0 2 4
Kota Tinggi-Kuala Plan: Plan 01
Sudetan2
Station (m)
E
lev
a
ti
o
n (
m
)
Legend
WS Q 5 y rs
Ground
Bank Sta
Figure 7. Cross section of alternate channel 1
b. Alternate Channel 2
Kota Tinggi bridge
Ldg Tanjong Putus
P. Kayu Simpang Empat
Sebadan
Figure 8. River schematization with alternate channel 2
The length of alternate channel 2 is 1.4 km (Figure 8). The simulation result shows that this alternate channel does not significantly reduce water level (Figure 9). Bed channel width, top channel width and channel depth are 55 meters, 98 meters, and 8.7 meters respectively (Figure 10).
0 2000 4000 6000 8000 10000 12000
Simpang Empat Kota Tinggi
Figure 9. Long profile from Kota Tinggi to Simpang Empat using Alternate Channel 2
Figure 10. Cross section of alternate channel 2
c. Alternate Channel 3
Figure 11. River schematization with alternate channel 3
The length of alternate channel 3 is 1.4 km (Figure 4.12). Proposed alternate channel insignificantly reduce water level (Figure 4.13). Bed channel width, top channel width and channel depth are 45 meters, 80 meters, and 7.5 meters respectively (Figure 4.14).
Simpang Empat Kota Tinggi
0 2000 4000 6000 8000 10000 12000
-8
Figure 12. Long profile from Kota Tinggi to Simpang Empat using Alternate Channel 3
Figure 13. Cross section of alternate channel 3
From the simulation on several alternate channels, it is observed that the alternate channel has an impact in reducing the water level. Selection of location and the length of the alternate channel impacts on the extend of water level reduced. This is because the longer the length of straight channel (of alternate channel), reduces the friction, increases the velocity, and hence reduce water level.
3.3. Simulation for high storm depth
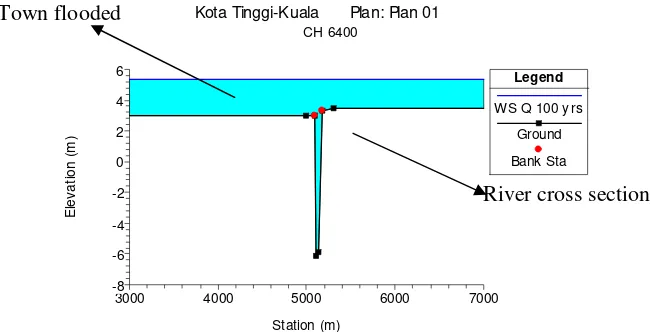
During severe flood event, drainage capacity (main channel and river bank) not sufficient for flow. There are two important things found during the flood events, i.e. inadequate urban drainage and inability of drainage water to escape. Extreme condition (December 2006 and January 2007 Johor Baru flood events), Kota Tinggi Town was flooded. In the hydraulic sense, the town became wide flood plain area as illustrated in Figure 14.
Town flooded River flood plain
Main channel
Figure 14. Cross section for severe flood
The long profile of the river for the simulation using 100 years return period of flood for the reach between Kota Tinggi to Simpang Empat is presented in Figure 15. It is shown that surface water level exceeds the river bank.
3000 4000 5000 6000 7000
-8
Figure 15. Cross section during flood
Once the river is incapable to accommodate the flow, water inundates the area surrounding the river. The range of the land inundated by the flood is about few kilometers from the river. It is seen in Figure 15 that river main channel is much smaller than the town area flooded. During that severe flood event, simulation result shows that the elevation of water level is 5.70 meter, which is close to the real elevation of the water at January 2007 flood event, i.e. 5.45 meter.
4. CONCLUSION
1. The hydraulic model analysis shows that the alternate channel has an impact in reducing the water level. Selection of location and the length of the alternate channel impacts on the extend of water level reduced.
2. Drainage capacity at Kota Tinggi is only able to accommodate water at low return periods of floods (±5-10 years return period)
3. January 2007 flood event was caused by 100 years return period of flood.
4. Simulation result shows that water level at Kota Tinggi is ±5.7 m, which is close to the real elevation of flood ±5.45 m
REFERENCES
Hazarika, M.K., Bormudoi, A., Phosalat, S., Sengtianth, V. and Samarakoon, L. 2008. Flood Hazard in Savannakhet Province, Lao PDR Mapping Using Hec-Ras, Remote Sensing and GIS. 6th Annual Mekong Flood Forum (AMFF-6), 27-28 May 2008, Phnom Penh, Cambodia.
Kastamto. 2010. Prediksi Morfologi Dasar Sungai Akibat Variasi Tutupan Vegetasi Tebing Sungai Way Sekampung. Master Thesis. Magister Teknik Sipil Universitas Lampung.
Kusumastuti, D.I. 2008. Konsep Tampungan dan Perlindungan Banjir. Prosiding Seminar Hasil Penelitian dan Pengabdian Kepada Masyarakat Lembaga Penelitan Universitas Lampung, pp. 56-61.
Kusumastuti, D.I. 2009. Hydrology Analysis to define design flood of the Johor River using Synthetic Unit Hydrograph GAMA I. Rekayasa Jurnal Sipil dan Perencanaan, Vol 13(3) pp. 219 – 228.
Tate, E. and Maidment, D. 1999. Floodplain Mapping using HEC-RAS and ArcView GIS. Master Thesis. Center for Research in Water Resources. University of Texas. CRWR Online Report 99-1.