Alternative Performance Measurement for Road Management Agencies
Using Data Envelopment Analysis Method
Biemo W. Soemardi
Faculty of Civil and Environmental Engineering, Institut Teknologi Bandung, Jl. Ganesa No. 10 Bandung, Indonesia, Email: [email protected]
Agung R. Fajri
Civil Engineering, Institut Teknologi Bandung, Jl. Ganesa No. 10 Bandung, Indonesia. Jurnal Teoretis dan Terapan Bidang Rekayasa Sipil
Jurnal Teoretis dan Terapan Bidang Rekayasa Sipil
Abstract
Performance assessment is the most important phase in each organization cycle to determine whether the organiza-tion has been funcorganiza-tioning in accordance to the fundamental purpose of the organizaorganiza-tion existence. This is also true for the National Road Implementation Agencies (BBPJN/BPJN) as the technical supporting units of the Directorate General of Bina Marga - Ministry of Public Works that are responsible for the maintenance and functioning of the national roads in Indonesia. As public institution, currently BBPJNs and BPJNs are accountable for their perfor-mances and to be assessed in accordance to government assessment mechanism using Performance Report of Government Institution - LAKIP. Departing from some weakness on the current mechanism, this paper is to discuss the development a performance assessment model using DEA (Data Envelopment Analysis) approach as a comple-mentary model to the existing performance measurement model. Using DEA approach, relative efficiency amongst road agencies can be compared, which will then can be utilized as the basis for decision by the Directorate General of Bina Marga on BBPJN/BPJN’s future workplan and budgeting.
Keywords:Road services agencies, Performance assessment model, DEA.
Abstrak
Pengukuran kinerja merupakan tahap yang paling penting dalam setiap siklus organisasi untuk mengetahui apakah organisasi tersebut telah berfungsi dengan baik sesuai dengan tujuan keberadaannya. Hal serupa juga berlaku bagi Balai dan Bali Besar Pelaksanaan Jalan Nasional, yang merupakan organisasi di lingkungan Direktorat Jenderal Bina Marga - Kementerian Pekerjaan Umum yang berfungsi dan bertanggungjawab terhadap pemeli-haraan dan penyelenggaraan jalan nasional di Indonesia. Sebagai instansi publik, saat ini kinerja BBPJN dan BPJN perlu dinilai dan dituntut pertanggungjawabannya melalui mekanisme Laporan Kuntabilitas Kinerja Instansi Pemerintah (LAKIP). Berangkat dari kelemahan-kelemahan LAKIP, makalah ini membahas pengembangan model penilaian kinerja dengan pendekatan analisa selubung data - DEA, sebagai model pendukung untuk menilai kinerja BBPJN/BPJN. Penggunaan pendekatan DEA, efisiensi relatif antara Balai/Balai Besar dapat dibandingkan, yang selanjutnya dapat diguakan sebagai landasan pengambilan keputusan bagi Direktorat Jenderal Bina Marga untuk menyusun rencana kerja dan anggaran mendatang bagi Balai/Balai Besar tersebut.
Kata-kata Kunci: Unit penyelenggaraan jalan,Model penilaian kinerja, DEA.
1. Introduction
Roads, as part of the transportation infrastructure system, are one of the most demanded public infra-structures that they function to essentially connect one area to another. In Indonesia, such important role of road is legally stated in Law no 38 - 2004 on Roads, Part III on Roles, Categorization, and Parts of Roads, section 1, article 5 concerning Role of Roads. Law states that roads do not only play important role in all areas, but also be part of goods and service distribution infrastructure, which is the main vein of public life, the nation, the state, and the link and unity of the whole
Republic of Indonesia. Further, road network as part of the national transportation system hold important role, especially in supporting the economy, social-cultural, political, as well as the national security. With respect to those issues, the government has the responsibility to provide reliable road infrastructure system. Such responsibility is part of the duty of the Directorate General Bina Marga (DGBN), Ministry of Public Works.
Jurnal Teknik Sipil
(BBPJN) and Balai Pelaksanaan Jalan Nasional (BPJN), are set up to support the Directorate General Bina Marga. According to the Ministry of Public Works regulation no 21/PRT/M/2010 on Organization and Technical Implementation Units, article 114 and 158, BBPJN and BPJN have the duties of executing the national road management system. This system consists of planning, procurement, improvement of capacity and preservation of national roads, quality control, as well as providing necessary materials and equipment needed for road and bridge works.
As part of the government institutions, the existences of these units are subjected to performance evaluation, as to determine how effective they are in meeting the organization’s objective, in performing their duties and responsibilities. Moreover, such evaluation is also necessary to decide whether the utilization of all budgeted resources are efficient. Efficiency is one many important performance measurements in road manage-ment system, especially in a national scale, since involves a very large sum of money.
To illustrate the magnitude of DGBN budget for nation-al road system, Roadmap for Bureaucratic Reforms of DGBN 2010-2014 stated that the government has significantly increased the budget allocation for national road system from Rp. 6.02 trillion in 2005 to Rp. 28.7 trillion in 2011. As shown in Figure 1, this represented an increase of more than fivefold in 6 years period, making it the largest budget within the Ministry of Public Works. However, such an increase in budget is not always necessarily accompanied by optimum realization of the plans.
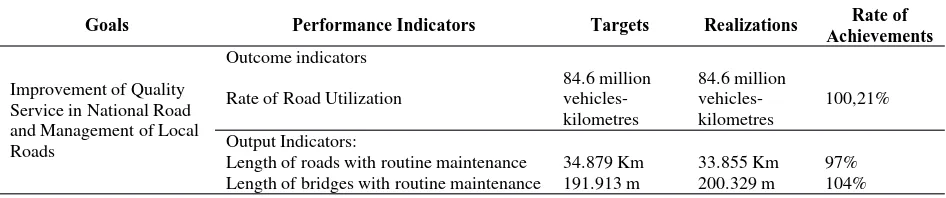
Similar to other government institutions, at the national level the performance of BPJN and BPJN are assessed by using LAKIP instrument, which measure the level of achievement of several performance indicators previously set. LAKIP, an acronym of “Laporan Akuntabilitas Kinerja Instansi Pemerintah” or Perfor-mance Accountability Report for Government Institu-tions, is an instrument used by the government to audit the performance of government institutions that uses the ratio of realization and planned performance of some indicators. Using the instrument the government audit can measure the rate of effectiveness of such institution
0
2005 2006 2007 2008 2009 2010 2011 Budget (Rp. Trilions)
source: Roadmap for bureaucratic reform Directorate General of Bina Marga 2010-2014
Figure 1. APBN allocation for directorate general of Bina Marga
in achieving the target, but is deemed failed to recog-nize how efficient was the institution in using its resources, including allocated funding budget, to reach those achievements.
However, this instrument has limitations, that in its current form, LAKIP is unable to accommodate or recognize the variation of delivery level of road services due to different characteristics, workloads, and service capacities of national road system of each BBPJN and BPJN into its measurement system. Each BBPJN or BPJN has different size of road length that needs to be built and maintained, different geographic characteristics, local development stage, as well as different sizes of equipment fleet and other resources. To accurately measure the individual BBPJN’s or BPJN’s performance, the measuring instrument must also be able to accommodate such differences, and efficiency of BBPJN/BPJN, because it is deemed capa-ble of comparing efficiency levels amongst BBPJN/ BPJNs. DEA model is a widely used management tool to solve complex efficiency measurement as applied in a variety of area, ranging from health and education, to banking and engineering, to road management system.
Goals Performance Indicators Targets Realizations Rate of
Achievements
Length of roads with routine maintenance 34.879 Km 33.855 Km 97% Length of bridges with routine maintenance 191.913 m 200.329 m 104%
Table 1. Example of LAKIP performance evaluation indicators for road management system
2. Data Envelopment Analysis
Data Envelopment Analysis (DEA) method is a management tool for evaluating the performance of
working entities or organizations, which us widely used in a variety of area from schools, hospitals, to banking and product manufactures (Charnes et al., 1994). This method was first coined by Charnes, Cooper dan Rhodes (Charnes et al, 1978), and soon became a popular quantitative method for measuring relative efficiency of a homogenous group of decision-making units - DMUs. In general, DMU is the object of analy-sis that can be assumed as unit or entity responsible for conversing inputs into outputs.
DEA is categorized into frontier analysis method, that estimates the maximum output from a given input (output oriented), or minimum input for a desired level of output (input oriented), which will be used as boundary or benchmark for combinations of input-output of a unit under study. The value of this estimate, called relative efficiency, is the result of relative comparison amongst units under study, which will also change if the compositions of units are changed too (Cooper et al, 2000).
Efficiency value in the forms of multiple inputs and multiple outputs is formulated as:
The simplest model of DEA formulation is the CCR model (Charnes et al, 1978), which consists of the sum of weighted outputs over the sum of weighted inputs. For n DMU, for each DUM under study, the efficiency score can be determined from:
where, p = relative efficiency score of DMUi s = num-In a linear programming, it is formulated as follows:
kp
through maximization the efficiency ratios of DMUi, by
limiting the efficiency ratios (derived from the above-mentioned formula), for each DMU not to exceed 1, and the weights of (vk) dan (uj) cannot be negative (>
0). That formulation is repeated for n DMU.
The need for performance measurement models for road management agencies has been discussed for quite sometimes (Wei and Schonfeld, 1998). DEA modeling technique as alternative instrument for measuring performance of road delivery and maintenance has been proposed in various studies by Fallah-Fini et al(2009); TRB (2009; Wang, and Tsai (2009), Ozbek et al (2010), and Wei, et al (2011). Those studies concluded that DEA model could be applied as instrument for relatively measure how efficient is a unit or organi-zation in performing its function in delivering and maintaining roads, in comparison to other similar units or organizations.
3. Selection of Input and Output Factors
In DEA, all types of input and output factors can be incorporated into the model, be it a very simple factor or the most complex ones, because DEA does not discriminate a factor specific priority in the analysis. All factors have equal impact on output of the analysis (Ozbek et al, 2010). Therefore, the establishment of input and output factors is the most important process in using DEA. Such an establishment is subjective, dependent on the discretion of the person and the availability of data. Nonetheless, fundamentally the selection of input and output factors should have direct association with the objective, the process run by, as well as to have significant impact on the attainment of level of efficiency of the DMU under study.
The number of input and output factors should be
care-fully determined before applying DEA; so that such
number will be appropriate with the number of DMUs understudy. DEA model that accommodates a large number of input and output variables tends to moves DMUs toward frontier efficient, making DMUs under study to have the high efficiency values (Ozbek et al, 2010). Some researchers have proposed some rules of thumb regarding the allowable number of input-output factors based on the number of DMUs:
a. Avikiran (1984) and Darrat et al (2002) suggested that the multiplication of input and output factors
should not be greater than the number of DMU;
b. Ramanathan (2003) proposed the number of samples (DMUs) must be twice or three times larger than the
Jurnal Teknik Sipil
c. Boussofiane et al (1991) and Dyson et al (2001), proposed the minimum number of DMU must be equal to 2mt, where m = number of input factors, and t = number of output factors.
However, it is advisable to set the number of input-output variables as low as possible, so that DEA model can produce the best analysis without losing dominant variables in determining the DMUs’ efficiency levels. (Ozbek et al, 2010).
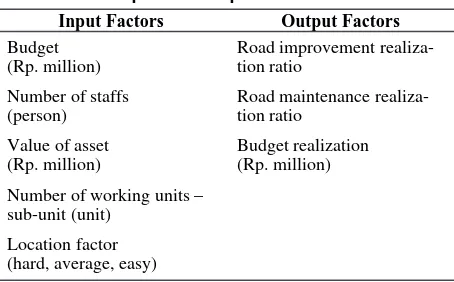
The following table depicts input and output factors used in evaluation BBPJN/BPJN’s efficiency:
Input Factors Output Factors
Number of working units – sub-unit (unit)
Table 2. DEA input and output factors
The selection of input and output factors was based on the duty and function of BBPJN/BPJN such as depicted in article 114 and 158 Ministry of Public Works Regu-lation no No.21/PRT/M/2010 about the organization and working system of Ministry of Public Works’ tech-nical implementing units (UPT), in particular which is related to improve the capacity and preservation of
The set of input factors consist of five factors:
a. Budget which represents fund allocated to BBPJN/ BPJN, and all units under it subordination, to perform its duty to deliver and maintain the national road networks.
b. Number of employee includes all permanent tech-nical and administrative staffs belong to BBPJN/ BPJN and all of its subordinates, but to exclude those of temporary employees or outsourced staffs, and are measured in number of person.
c. Value of asset represents the total value of asset owned by BBPJN/BPJN and all working units
under its subordination that is deemed to directly and indirectly influence the capability of this unit to function. Asset includes tangible asset such as machineries, buildings, roads and bridges, and intangible asset such as software and licenses recorded in the inventory list of Ministry of Finance (government property), and is measured in monetary unit.
d. Number of working units (subordinate) reflects the number of working or implementing unit under direct coordination of BBPJN/BPJN.
e. Location factor, this factor is to represent the degree of difficulty faced by each unit in performing its full duties, which is to reflect the characteristics of geographic dispersion, soil condi-tions, topography, and the degree of regional economic and social development.
Geographic dispersion was meant to represent the spe-cific characteristics of the region at which BBPKN/ BPJN has the authority, whether its region is mainly is located in a vast land area or dispersed of several islands. This geographic characteristic will impact the mobilization and demobilization of road equipment of transportation of other resources into the sites. Soil condition and topography are supposedly representing the variability of soil characteristic in each BBPJN/ BPJN working area.
In contrast, difficulty value of 1 was given to Balai VIII -Denpasar and Balai IX-Ambon for the fact that they are located in small islands that makes mobilization and demobilization of equipment more problematic. Balai X-Jayapura was also rated difficult, since its working zone is mostly in mountainous and isolated areas, with very limited access to land transportation. The rest of BBPJN/BPJN were rated moderate, because they are not located in developed area such as in Java Island but they are not also not located in a very bad location as well.
3.2 Output factors
a. Budget realization which reflects the accumulated funds used to execute duty and responsibility of BBPJN/BPJN to achieve the predefined targets.
b. Road improvement realization ratio. This ratio represents the proportion of total length of road improved or upgraded as compared to planned quantity in any given budget year.
c. Road maintenance realization ratio. This ratio repre-sents the proportion of total length of road being
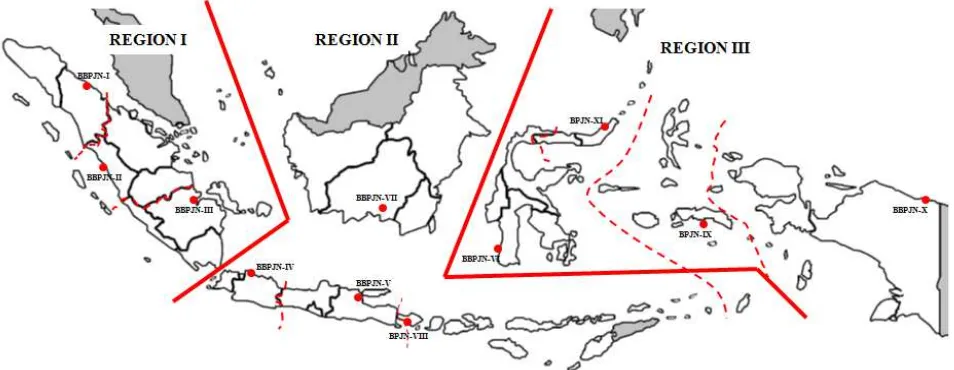
Figure 2. Geographic area of responsibility of BBPJN/BPJN
Scale
(rate of difficulty) Indicators DMU
1 (High)
Mostly located in small islands highland/mountainous terrain, or in bad soil condition
Mostly located in under-developed region
BBPJN X-Jayapura BPJN VIII-Denpasar BPJN IX-Ambon
3 (Low)
Mostly located in large island, low land and with relatively good soil condition.
Mostly located in highly-developed region
BBPJN IV-Jakarta BBPJN V-Surabaya
2 (Moderate) In between
BBPJN I-Medan BBPJN II-Padang BBPJN III-Palembang BBPJN VII-Banjarmasin BBPJN VI-Makassar BPJN XI-Manado
Table 1.Location factor - difficulty level
maintained in a year as compared to planned quanti-ty in any given budget year.
Maintenance works for national roads include routine maintenance and scheduled rehabilitation, whereas improvement works comprise of reconstruction or bet-terment of road structural elements, widening and con-struction of new roads.
It should be noted that according Law no 38 – 2004, and Government Regulation no 34, 2006 on roads, bridges, along with tunnels, underpasses, and flyovers, are included in road system, and therefore they are also included in the measurement of BBPJN/BPJN perfor-mance. In this DEA model, these structures are exclud-ed from the performance assessment.
Jurnal Teknik Sipil
Table 3. Input-Output Factors for BBPJN/BPJN
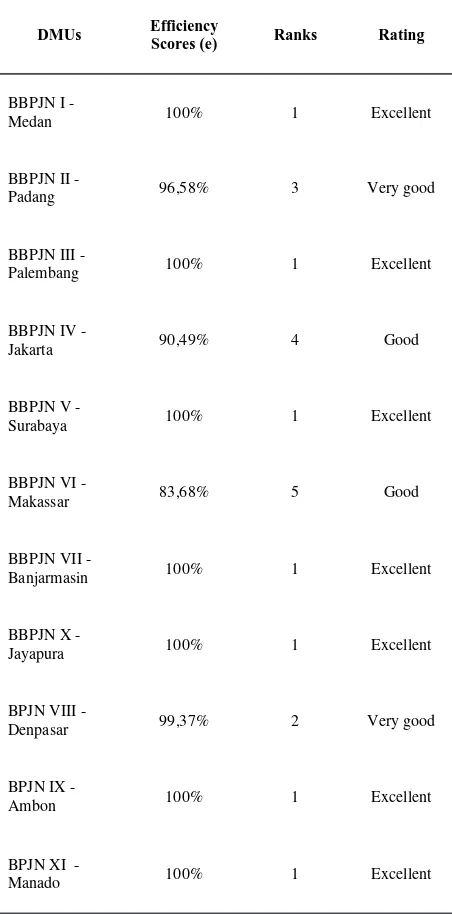
DMUs Efficiency Scores (e) Ranks Rating
Table 2. Efficiency Scores for BBPJN/BPJN
rating: excellent (100%), good (80-99%), fair (65-80%)
4. Performance Assessment using DEA
Method
To illustrate the application of DEA model, data gathered from performance report from Directorate General of Bina Marga - Ministry of Public Works year 2011, which compiled report from all BBPJNs/BPJNs, will be used. The results are shown in Table 4.
1In total, 7 DMUs were rated very good, scoring maxi-mum efficiency (100%), which are BBPJN I Medan, BBPJN III Palembang, BBPJN V Surabaya, BBPJN VII Banjarmasin, BBPJN VIII Denpasar, BPJN IX Ambon, and BPJN XI Manado. Two DMUs scored relatively good (80-99%), which are BBPJN II Padang and BPJN VIII Denpasar, whereas the other two DMUs scored between 80-95%, which are BBPJN IV Jakarta and BBPJN VI Makassar (83,68%, the lowest). In general, all BBPJNs and BPJNs can be considered efficient.
5. Analysis
1The focus of analysis is to recognize whether different BBPJN/BPJN is performing differently according its individual workloads and geographic characteristics, as well as to determine which BBPJN or BPJB is perform-ing in the most efficiency way in producperform-ing realizperform-ing output for a given set of input. Since not all BBPJNs and BPJNs are equipped with the same organization elements, it is necessary to take into account such differences in comparing performance amongst BBJNs and BPJNs.
Figure 3. Organizational structures of BPPJN and
BPJN
5.1 Type of DMU
In calculating the efficiency, this DEA model did not make any distinction between efficiency scores made by BBPJNs to those of the BPJNs. Although they have different workloads and organization structures, they
are still functioning and having the same objectives;
that is providing good and reliable national roads. In general, workloads and responsibility borne by BBPJN is considered more complex than those borne by BPJN, so it requires a more comprehensive structure with more tasks specific. Judging from their geographical characteristics, the area of responsibility of BBPJN is much broader than BPJN, whereas almost all BPJNs are in the region of small islands (Bali, NTB, NTT, Maluku and North Maluku).
As shown in their efficiency values in Figure 4, on the average BPJNs’ performances are relatively higher than those of BBPJNs. Out of eight BBPJNs, only four BBPJNs scored excellence relative efficiency. This is lower than that of BPJNs that have two BPJNs rated excellence out of three BPJNs. BPJN VIII Denpasar scored second best efficiency, so that the overall perfor-mance of BPJN was relatively better than BBPJN. Such a higher accomplishment was possible since the complexity and workloads of BPJN is in general lower than what BBPJN should cover.
The performance of BBPJN and BPJN does not seem to be influenced by the type of organization. The efficien-cy scores of type A and type B BBPJN are almost identical. Type B BBPJN has more DMUs with high efficiency than type A BBPJN that makes the average relatively high. On the other side, high average efficien-cy performance of type B BBPJN can also be attributed to the fact that the total number of DMU in type B BBPJN is larger than type A. Similarly, type A BPJN and type B BPJN have almost the same efficiency. Again, this seems to confirm that the type of organiza-tion does not have significant affect to the efficiency performance of BBPJN and BPJN.
Figure 4. Efficiency scores of BPPJN and BPJN
5.2 Allocation and ratio of budget
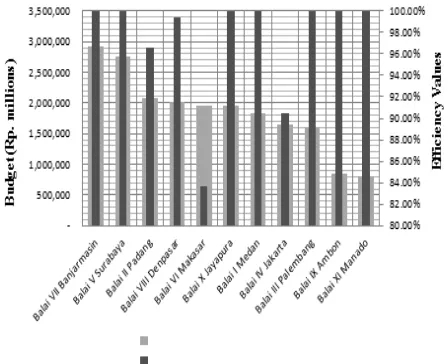
With respect to allocated budget to each BBPJN or BPJN, DEA result did not seem to indicate any correla-tion between the sizes of budget to the efficiency values. This was shown, for example, by the perfor-mance of BBPJN V Surabaya and BBPJN VII Banjar-masin, each with more than Rp. 2 trillion budget, that have the same efficiency values of 100% as to what BPJN IX Ambon and BPJN XI Manado, which have less than Rp. 1 trillion in their 2011 budget. Therefore, it can be concluded that the magnitude of the budget allocation gives no significant impact on the level of efficiency of BBPJN or BPJN, and the greater budget does not guarantee higher performance.
One of the most important input factors in planning is the allocation of budget, as it was believed to be the most essential resources in an organization. Therefore, it is important to know whether budget will affect the performance. As shown in Figure 5, however, the results suggested that there was no correlation between
Jurnal Teknik Sipil
the amounts of budget to the efficiency performance. Further, budget realization seemed to have similar tendency, as it showed no correlation between budget realization and the efficiency performance (Figure 6). Ratio of budget realization is calculated by dividing the realization of absorption of budget by planned budget. These two suggests that budget should not be used as the only indicator for measuring efficiency performance of BBPJN or BPJN.
5.3 Ratio of roadwork realization
Judging from the ratio of the realization of the work, no correlation was also found between the efficiency of the BBPJN/BPJN and the ratio of actual improvement or maintenance national roadwork.
Figure 6. Budget realizations vs. efficiency scores
Figure 7. Ratio of road maintenance realization vs. efficiency values
Figure 8. Ratio of road improvement realization vs.
efficiency values
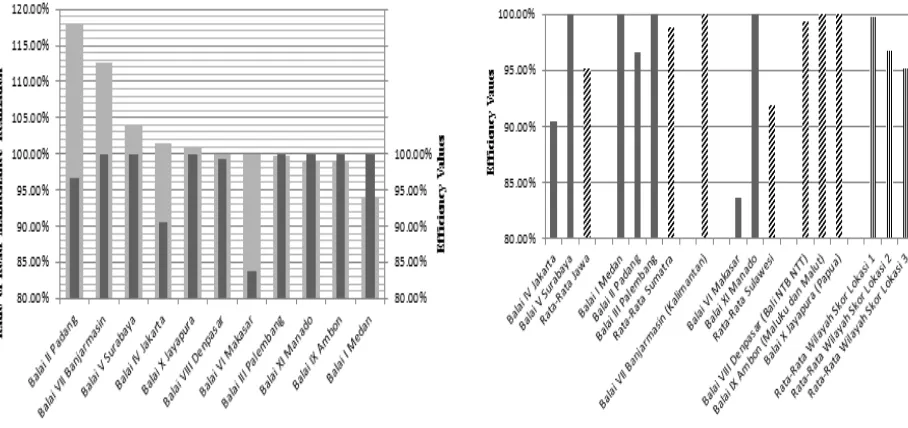
5.4 Location factors
Geographic location of BBPJN/BPJN will definitely affect the working capacity and workloads. In this study, 11 DMUs were studied and grouped into 7 regions: region-1 Sumatera island (Balai Besar I Medan, Balai Besar II Padang, and Balai Besar III Palembang), region-2 Jawa island (Balai Besar IV Jakarta and Balai Besar V Surabaya), region-3 Bali, West Nusa Tenggara, and East Nusa Tenggara (BPJN VIII Denpasar), region-4 Kalimantan (Balai Besar VII Banjarmasin), region-5 Sulawesi (BBPJN VI Makassar and BPJN XI Manado), region-6 Maluku and North Maluku islands (BPJN IX Ambon), and region-7 Papua (BBPJN X Jayapura).
average based on location average based on location factor
Based on the location factor listed in Figure 2, area in Jawa Island was rated with score 3 as location with the least difficult condition, whereas Bali, NTB, NTT, North Maluku, Maluku islands, and Papua were rated with score 1 reflecting the most difficult locations. The other BBPJN and BPJN were scored 2.
The above figure shows that on average BBPJN/BPJN located in islands of Kalimantan, Papua, Maluku and North Maluku got the highest efficiency scores, followed by Bali, West Nusa Tenggara NTB and East Nusa Tenggara, as well as Sumatera, and Sulawesi. Based on location factor, area with high degree of diffi-culty attained the highest efficiency values (99.97%), followed by area with moderate degree of difficulty (96.71%), and low degree of difficulty (95.25%), even tough with only very slim difference.
At this point, it can be concluded that, in general, BBPJNs in region with low difficulty condition were less efficient in using their resources in comparison to other BBPJNs and BPJNs in more difficult locations.
The reason for such a lower performance may lie on the complexity of problems faced by BBPJN in that region, which is probably not found in other regions, such as complexity of road networks, local government regulations, etc. However, this study was not intended to finding those reasons but merely to show that subjec-tive judgment on the working condition should be taken into consideration. Therefore, it is necessary study the effect of subjective judgement on assigning the rate of difficulty of each location to the estimating accuracy of efficiency performance.
In accordance to Ministry of Public Works Law no 8 - 2010, this 7 regions was then consolidated into 3 larger regions, and for each of these three regions (region I - Sumatera, region II – Jawa, Bali, West Nusa Tenggara, East Nusa Tenggara, and Kalimantan, and region III - Sulawesi, Maluku, North Maluku, and Papua) the effi-ciency performance can be calculated.
As shown in Figure 10, region III has more DMUs (3 out of 4 DMUs) with the highest efficiency values than other regions. However, if examined more closely, although only slightly, the average efficiency values of region I was the highest, followed by region II and region III.
5.5 Sensitivity analysis
Each input or output factor has its own influencing strength over the efficiency values. The strength of influence needs to be known to determine whether such factors have significant impact or not against processes or activities executed within BBPJN/BPJN. If proven to be significant, such factor should become one of the main focuses of decision makers in improving the
Figure 10. Efficiency values based on region
performance of BBPJN or BPJN. With the same output/ input ratio, the decision maker can increase the values of input factor in order to get better output. In contrast, if such factors had only insignificant impact, they can be written off from the model.
In this study sensitivity analysis was carried out by methodically eliminating a range of output/input factors to determine their individual impact strength. After eliminating one factor, the efficiency value of the new output/input set was recalculated and the results were compared with the previous values. Ratio of efficiency change was calculated by dividing efficiency value after elimination of factor with the initial value, before the elimination. For example, to determine the effect of budget on the efficiency value, the efficiency values were calculated with and without the budget as input factors, followed by calculating the ration of those two efficiency values. This procedure was repeated for other factors.
Jurnal Teknik Sipil
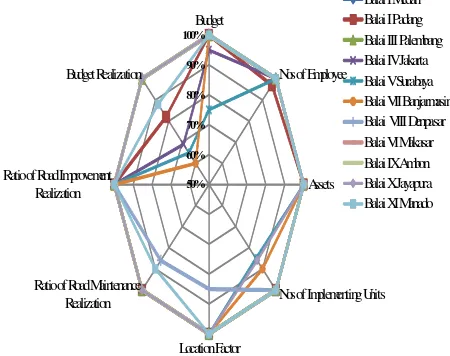
The spider web diagram on Figure 11 shows the ratio of changes for each input-output factor. The lower the percentage, the greater the changes and the more significant the factors in affecting the efficiency values of BBPJNs/BPJNs.
On average of all 11 DMUs, number of working units (input factor) and budget realization (output factor) has significant impact to the efficiency score. This means seem to have any influence at all on BBJN/BPJN’s effi-ciency performance. The rest of the factors seem to have some influence on efficiency value, although it is not significant.
The lack of effect of the number of staff and the value of assets on the performance of BBPJNs and BPJNs is an interesting situation. Theoretically, the two input factors should have a significant impact on perfor-mance, and this situation must be wisely examined. Similar attention should be given to out factor of road improvement realization ratio, since one of the main objective of BBPJN and BPJN is improve the quality of road network within their respective region.
6. Conclusion
This paper has pointed out the limitation of the currently applied performance measurement model and shown the potential of DEA model to overcome such shortcomings.
1. LAKIP can only measure the performance of a unit from its effectiveness, or from the level of attain-ment that particular unit was able to accomplish with respect to a given target. Yet, at the same time, this model cannot be used to measure how good the unit is using resources to achieve the target. In rela-tion to the performance measurement of BBPJN/ BPJN, LAKIP does not consider the various condi-tions and characteristics of the units, so that work-loads, service capacity and other factors are treated equally for all BBPJNs/BPJNs.
2. In contrast, DEA model can be utilized to help the management of Directorate General of Bina Marga in decision making process that related to the performance of individual BBPJN/BPJN. DEA model can be used to evaluate BBPJNs/BPJNs simultaneously, directly comparing each DMU against various aspects at once, and using the best performance BBPJN or BPJN as benchmarking points for future improvement. BBPJN or BPJN with good performance should be rewarded, where-as those with low performance should be improved
using the practices of the best performer as point of reference.
3. However, this method does have some limitations;
in a sense it cannot provide apparent rationale on why one DMU is performing better than the others. Thus, decision maker should not rely fully to this model, but can still utilize it as a mean to indicate any discrepancies in performance amongst BBPJN/ BPJN, as it certainly needs additional analysis to further determine the true input-output factor rela-tionships. of staffs and value of asset in influencing BBPJN/BPJN performances. The use of single year data, instead of from a series of annual reports, also contributed to the lack of information about the dynamics of performance efficiency BBPJN/BPJN, so any changes that may occur during the functioning period of BBPJN/BPJN can not be assessed accurately. This condition certainly will affect the follow up analysis, particularly on the strength of influences of input-output factors in sensitivity analysis.
Furthermore, in this study the value of location factor was highly subjective, unilateraly determined and not based on in-depth research related to the influence of geographical charactersitic, accurate conditions of soil and area, quality of human resources, mobilization of resources and other technical and managerial factors. Therefore, it is recommended for further study to aleviate this subjective judgment approach with a more comprehensive and accurate data.
In measuring the performance of BBPJN and BPJN, DEA model can be used as alternative or complement to LAKIP. While it is understood that DEA model will not be able to reflect the absolute performance of the unit, its relative efficiency values can be used as bench-marking mechanism for overall evaluation of all BBPJN and BPJN, and becomes part of continuous improvement effort of the Directorate General Bina Marga.
References
Avikiran, N., 1984, Investigating Technical and Scale Efficiencies of Australian Universities Through Data Envelopment Analysis. Socio-Economic Planning Sciences, Vol. 35, pp. 57-80
Boussofiane, A., Dyson, R.G., and Thanassoulis, E., 1991, Applied Data Envelopment Analysis. European Journals of Operation Research, 52 (1), pp. 1–15.
Charnes, A., Cooper, W.W., and Rhodes, E. 1978, Measuring The Efficiency of Decision Making Units. European Journal of Operational Research, 2, 429-444.
Charnes, A., Cooper, W. W., Lewin, A. Y., & Seiford, L.M. (Eds.), 1994, Data Envelopment Analysis: Theory, Methodology, and Applications. Boston: Kluwer.
Cooper, W.W., Seiford, L.M., dan Tone, K., 2000, Data Envelopment Analysis: A Comprehensive Text with Models, Applications, References, and DEA-Solver Software. USA: Kluwer Academic Publishers.
Darrat, A., Topuz, C. and Yousef, T., 2002, Assessing Cost and Technical Efficiency of Banks in Kuwait. Paper presented to the ERF’s 8th Annual Conference in Cairo, ERF, Cairo, Egypt
Dyson, R.G., Allen, R., Camanho, A.S., Podinovski, V.V., Sarrico, C.S., and Shale, E.A., 2001, Pitfalls and Protocols in DEA. European Journals of Operation Research, 132(2), pp. 245–259.
Fallah-Fini, S., Triantis, K, and de la Garza, J.M., 2009, Performance Measurement of Highway Maintenance Operation Using Data Envelop-ment Analysis: EnvironEnvelop-mental Considerations. Proceedings of the 2009 Industrial Engineering Research Conference,
LAKIP BINA MARGA, 2011, Laporan Akuntabilitas Kinerja Instansi Pemerintah Direktorat Jenderal Bina Marga Tahun 2011, Departemen Pekerjaan Umum.
Ozbek, M., 2007, "Development of Comprehensive Framework for the Efficiency Measurement of Road Maintenance Strategies Using Data Envelopment Analysis, PhD dissertation, Virginia Polytechnic
Ozbek, M.E., de la Garza, J., and Triantis, K., 2010, Data Modeling Issues Faced During The Efficiency Measurement of Road Maintenance Using Data Envelopment Analysis, Journal of Infrastructure Systems, 16(1), pp. 30.
Peraturan Menteri Pekerjaan Umum Nomor: 21/PRT/ M/2010 tentang Organisasi dan Tata Kerja Unit Pelaksana Teknis Kementerian Pekerjaan Umum
Peraturan Pemerintah No. 34 Tahun 2006 tentang Jalan
Ramanathan, R., 2003, An Introduction to Data Envelopment Analysis-A Tool for Performance Measurement. Sage Publications, New Delhi, India
Roadmap Reformasi Birokrasi Direktorat Jenderal Bina Marga 2010-2014, Edisi 1: 9 Mei 2011.
TRB, 2009, Maintenance Management 2009: Presen-tations from the 12th AASHTO-TRB Mainte-nance Management Conference. Transportation Research Circular, No. E-C135, Transportation Research Board – of the National Academies.
Undang-Undang Republik Indonesia Nomor 38 Tahun 2004 tentang Jalan
Wang, L.-C., and Tsai, H.-Y., 2009, Evaluation of Highway Maintenance Performance Using Data Envelopment Analysis (DEA) in Taiwan. Journal of Marine Science and Technology, 17 (2), pp. 145-155
Wei, C.-H, and Schonfeld, P., 1998, A Research Framework for Cost-Effective Highway Mainte-nance Planning. Public Works Management & Policy, 2(4), pp. 340-349