IMPACT OF OIL PRICE SHOCKS AND EXCHANGE RATE
VOLATILITY ON STOCK MARKET BEHAVIOR IN NIGERIA
Adedoyin Isola Lawal
1; Russel O. C. Somoye
2;
Abiola A. Babajide
31Department of Accounting and Finance, Landmark University, P.M.B 1004, Ipetu Road, Omu Aran, Kwara State, 251101, Nigeria 2Department of Accounting, Banking & Finance, Olabisi Onabanjo University,
Ago Iwoye, Ogun State, 120107, Nigeria
3Department of Banking and Finance, Covenant University, KM. 10 Idiroko Road, Canaan Land, Ota, Ogun State, 112233, Nigeria
1[email protected]; 2,3[email protected]
Received: 17th June 2015/ Revised: 25th July 2015/ Accepted: 26th July 2016
How to Cite: Lawal, A.I., Somoye, R.O.C., & Babajide, A.A. (2016). Impact of Oil Price Shocks and Exchange Rate Volatility on Stock Market Behavior in Nigeria. Binus Business Review, 7(2), 171-177.
http://dx.doi.org/10.21512/bbr.v7i2.1453
ABSTRACT
The impact of exchange rate and oil prices fluctuation on the stock market has been a subject of hot debate
among researchers. This study examined the impact of both the exchange rate volatility and oil price volatility on stock market volatility in Nigeria, so as to guide policy formulation based on the fact that the nation’s economy was foreign induced and mono-cultured with heavy dependence on oil. EGARCH estimation techniques were employed to examine if either the volatility in exchange rate, oil price volatility or both experts on stock market volatility in Nigeria. The result shows that share price volatility is induced by both the exchange rate volatility and oil price volatility. Thus, it is recommended that policymakers should pursue policies that tend to stabilize the exchange rate regime on the one hand, and guarantee the net oil exporting position for the economy, that market practitioners should formulate portfolio strategies in such a way that volatility in both exchange rates and oil price will be factored in time when investment decisions are being made.
Keywords: oil prices, exchange rate, share prices, volatility, EGARCH
INTRODUCTION
The Arbitrage Pricing Theory (APT), according to Ross (1976), provides the theoretical background through which multifactor framework is factored into stock market price determination and volatility mechanism. Ever since 1976, when the theory was propounded, some literatures have inquired into stock market behaviors using some variables. The theory predicts that any anticipated or unanticipated arrival of new information about macroeconomic fundamentals will exert on stock price behavior through the expected dividends, discount rate routes or both. This study intends to inquire into the volatility of the stock market as induced by volatility in the exchange rate
and volatility in oil price using monthly data sourced on the Nigerian economy from 1985-2014. Babajide et al. (2015) observed that understanding this relationship is crucial and important to virtually all the various economic agents. For the investors, on the one hand, insight from this relationship can be used to construct portfolio strategies. On the other hand, policy makers
will find this knowledge of inestimable value as it will
help in analyzing the transmissions channel between the variables, thus aid better policy formulation.
According to Basher et al. (2012), the existing literatures on the relationship between the three variables i.e. stock market prices, oil prices, and exchange rate can be broadly divided into two strands.
The first strand deals with literature on the relationship
Binus Business Review, 7(2), August 2016, 171-177
DOI: 10.21512/bbr.v7i2.1453
between the two strands of literature is yet to be explored especially from the emerging economies perspective. This becomes needful now given the current economic situation Nigeria finds herself. First, the nation is a mono-cultured economy with heavy dependence on oil. Second, the nation is bewitched with exchange rate difficulty. Fluctuations in any of these sectors can send signal to other sectors. Furthermore, Chinzara (2011) classified studies that inquired into the relationship between stock market and macroeconomic variables (exchange rate and oil prices inclusive) into two categories, the first set of literature studies the relationship at first moment strand using models like VAR, multivariate co integration, Autoregressive Distributed Lag, among others. The second set of literature studied the relationship at second moments based on the understanding that since there is a strong connection between stock market and the macroeconomic variables, volatility in the macroeconomic variables will exert on stock market behaviour. It is believed that studying the relationship between macroeconomic variables and the stock market prices at the second-moment framework yield better result required for meaningful policy formulation because it is the volatility of macroeconomic variables that make stock market planning difficult (Hsing, 2011; Babajide et al., 2016a; Babajide et al., 2016b).
Most of the literatures that inquired into the relationship using data from the Nigerian economy employed first-moment approach (Somoye & Ilo, 2008; Ologunde et al., 2006; Okoro, 2014; Gunu & Kilishi, 2010). The article tends to advance literature by inquiring into the relationship between the three variables from the second-moment strand. The question are does exchange rate volatility exert on stock market volatility in Nigeria? Does oil price volatility exert on stock market volatility in Nigeria? How volatile is the Nigeria stock market? These are the issues that this paper wants to address.
The rest of the article is as structured a follows: Section 2 provides the literature review; Section 3 presents the data and the methodology employed, Section 4 presents the interpretation of results while Section 5 concludes the study and offers recommendation for policy formulation.
As noted by Basher et al. (2012), the literatures examined the connection between oil price, exchange rate and stock market prices can be broadly divided into two streaming literature viz: literature on the relationship between oil price and stock price on the one hand; and literature between oil price and exchange rates on the other hand. The authors submitted that literature on the connection between these two classes- oil price - stock prices; and oil price - exchange rate nexus is very rear. Several recent literatures have examined the relationship between stock market and some selected macroeconomic variables, and between stock market volatility and oil price volatility especially for the developed economies. Some of these literatures are briefly examined here.
For the South African economy, literatures that
examined the relationship between the stock prices, exchange rate, and oil price can be found in a number of works, for instance, Jefferis and Okehalam (2000) examined the relationship between stock price and some macroeconomic variables for South Africa, Zimbabwe, and Botswana. Their result shows that a positive relationship exists between the stock market and real exchange rate. Chinzara (2011) observed that volatility in the exchange rate have a significant impact on stock market prices in the South Africa economy while the impact of oil price on the stock market is less important. Hsing (2011) observed that negative, inconsequential relationships exist between nominal effective exchange rate and South Africa stock market index. Gupta and Modise (2011) observed that a positive relationship exist between stock price and world oil price for the South Africa economies.
For the Chinese economy, Rong-Gang Cong et al. (2008) examined the interactive relationship between oil price volatility and the Chinese stock market from the period 1996-2007 using VAR estimation techniques and observed that oil price volatility have no significant impact on stock returns. However, the authors further observed that oil price volatility does have negative impact on share prices of oil companies on the floor of Chinese stock exchange (Hamma et al., 2014 ; Tsai, 2015).
Malik and Ewing (2009) examined the volatility transmission between oil prices and stock market prices on sectoral basis for the US economy for the period 1992-2008 using BEKK-GARCH (1,1) and observed that there exist significant transmission of stock volatility flow from oil price to the various sectors studied.
Oberndorfer (2009) examined the relationship between the development of the energy market, price of energy and stock prices in Eurozone from 2002-2007 using ARCH and GARCH estimation techniques, and observed that a negative connection exists between oil stock market return and price volatility for the Eurozone.
Aloui and Jammazi (2009) used Markov regime switching estimation techniques to examine the conditional correlations and volatility spill over between stock market and crude oil index for the economies of France, Japan and UK for the period of 1998-2009, and observed that increase in oil price shocks significantly influence stock market volatility for the three economies (Aloui et al., 2014 ; Stavros et al., 2014 ).
than other economies (Kuwait, Oman, UAE, Bahrain, Qatar, the UK and the US) studied (Arouri et al., 2011; Arouri et al., 2012; Awartani & Maghyereh, 2013).
Similarly, Chuanguo and Chena (2011) used ARJI (-ht)- GARCH models to estimate data sourced from 1998-2010 on Chinese economy to investigate the impact of global oil price volatility on the Chinese stock market and observed that a positive relationship exist between world oil prices and China’s stock return (Li et al., 2012; Liao, et al., 2015)
Fillis et al. (2011) advanced literature by using DCC-GARCH model to enquire into the time – varying correlation between stock market prices and oil prices for both oil importing and exporting economies between 1997 and 2009 and observed that a negative relationship exists between oil price, and all the stock market investigated except for the 2008 financial crisis era (Sadorsky, 2012; Basher et al., 2012; Mollick & Assefa, 2013).
The relationship between exchange and stock prices fluctuation can be traced to the works of Agrawal (2010) who examined the correlation between the dual using developed economies data. Later on Bahmani-Oskooe and Sohrabian (1992) used cointegration estimation techniques to examine the relationship between the two variables and documented that a bi-directional causality exist between the two in the short run though no long run relation exists between them. Similarly, Ajayi and Mougoue (1996) used Error Correction Model (ECM) and causality test to analyze daily data from 1985 to 1991 for eight developed economies, and observed that upwards shift in the domestic stock price impact negatively on the domestic currency in the long run. They also documented that currency depreciation (Exchange rate fluctuation) impacts negatively both at the short and long runs on the stock market for the economies studied (Ajayi et al., 1998).
For the Asian economies, Abdalla and Murinde (1997) observed that for the Indian, Korean and Pakistani economies causality is from exchange rate fluctuation to stock prices movement; however, causality is from stock market to exchange for the Philippines (Ho & Chia-Hsing, 2015). This contradicts Smyth and Nandha (2003) findings where the authors stated that no relationship exists between the variables in the long run for Pakistan, India, Bangladesh and Sri Lanka, though unidirectional causality exists between exchange rate and stock prices for Indian and Sri Lanka. Morley and Pentecost (2000) identified the impact of exchange rate controls on the G-7 countries in altering the relationship between the exchange rate and the stock market prices in 1980. Ibrahim and Aziz (2003) documented that a negative relationship exists between exchange rate and stock market for Malaysia between 1977 and 1998.
Ozair (2006) observed that no causality nor co integration exist between the two variables for the US economy, his findings were in line with that of Nieh and Lee (2001) who discovered no significant causality exist between the dual but contradicts Vygodina
(2006) who established causality for large – cap stocks exchange rates. Pan et al. (2007) established the existence of bidirectional causality between exchange and stock price for Hong Kong before the 1997 Asian cries and a unidirectional causality between exchange rate and stock prices for the economies of Japan, Malaysia, Thailand, while Korea and Singapore exhibit unidirectional relationship from stock prices to exchange rate (Sener et al., 2011). Agrawal (2010) observed that no correlation exists between the two variables for the Indian economy using daily data from October 2007 to May 2009, and that unidirectional relationship exist running from stock return to exchange rate (Takeshi, 2008).
The preceding presents the review of empirical literatures on the volatilities of stock markets as induced by oil price and exchange rate fluctuations. From the review it can be deduced that no significant work has been done to examine the relationship using data from Nigerian economy, though Nigeria plays significant role in global oil market and has the largest economy in Africa sub-region, thus, this study tends to advance literature by investigating the relationship between the trio so as improve decision making as per portfolio selection by investors on the one hand and good policy formulation by policy makers on the other hand especially now that the policy makers in Nigeria are advocating for exponential economic growth cum with eagerness of the stock market to recover from the losses of the recent global economic meltdown/ financial crisis.
METHODS
The data for this study were sourced from the Central Bank of Nigeria Statistical Bulletin (various issues). The data are in monthly form starting from 1985 to 2014. The base year 1985 was chosen because that was the year data on All Share Index became known publicly in Nigeria, while 2014 was chosen because it is the month with most recent data as at date. The All Share Index comprises of all the stock indexes on the Nigerian Stock Exchange, the data is readily available from the Central Bank of Nigeria Statistical Bulletin. The Oil Price Index is the price of the Nigerian crude oil (Bonny Light - Brent) at the international market, while the exchange rate is the price of one Nigeria naira to the USD. Data on all the variables were transformed into natural logarithms to achieve stationarity invariance.
The model for this article is specified as follows:
ASI = f (OIL, EXC) (1)
Where ASI is the All Share Index, which is a proxy of the stock market index, OIL is the proxy of the oil price index at the international market (Brent), and the exchange rate is the price of the Nigerian local currency to a US Dollar.
expand equation (1) as follows:
ASI = α0 + OILβ1 +EXCβ2 + µt (2)
In achieving our goal of investigating the impact of the volatility of the exchange rate and oil prices on stock prices volatility, we employed the EGARCH estimation techniques.
The EGARCH was developed by Nelson (1991) as an improvement on the earlier version of the GARCH models (Lawal et al., 2013, 2015; Babajide et al, 2016b), it is expressed as follows:
Where represents the conditional variance for
year t; is the conditional volatility prediction for
year t; symbolizes the standardized shock for year t. It can be seen that the number of standard deviation
has deviated from its meanwhile symbolizes the error term of a prediction model of a time series.
Both the and represents the news
impact curve of the model. The is the standardized
innovation at t-1 and is usually centered at = 0.
Given that is conditionally normal, will follow
the half normal distribution with the mean such that
is the absolute standardized innovation at t-1.
To deepen the knowledge of the news impact of the model, Engle and Ng (1993) derive equation (3) as follows
(4)
By re-arranging the terms, it can be derived that:
(5)
In this case, signifies a normal variate skewed to the left, while γ determines the degree of skewness. By rearranging equation (5), the authors will be able to resolve the combined impact of α and γ in the results. Thus it can be derived that
when > 0 (6)
and
when (7)
RESULTS AND DISCUSSIONS
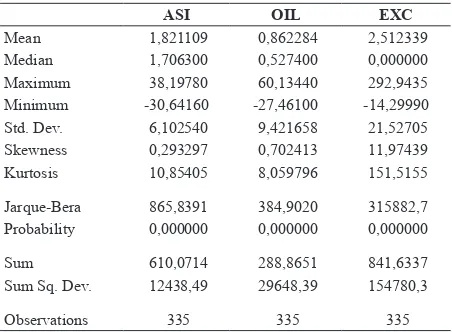
Table 1 presents the descriptive statistics of all the variables used in this work. The authors employed the Jarque-Bera (JB) test to examine the normality of the time series used to know if the series follow the normal probability distribution. From the table, it can be deduced that the JB test result is large for all the variables; thus the authors concluded that the variables are not normally distributed. In other word, the null hypothesis of normality for the variables can be rejected.
Table 1 Descriptive Statistics of All the Variables
ASI OIL EXC
Mean 1,821109 0,862284 2,512339 Median 1,706300 0,527400 0,000000 Maximum 38,19780 60,13440 292,9435 Minimum -30,64160 -27,46100 -14,29990 Std. Dev. 6,102540 9,421658 21,52705 Skewness 0,293297 0,702413 11,97439 Kurtosis 10,85405 8,059796 151,5155
Jarque-Bera 865,8391 384,9020 315882,7 Probability 0,000000 0,000000 0,000000
Sum 610,0714 288,8651 841,6337 Sum Sq. Dev. 12438,49 29648,39 154780,3
Observations 335 335 335
Source: Authors’ computation from Eveiw 7.2
The result of the correlation analysis is shown in the Table, from the result, it can be deduced that both negative and positive connection exist between the variables. For instance, a positive relationship occurs between the All Share Index (ASI) and Oil price (OIL), while the relationship exhibits existence of a negative sign between All Share Index and Exchange rate (EXC).
Table 2 Correlation Matrix Results
ASI OIL EXC
ASI 1,000000 0,019369 -0,038859
OIL 0,019369 1,000000 0,030896
EXC -0,038859 0,030896 1,000000
Source: Authors’ computation from Eveiw 7.2
Table 3 ADF Unit Root Test
Variables ADF Statistics
Critical
Value DW Lag Inference
ASI -6.,87866 -3,449977* 1,983013 0 1(0)
OIL -3,449738 -3,449738* 1,981623 0 1(0)
EXCHANGE -18,41846 -2,571335 2,00062 0 1(0)
Source: Authors’ computation from Eveiw 7.2
* 1% significant level
Based on the research in Table 3, it can be deduced that the unit root for all the variables are stationary at the level, since the critical values are greater than ADF statistics. Thus the null hypothesis is rejected.
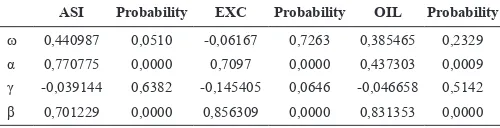
Table 4 Results of the Volatility Measurement of the Variables
ASI Probability EXC Probability OIL Probability
ω 0,440987 0,0510 -0,06167 0,7263 0,385465 0,2329
α 0,770775 0,0000 0,7097 0,0000 0,437303 0,0009
γ -0,039144 0,6382 -0,145405 0,0646 -0,046658 0,5142
β 0,701229 0,0000 0,856309 0,0000 0,831353 0,0000
Source: Authors’ computation from Eveiw 7.2
The coefficient of α is positive and significant at 1% level of significant; this implies that large shocks of both positive and negative signs will lead to increase in volatility. The negative sign of the coefficient of γ shows the existence of leverage effect, and that bad news has a larger impact on stock return volatility. The insignificant level of the coefficient of γ is an indication that the presence of leverage effect is not pronounced during the sample period. The implication is that shocks increase volatility of the All Share Index regardless of the signs.
The coefficient of β (magnitude of volatility) is significant at 1% level of significant and positive at 0,0701229. This also indicates that the impact of the magnitude of volatility as induced by shock on the All Share Index is large and significant.
The magnitude of the volatility is high at 0,8561 and significant. This indicates that volatility in the exchange rate has significant impact on volatility in stock market price. With the coefficient of α being positive and significant at 1% level of significant and γ, though negative is not significant. This implies that large stocks in exchange rate increase volatility in the All Share Index.
Alike with the exchange rate coefficient, the magnitude of the volatility (β) is high at 0,831353 and highly significant at 1% significant level, an indication that volatility in oil price has significant impact on the volatility of stock market prices. Next, it can be seen that the coefficient of α is significant at 1% level of significant and positive. On the other hand,
the coefficient of γ though negative is not significant. This implies large stock in oil price volatility will increase volatility in the stock market. The negative sign of – 0,046658 indicate that there is presence of leverage effects in the series and that bad news on oil price volatility exerts a larger impact on stock market volatility.
CONCLUSIONS
This article examines the stock price volatility as it relates with both the exchange rate volatility and the oil price volatility using monthly data from the Nigerian economy for the period of 1985 – 2014 sourced from the Central Bank of Nigeria Statistical Bulletin (various issues). The EGARCH estimation techniques are employed to examine the relationship. The results show that evidence abounds that stock market volatility is induced by both exchange rate volatility and oil price volatility. From the result of exchange rate volatility estimates, the coefficients of the magnitude of the volatility (β) and that of the alpha (α) are significant at 1% level of significant, an indication that large shocks in the exchange rate increase volatility in the share price. This is supported by earlier works like Chinzara (2011), Gupta and Modise (2011) for South African economy, Abdalla and Murinde (1997) for India, Korea and Pakistan but contradicts Ibrahim and Aziz (2003) results on the Malaysian economy, Ozair (2006) for the US, Takeshi (2008) for the Indian economy. Similarly, the result from the oil price volatility estimates shows that both the magnitude (β) and that of the α are high, positive and significant at 1% level of significance, this implies that large innovation in the oil price will provoke volatility in the stock market to increase. Our result on oil price – stock market relationship is similar to that of Aloui and Jammazi (2009), Li, et al. (2012) for the economies of UK, France, and Japan, Chuanguo and Chena (2011) for the Chinese economy but contradicts Fillis et al. (2011).
Based on these findings the study strongly recommends that the policy makers should pursue policies that stabilize the exchange rate. Also, since Nigeria is both an oil exporting and importing economy, the policy that guarantee positive net oil exportation position for the economy should be pursued. For investors or market practitioners, the study recommends that exchange rate and the oil price volatility should be considered as a vital source of unavoidable risk when formulating hedging and portfolio selection strategies.
REFERENCES
Abdalla, I. S., & Murinde, V. (1997). Exchange rate and Stock price interaction in Emerging Financial Markets: Evidence on India, Korea, Pakistan and the
Philippines. Applied Financial Economics, 7(1), 25
Agrawal, G., Srivastav, A. K., & Srivastava, A. (2010). A study of exchange rates movement and stock market
volatility. International Journal of Business and
Management, 5(12), 62 – 73.
Ajayi, R. A., & Mougoue, M. (1996). On the Dynamic Relation between stock prices and exchange rates. Journal of Financial Research, 19(2), 193 – 207. Ajayi, R. A., Friedman, J., & Mehdian, S. M. (1998). On
the relationship between stock returns and exchange
rates: Test of granger causality. Global Finance
Journal, 9(2), 241- 251.
Aloui, C., & Jammazi, R. (2009). The effects of crude oil shocks on stock market shifts behavior: a regime
switching approach. Energy Economics, 31(5), 789
– 799.
Aloui, C., & Hkiri, B. (2014). Comovements of GCC emerging stock markets: New evidence from
wavelet coherence analysis. Economic Modelling,
36, 421-431.
Arouri, M. E. H., Jouini, J., & Nguyen, D. (2012). On the impacts of oil price fluctuations on European equity markets: Volatility spillover and hedging
effectiveness. Energy Economics, 34(2), 611 – 617.
Arouri, M. E. H., Lahiani, A. & Nguyen, D. K. (2011). Return and Volatility transmission between world oil prices and stock markets of the GCC countries. Economic Modeling, 28(4), 1815 – 1825.
Awartani, B. & Maghyereh, A. I. (2013). Dynamic spillover between oil and stock markets in the Gulf
Cooperation Council Countries. Energy Economics,
36, 28 – 42.
Babajide A. A., Lawal A. I., & Somoye R. O. (2015). Monetary Policy Dynamics and the Stock Market Movements: Empirical Evidence from Nigeria. Journal of Applied Economic Sciences, X(8,(38)), 1179-1189.
Babajide A. A., Lawal A. I., & Somoye R. O. (2016a). Stock Market Response to Economic Growth and Interest Rate Volatility: Evidence from Nigeria. International Journal of Economics and Financial Issues, 6(1), 354-360.
Babajide A. A., Lawal A. I., & Somoye R. O. (2016b). Stock Market Volatility: Does our Fundamentals Matter? Economic Studies Journal, (3), 33 – 42.
Bahmani-Oskooee, M., & Sohrabian, A. (1992). Stock prices and the effective exchange rate of the dollar. Applied Economics, 24(4), 459 – 464.
Balli, F., Basher, S. A., & Jean Louis, R. (2013). Sectorial equity returns and portfolio diversification
opportunities across the GCC region. Journal of
International Financial Markets, Institutions and Money, 25 (C), 33-48.
Basher, S. A., Haug, A. A., & Sadorsky, P. (2012). Oil prices, exchange rates and emerging stock markets. Energy Economics, 34(1), 227 – 240.
Central Bank of Nigeria Statistical Bulletin (Various Issues). Chinzara, Z. (2011). Macroeconomic Uncertainty and
Conditional Stock Market Volatility in South Africa. South African Journal of Economics, 79(1), 27 – 49. Chuanguo, Z., & Chena, X. (2011). The impact of global oil
price shocks on China’s stock returns: Evidence from
the ARJI (-ht)-EGARCH model. Energy Economics, 36, 6627 – 6633.
Engle, R. F., & Ng, V. K. (1993). Measuring and testing the
impact of News on Volatility. Journal of Finance,
48(5), 1749 – 1778.
Fayyad, A., & Daly, K. (2011). The impact of oil price shocks on stock market returns: comparing GCC
countries with the UK and US. Emerging Markets
Review, 12(1), 61 – 78.
Fillis, G., Degiannakis, S. & Floros, C. (2011). Dynamic correlation between stock market and oil prices: The case of oil-importing and oil-exporting countries. International Review of Financial Analysis, 20(23), 152 – 164.
Gunu, U., & Kilishi, A. A. (2010). Oil Price Shocks and the Nigeria Economy: A Variance Autoregressive
(VAR) Model. International Journal of Business and
Management, 5(8), 39-49.
Gupta, R., & Modise, M. P. (2011). Macroeconomic variables and South African stock return predictability. Economic Modelling, 30, 612-622.
Hamma, W., Anis J., & Ahmed G. (2014). Effect of Oil Price Volatility on Tunisian Stock Market at Sector-level and Effectiveness of Hedging Strategy. Procedia Economics and Finance, 13, 109 -127.
Hammoudeh, S. M., Yuan, Y., & Michael McAleer, M. (2009). Shock and volatility spillover among equity
sectors of Gulf Arab stock markets. The Quarterly
Review of Economics and Finance, 49(3), 829 – 842. Ho, L-C, & Chai-Hsing, H. (2015). The nonlinear
relationship between stock indexes and exchanges
rate. Japan and the World Economy,33, 20 – 27.
Hsing, Y. (2011). The stock market and macroeconomic variables in a BRICS country and policy implications. International Journal of Economics and Financial Issues, 1(1), 12 – 18.
Ibrahim, M., & Aziz, M. (2003). Macroeconomic variables and Malaysian equity market: a view through rolling
subsamples. Journal of Economic Studies, 30(1), 6
– 27.
Jefferis, K. R., & Okeahalam, C. C. (2000). The Impact of economic fundamentals on stock markets in
Southern Africa. Development Southern Africa,
17(1), 23 – 51.
Lawal A. I., Oloye, M. I., Otekunrin, A. O. & Ajayi, S. A (2013). Returns on Investments and Volatility Rate
in the Nigerian Banking Industry. Asian Economic
and Financial Review, 3(10), 1298-1313.
Lawal, A. I., Awonusi, F., & Oloye, M. I. (2015). All share price and inflation volatility in Nigeria: An application of the EGARCH model. Euroeconomica, 34(1), 75 – 82.
Li, S-F., Zhu, H-M., & Yu, K. (2012). Oil prices and stock market in China: A sector analysis using
panel cointegration with multiple breaks. Energy
Economics, 34(6), 1951–1958.
Liao, Shu-Yi, Sheng-Tung Chen, & Mao- Lung Huang. “Will the oil price change damage the stock market in a bull market? Are-examination of their conditional
relationships”, Empirical Economics, 50(3), 1135–
Malik, F., & Ewing, B. T. (2009). Volatility transmission between oil prices and equity sector returns. International Review of Financial Analysis, 18(3), 95 – 100.
Mollick, A. V., & Assefa, T. A. (2013). US stock returns and oil prices: The tale from daily data and the 2008 - 2009 financial crises. Energy Economics, 36, 1 – 18. Morley, B. & Pentecost, J. E. (2000). Common Trends and
Cycles in G-7 countries exchange rates and stock
prices. Applied Economic Letters, 7, 7 – 10.
Nelson, D. B. (1991): Conditional Heteroscedasticity in
Asset Returns: A New Approach. Econometrica,
59(2), 347 – 370.
Nieh, C. C., & Lee, C. F. (2001). Dynamic relationship between stock prices and exchange rates for G7
countries. The Quarterly Review of Economics and
Finance, 41, 477 – 490
Oberndorfer, U. (2009). Energy prices, volatility and stock
market: evidence from the Eurozone. Energy Policy,
37, 5787 – 5795.
Okoro, E. G. (2014). Oil Price Volatility and Economic Growth in Nigeria: a Vector Auto-Regression
(VAR) Approach. Acta Universitatis Danubius:
Oeconomica, 10(1), 70-82.
Ologunde, A. O., Elumilade, D. O., & Asaolu, T. O. (2006). Stock Market Capitalization and Interest Rate
in Nigeria. A time series Analysis. International
Research Journal of Finance and Economics, 1(4).
Ozair, A. (2006). Causality between stock price and
exchange rates: A case of the United State (Unpublished master’s thesis). Florida Atlantic University, Florida, FL.
Pan, M. S., Fok, R. C. W., & Liu, Y. A. (2007). Dynamic linkages between exchange rates and stock prices:
Evidence from East Asian Markets. International
Review of Economics and Finance, 16(4), 503 – 520. Rong-Gang C., Yi-Ming W., & Jian-Lin J. (2008).
Relationship between oil price shocks and stock
market: An empirical analysis from China. Energy
Policy, 36(9), 3544 – 3553.
Ross, S. A. (1976). The Arbitrage Pricing Theory of Capital
Asset Pricing. Journal of Economic Theory, 13,
341-360.
Sadorsky, P. (2012). Correlations and volatility spillover between oil prices and the stock prices of clean energy
and technology companies. Energy Economics, 34,
248 – 255.
Sener, S. & Pirin̤ciler, E. C. (2011). Returns Of Investment Tools In Recession Periods For Turkey, Procedia - Social and Behavioral Sciences, 24, 72 Р88.
Smyth, R. and Nandha, M. (2003). Bivariate causality between exchange rates and stock prices in South
Asia. Applied Economics Letters, 10, 699 – 704.
Somoye, R. O. C. & Ilo, B. M (2008). Stock Market Performance and Nigeria’s Economic Activities. Lagos Journal of Banking, Finance, and Economic Issues, Department of Finance, University of Lagos,
2(1), 133-145.
Stavros D., Filis, G., & Kizys, R. (2014). The Effects of Oil Price Shocks on Stock Market Volatility: Evidence
from European Data. The Energy Journal, 35(1), 35
– 56.
Su-Fang Li, Hui-Ming Zhu & Keming Yu (2012). Oil prices and stock market in China: A sector analysis using
panel cointegration with multiple breaks. Energy
Economics, 34, 1951 – 1958.
Takeshi, I. (2008). The causal relationship in mean and variance between stock returns and foreign
institutional investment in India. The Journal of
Applied Economic Research, 9, 321 – 351.
Tsai, C-L. (2015). How do U.S. stock returns respond differently to oil price shocks pre-crisis, within the financial crisis, and post-crisis? Energy Economics, 50, 47 – 62.
Vygodina, A. V. (2006). Effects of size and international exposure of the US firms on the relationship between
stock prices and exchange rates. Global Finance