CHAPTER III
RESEARCH METHODOLOGY
In this part, the writer described about research method that was used in conducting the
research. It is purposed to answer the problem of the study. This chapter consisted of
research design, population and sample, instruments of the study, validity, reliability, data
collection procedures, and data analysis.
A. Research Design
In this study, it is used the quantitative approach. According to Dornyei,“Quantitative research involves data collection procedures that result primarily in numerical data which is
then analysed primarily by statistical method.”37 It was the study which measures the effect of using Interactive media in teaching writing of descriptive text.
In the study, the writer used quasi-experimental design. Cook and Campbell in
Dornyei state quasi-experiments are similar to true experiments in every respect except that
they do not use random assignment to create the comparisons from which treatment-caused
change is inferred.38 Quasi-experimental designs are similar to randomized experimental
designs in that they involve manipulation of an independent variable but differ in that
subjects are not randomly assigned to treatment groups. Because the quasi-
experimental design does not provide full control, it is extremely important that the
researchers be aware of the threats to both internal and external validity and considers these
factors in their interpretation.
37
Zoltan Dornyei, Research Method in Applied Linguistics,Quantitative, Qualitative, A mixed Methodologies, New York: Oxford University Press, 2007.p.24.
Although true experiments are preferred, quasi-experimental designs are considered
worthwhile because theypermit researchers to reach reasonable conclusions even though full
control is not possible. The use of this design, basically, because of the problem of the study
in which, the writer want to find the answer may be answered using quasi – experimental design.39 In a typical school situation, schedules cannot be disrupted nor
classes reorganized to accommodate a research study. In such a case, one uses groups
already organized into classes or other preexisting intact groups. The nonrandomized
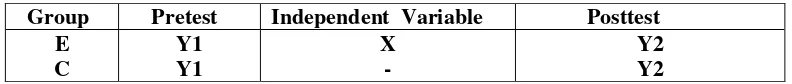
control group, pretest–posttest design is one of the most widely used quasi-experimental designs in educational research.40
Table 3.1
Nonrandomized Control Group, Pretes-Posttest Design
Group Pretest Independent Variable Posttest E
C
Y1 Y1
X -
Y2 Y2
In this study, the writer take the tenth grade students of SMKN 4 Palangka Raya as
the subjects of the study. The subjects divided into two groups, the first group become
experiment group that teaching by interactive video media and the second group become
control group that teaching by without interactive video media.
B. Population and Sample 1. Population
The larger group about which the generalization is made is called a
population. The population is defined as all members of any well- defined class of
people, events, or objects.41 The population of this study is the tenth grade of SMKN- 4
39
Donald Ary and Lucy Cheser Jacob,Chris Sorensen ,and Ashgar Razavieh , .Introduction to Research in Education Eight Edition. Canada : Wardsworth, 2010,p..271.
40Ibid . p.316. 41
Palangka Raya. The number of population was about 95 students. It was clssified into three
classes.
Table 3.2
The Number of the Eighth Grade Students of SMKN 4 Palangka Raya
No Classes The Number of Students
1. X
Multimedia 1
25
2. X
Multimedia 2
25
3. X
Multimedia 3
23
4. X
Kriya Tekstil 20
93
2 . Sample
The small group that is observed is called a sample. A sample is a portion of a
population.42 To take the sample,the writer use cluster sampling because it is unit chosen and
not an individual,but rather a group of individuals. In this study the writer determine the two
classes into two groups. They X Multimedia 1 as experimental group and X Multimedia 2 as
control group. Experimental group consist of 25 students and control group consist 25
students as the sample. In this study, the writer took X Multimedia 1 and X Multimedia 2
classes. The reasons why the writer took X Multimedia 1 and X Multimedia 2 classes as the
sample of the study because those classes have represented the average English achievement
of the whole of population.
Table 3.3 The Number of Sample
No Classes Groups Number of Students
1. X Multimedia1 Experiment 25
2. X Multimedia 2 Control 25
Total 50
C. Instruments of The Study
The data were very important in the study. They are needed to support and prove the
study itself. The writer can be helped by them in order to find the aims of the study. They are
to measure the effectiveness of interactive video media toward the students’ writing score in descriptive text of the tenth grade students at SMKN 4 Palangka Raya. In this study, the
writer uses a test to collect the data because the students’ writing score can be known by using test.
1. Test
A test is an instrument or procedure designed to elicit performance from learners with
the purpose of measuring their attainment of specified criteria. Tests are almost always
identifiable time periods in a curriculum when learners muster all their faculties to over peak
performance, knowing that their responses are being measured and evaluated. Tests can be
useful devices among other procedures and tasks designed to assess students.43 Brown states
a test, in plain word, is a method of measuring a person’s ability or knowledge in a given
domain.44 A test may be defined as an activity whose main purpose is to convey (usually to
the tester) how well the tester knows or can do something.45
In the study, the writer assignes the students to write descriptive text based on the
story of descriptive text in interactive video media shown. The test do twice, they are pretest
and posttest in experimental group and control group. The pretest was taken at Monday,
October 28, 2013 at 07.15 - 08.35 in experimental group and Tuesday, October 29, 2013 at
06.30 – 08.00 in control group. And the posttest was taken at Wednesday, November 20 , 2013 at 08.00 – 09.30 in experimental group and ,Tuesday November 26 ,2013 at 06.30 –
43
H. Douglas Brown, Teaching by Principles an Interactive Approach to Language Pedagogy (Second Edition), p. 402.
44
Ibid., p. 384. 45
08.00 in control group. The results of writing test that assigned by the writer for experimental
and control group showed that the students who were taught using the interactive video media
got higher score than students who were taught without using interactive video media.
Based on the result of hypothesis test calculation, it was found that the value of tobserved
was greater than the value of ttable at 5% and lower at 1% significance level or 2.01 < 4.046 >
2.68. It meant Ha was accepted and Ho was rejected. In addition, the result of t test
calculation using SPSS 18.0 found that the interactive video media gave significance effect
on the students’ English scores. It proved by the value df tobserved was greater than ttable both at
1% and 5% the level of significance or 2.01 < 4.046> 2.68. (See Chapter IV).
2. Documentation
The writer collected some documents from the place of study. The documentation is
used to collect the data. Using the document would help the writer to describe the situation of
school. The data that would be collect in this research are:
1) Numbers of students of tenth grade students at SMK 4 Palangka Raya.
2) The result of student score at teaching writing in descriptive text.
3) The curriculum uses at SMK 4 Palangka Raya.
D. Instrument Try Out
In order to prove the test were suitable to the students who were the sample of this
study, the writer would be conducting a try out test. Then the writer chose the students in the
same school but different class to try out the test. The try out test would be conduct in SMK
Palangka Raya at X Multimedia 3. The writer held the try out process on Wednesday, August
28, 2013: it was the try out process with followed by 23 students. If the result is valid, it
meant that the test as the instrument of this study are suitable to be given.
These are the procedures that in carrying out this try out as follows:
2) The writer held the try out test to the students.
3) The writer gave score to the students answer sheet.
4) The writer calculated the result of the test by using formula.
5) The writer analyzed the data obtained to know the instrument validity and instrument
reliability.
6) If the result is valid, it means that the test item as the instrument of this study are suitable
to be given.
E. Instrument Validity
The most important variable in judging the adequacy of measurement instrument is
validity. Validity refers to the extent to which the results of an evaluation procedure serve the
particular uses for which they are intended.46
Ary and et al. state validity is defined as the extent to which scores on a test enable one
to make meaningful and appropriate interpretations.47Validity is the instruments. Historically,
validity was defined as the extent to which an instrument measured what it claimed to
measure. The focus of recent views of validity is not on the instrument itself but on the
interpretation and meaning of the
scores derived from the instrument.
Historically, validity define as the extent to which an instrument measure what it claime
to measure. The focus of recent views of validity is not on the instrument itself but on the
interpretation and meaning of the scores derive from instrument. 48
Three types of validation are important in the role as a classroom teacher: content
validity, face validity, and construct validity.49
46
Wilmar Tinambunan, Evaluation of Student Achievement, Jakarta: Education Department,1988,p.11. 47
Donal Ary, Lucy Cheser Jacobs, Chris Sorensen, and Asghar Razavieh, Introduction to Research in Education Eight edition, Canada:Wardsworth,2010, p. 224.
1. Content Validity
Sudijono in Mayasyarah states content validity of a learning result test is the
validity that is gained after doing the analysis, investigation or examination of the
content that is contained in the learning result test.50 Djiwandono in Mayasyarah states
content validity demands a content suitability between a skill being measured and a used test
to measure. Dornyei states content validity concerned expert judgment about test content.51
Table 3.4
Signification of Content Validity
Indicator of the study Type of test Total question Students are able to write
a text in form of descriptive text
Performance test One question
2. Face Validity
Face validity is almost always perceived in terms of content: if the test samples
the actual content of what the learner has achieved or expects to achieve, then face validity
will be perceived. Ary et al. state face validityis a term sometimes used in connection with a
test’s content. Face validity refers to the extent to which examinees believe the instrument is
measuring what it is supposed to measure.52
3. Construct Validity
Dornyei states construct validity showed how the test results conformed
49
H. Douglas Brown, Teaching by Principles an Interactive Approach to language Pedagogy . Second Edition , 1987, p.338.
50 Mayasyarah, The Effectiveness of Video Compact Disc as an Audiovisual Medium toward The
Students’ Listening Comprehension Score of The Tenth Grade Students at MAN Model of Palangka Raya,
Unpublished Thesis, Palangka Raya: STAIN Palangka Raya, 2010.p. 16. 51
Zoltan Dornyei, Research Method in Applied Linguistics, Quantitative,Qualitative, A mixed Methodologies, New York: Oxford University Press, 2007,p.24.
to a theory of which the target construct was a part.53
Djiwandono in Mayasyarah states the construct validity is to show them finding score
that reflect the same construct with the target skill of its measuring.54
In this study, the writer use inter – rater method( test of validity) to correct the
student’s scores. Inter-rater was two rathers who score the students’ writing to get the score
compositions as possible. The writer use product moment correlation as the formula to
calculate the validity from the test result.55 The formula :
Where :
r
xy : Index Correlational Number “ r ’’Product MomentN : Number of Cases
∑ Multiplication Result between score X and score Y ∑ : Total value of score X
∑ : Total value of score Y
Riduan in Mayasyarah states the criteria of interpretation the validity: 56
High Interpretation
0.800 - 1.00 Very High Validity
0.600 – 0.799 High Validity
0.400 – 0.599 Fair Validity
0.200 – 0.399 Poor Validity
0.00 -0.199 Very Poor Validity
53
Zoltan Dornyei, Research Method in Applied Linguistics, Quantitative,Qualitative, A mixed Methodologies, New York: Oxford University Press, 2007.p.51.
54
Mayasyarah, The Effectiveness of Video Compact Disc as an Audiovisual Medium toward The
Students’ Listening Comprehension Score of The Tenth Grade Students at MAN Model of Palangka Raya,
Unpublished Thesis, Palangka Raya: STAIN Palangka Raya ,2010.p.17. 55
Anas Sudijono, Pengantar Statistik Pendidikan, Jakarta: PT Raja Grafindo Persada, 1997,p.193. 56
Mayasyarah, The Effectiveness of Video Compact Disc as an Audiovisual Medium toward The
Students’ Listening Comprehension Score of The Tenth Grade Students at MAN Model of Palangka Raya,
F. Reliability
Reliability indicates how consistently a test measures whatever it does measure.57
Reliability is concerned with the effect of such random errors of measurement on the
consistency of scores. But some errors involved in mesurement are predictable or
systematic.58 Reliability procedures are concerned with determining the degree of in
consistency in scores caused by random error.59 The reliability of a measuring instrument is
the degree of consistency with which it measures whatever it is measuring. Wilkinson in
Dorney state reliable is a property of the scores on a test for a particular population and
testtakers.
In rather reliability, there are inter-rater reliability and intra rater reliability. A simple
way to determine the reliability of ratings is to have two more observers’ ratings. The
resulting correlation is called the interrater.60It indicate accuracy in scoring compositions of
two different raters.Meanwhile, intra- rater reliability indicated accuracy in scoring
composition of a rater in correcting the student’s test score twice. In this study, the writer
used inter-rater to correct the students score. The scoring rubric for the measurement as
follow:61
Table 3.4 The Scoring Rubric for The Measurement of Writing Test
Components Score Level Criteria
27-30 Very Good to
Excellent
Very good in mastering the problem; the content is very solid complete and comprehensive;very appropiate with the problem and title.
57
Donal Ary, Lucy Cheser Jacobs, Chris Sorensen, and Asghar Razavieh, Introduction to Research in Education Eight edition, Canada: Wardsworth, 2010, p.224.
58
Ibid., p.238. 59
Ibid., p.239. 60
Ibid., p.256. 61
Content
22-26
Fair to Good
Mastering the problem;the content is adequate; almost complete and comprehensive; approprite with the problem and title,but is less detail.
17 -21 content is not sufficient; not relevant with the title and problem; there is not enough material to evaluate.
Organization
18-20 Very Good to
Excellent
Very harmonious; the main ideas are expressed and developed clearly. Organized well,logical order; close
relationship amoong part
(coheessive).
14-17 Fair to Good Less harmonious; thye main ideas are not organized well; less developed; using grammar, sequence sentences,
phrase and word
Error and difficult in using grammar, sequence sentences, phrase and word form,preposition,etc.
5-10 Very Poor
Almost not mastering the grammar; full errors in grammar; cannot be understood; not enough material to chosen and use of exact and effective words ,mastery in word form and formation.
14-17
Fair to Good
Repertory of word is enough,the chosen and use of words occasional not exactly, but the meaning not obscured.
10-13 Poor to
Average
7 – 9 Very Poor
Repertory of words are very limited until can not communicate the
Fair to Good Occasional error in applying the rule, but not hazy the main content and meaning.
3
Poor to Average
Most error in applying the rule of the spelling and writing difficult to read the writing, main content and meaning are hazy.
2
Very Poor Does not master the rule of the spelling and writing , full error in spelling, punctuation, the use of capital letter, arrange paragraph, difficult to read the writing, not enough information to evaluate.
G. Data Collection Procedures
In this study, the writer uses some procedures to collect the data. The procedures
consist of some steps as follow:
1. The writer observes the school by headmasters’ permission.
2. The writer asked the class with the English teacher who taught English in the class
that become the class of research:
a. The number of the class.
b. The number of students.
3. The writer determined the class into experimental group and control group.
4. The writer gave pre test to the experimental group and control group. The schedule of
pre-test for the experiment and control group is shown in table 3.5 and 3.6.
5. The writer taught the experimental group using interactive video media. The schedule
Table 3.5
The Schedule of the Teaching Activities in the Experiment Group
Meeting Date Time Material
Pre Test Monday, October 28 , 2013 07.15-08.35 Pre –Test
1 Wednesday, October 30, 2013 08.00-09.30 Descriptive Text
2 Monday , November 4, 2013 07.15-08.35 Describe Kahaya Bridge
3 Wednesday,November 6, 2013 08.00-09.30 Describe Kahayan River
4 Monday, November 11, 2013 07.15-08.35 Describe Tahai Lake
5 Wednesday,November 13,2013 08.00-09.30 Describe Banama Stone
6 Monday, November 18,2013 07.15-08.35 Discussing
Post Test Wednesday,November 20,2013 08.00-09.30 Post Test
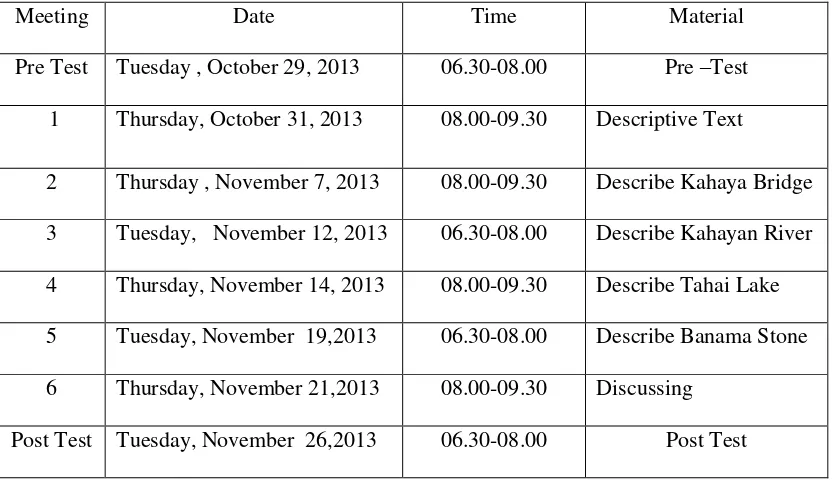
6. The writer taught the control group using pictures media.
The schedule of the teaching activities in the control group is shown in the table 3.6.
Table 3.6
The Schedule of the Teaching Activities in the Control Group
Meeting Date Time Material
Pre Test Tuesday , October 29, 2013 06.30-08.00 Pre –Test
1 Thursday, October 31, 2013 08.00-09.30 Descriptive Text
2 Thursday , November 7, 2013 08.00-09.30 Describe Kahaya Bridge
3 Tuesday, November 12, 2013 06.30-08.00 Describe Kahayan River
4 Thursday, November 14, 2013 08.00-09.30 Describe Tahai Lake
5 Tuesday, November 19,2013 06.30-08.00 Describe Banama Stone
6 Thursday, November 21,2013 08.00-09.30 Discussing
Post Test Tuesday, November 26,2013 06.30-08.00 Post Test
8. The writer gave scores to the data from experimental group and the control group.
9. The writer started to analyze the obtain data from the pre test and post test using t test.
10.The writer interpreted the data analysis result.
11. The writer concluded the activity of the study whether the audio visual media gave effect
to the students’ scores in writing descriptive text or not, based on the obtain data.
H. Data Analysis Procedures
The writer did some procedures in the data analysis. They were:
1. The writer collected the obtain scores.
2. The writer arranged the obtain scores into the distribution of frequency of scores
table.
3. The writer calculated the mean, median, modus, standard deviation, and standard error
of variable X1 from the experimental group.
4. The writer calculated the mean, median, modus, standard deviation, and standard error
of variable X2 from the control group.
5. The writer calculated the standard error for the difference mean between variable X1
and X2.
6. The writer used ttest to answer the problem of the study, whether there was difference
on students’ scores in writing deascriptive text between using interactive video media
and without using interactive video media, with the formula:
Where:
Mx1– Mx2 : Differentiation of Two Means.
With the criteria:
If ttest > ttable = Ha is accepted and Ho is rejected.
If ttest < ttable = Ha is rejected and Ho is accepted.
The writer used the level of significance at 1% and 5%. If the result of ttest is higher
than ttable, Ha is accepted but if the result of ttest is lower than ttable, Ho is accepted.
7. The writer used SPSS 18.0 after using ttest to answer the problem of the study, whether
there was difference on students’ scores in writing descriptive text between using interactive video media and without using interactive video media.
8. The writer calculated the degree of freedom with formula:62
df = (N1 + N2 - 2)
Where:
df : Degree of Freedom
N1 and N2 : Number of Cases
9. The writer determined the level of significant of tobserved by comparing the tobserved with
the ttable.
10. The writer interpreted the result of the data analysis.
11. The writer discussed to clarify the research findings. The results of the analysis data are
shown in Chapter IV.
After that, the interpretation is made to answer the research problem. To sum up, the
procedures of collecting data and analysis data, as described in figure 3.1.
62
Figure 3.1 The Procedures of Collecting Data and Analysis Data
Treatment Teaching Using Interactive Video Media
No Treatment Teaching Without Using Interactive Video Media
Scoring
Discussion
Testing Hypothesis using t-test Teaching Writing at SMK Level
Conclusion Writing Class
Experiment Group Control Group