Water-Quality Engineering in Natural Systems,by David A. Chin Copyright © 2006 John Wiley & Sons, Inc.
INTRODUCTION
Water is essential for life on Earth, and any changes in the natural quality and distribution of water have ecological impacts that can sometimes be devastating. The sciences of hydrol-ogy and ecolhydrol-ogy are the scientific foundations of water-quality management. Hydrologyis the science dealing with the occurrence and movement of water,ecologyis the science deal-ing with interactions between livdeal-ing thdeal-ings and their nonlivdeal-ing (abiotic) environment or habitat, and the relationship between hydrology and ecology is sometimes called hydrologic connectivity(Pringle, 2003).
It is widely recognized that the establishment of new hydrologic connections in the landscape and modification of natural connectivity in highly modified human-dominated landscapes can have significant ecosystem impacts. For example, the modification of
free-flowing rivers for energy or water supply and the drainage of wetlands can have a variety of deleterious effects on aquatic ecosystems, including losses in species diversity,floodplain fertility, and biofiltration capability (Gleick, 1993). Specific environmental issues that are of global concern include regional declines in migratory birds and wildlife caused by wet-land drainage, bioaccumulation of methylmercury in fish and wildlife in newly created reservoirs, and deterioration of estuarine and coastal ecosystems that receive the discharge of highly regulated silicon-depleted and nutrient-rich rivers.
Water above land surface (in liquid form) is called surface water, and water below land surface is called ground water. Although surface water and ground water are directly con-nected, these waters are typically considered as separate systems and managed under different rules and regulations. A key feature of any surface-water body is its watershed, which is delineated by topographic high points surrounding the water body, and all surface runoff within the watershed has the potential to flow into the surface-water body. Consequently, surface-water bodies are the potential recipients of all contamination contained in surface runofffrom all locations within the watershed. For this reason, the
management of water quality in surface waters is best done at the watershed scale rather than at the scale of individual water bodies. This is the watershed approachto water-quality management. The main limitations to implementing the watershed approach are rooted in our inability to quantify most of the sub-watershed-scale contaminant-transport processes that are fundamental to implementing watershed models of water quality. Contaminant inputs into surface waters from the atmosphere are also considered in water-quality man-agement plans (Patterson, 2000). In contrast to surface waters, the quality of ground water is influenced primarily by activities on and below the ground surface, and the potential sources of ground-water contamination are determined primarily by overlying land uses and subsurface geology. The concept of a watershed is not applicable to ground water.
Identification of some polluted water bodies are obvious to the casual observer, such as the stream shown in Figure 1.1, but some polluted water bodies are not so obvious, such as an apparently pristine lake that is so contaminated with acid rain that the existence of aquatic life is extremely limited.
To put the water-quality problem in perspective, a comprehensive study of the quality of waters in the United States (USGS, 1999) determined that:
• The highest levels of nitrogen occur in streams and ground waters in agricultural areas. Fifteen percent of samples exceeded the drinking-water standard for nitrate nitrogen, 10 mg/L as N.
• Pesticides, primarily herbicides, are found frequently in agricultural streams and ground water. Pesticides found most frequently include atrazine, metachlor, alochlor, and cyanazine.
• Urban streams have the highest frequencies of occurrence of DDT, chlordane, and dieldrin in fish and sediments. Complex mixtures of pesticides are commonly found in urban streams.
• Concentrations of phosphorus are elevated in urban and agricultural streams. These concentrations commonly exceed 0.1 mg/L.
• Hydrology and land use are the major factors controlling nutrient and pesticide con-centrations in major rivers. Concon-centrations are proportional to the extent of urban and agricultural land use throughout the watershed. Key factors are soils and land slopes. • Base flow in rivers originating from ground-water sources can be a major source of
nutrients and pesticides to streams.
Aside from these general findings, individual states have their own unique problems with diffuse sources of pollution: In Wisconsin, waters are polluted by dairy and cranberry farms; in North Carolina, by hogs; in Maryland, by chickens; in southern Florida, by sugar; in Wyoming, by beef cattle; in Oregon, by clear-cutting; and in California, by irrigation returnflows.
1.1 PRINCIPLES OF WATER-QUALITY CONTROL
The water-quality-based approach to pollution control provides a mechanism through which the amount of pollution entering a water body is controlled based on the conditions of the water body and the standards set to protect it. The water-quality-based approach to pollution control, illustrated in Figure 1.2, can be viewed as consisting of the following eight stages:
1
Determine protection level
Review/revise state WQS
2
Conduct WQ assessment
(a) Monitor water quality (b) Identity impaired waters
3 Establish priorities
Rank/target waterbodies
4 Evaluate WQS for
targeted waters
5
Define and allocate control responsibilities
TMDL / WLA / LA
6
Establish source controls
Point source permits NPS programs
7
Monitor and enforce compliance
Self-monitoring Agency monitoring
Enforcement
8 Measure progress
Modify TMDL if needed
Reaffirm / revise WQS
1. Determining the protection level requires the development of water-quality stan-dards, which are the bases on which the condition of a water body is assessed.
2. Monitoring and assessing water qualityrequires a determination of whether water-quality standards are being met, detects pollution trends, and identifies sources of pollu-tion. According to terminology used in the United States, water bodies not meeting water-quality standards are called impaired waters, and a threatened water bodyis one that currently meets water-quality standards but for which existing and readily available data and information on adverse declining trends indicate that water-quality standards will probably not be met at some time in the near future (USEPA, 1991b).
3. Establishing priorities involves ranking impaired water bodies based on considera-tions of risk to human health, aquatic life, and wildlife; degree of public interest and sup-port; the recreational, economic, and aesthetic importance of a particular water body; and other relevant considerations.
4. Evaluating water-quality standards involves evaluating the appropriateness of the water quality standards for specific waters. It is possible that generally applied standards may be either over- or underprotective for a specific water body that has not had an in-depth standards analysis.
5. Defining and allocating control responsibilitiesestablishes the level of control needed to meet water-quality standards and defines and allocates control responsibilities. The quantity of potential pollutants that can be discharged into any given water body without altering its integrity is called the waste assimilative capacity, and the sum of the waste assim-ilative capacity and the background load is called the loading capacity (USEPA, 1991a). Determining the loading capacity of a receiving body is one of the most important steps in any water-quality-based environmental protection or restoration effort. The total maximum daily load(TMDL) is defined as the maximum amount of a pollutant that may be discharged into a water body and still meet water-quality standards. Mathematical models and/or mon-itoring are used to determine TMDLs for impaired water bodies. Pollutant loadings above the TMDL amount will result in waters exceeding the water-quality standards. The TMDLs includewaste-load allocations (WLAs) for point sources,load allocations(LAs) for non-point sources, and a margin of safety (USEPA, 1994). Allocations of pollution loads from point and nonpoint sources are calculated to ensure that water-quality standards are not exceeded, and as such are water-quality-based limits. For each impaired water body, TMDLs are developed by considering all pollution sources within the contributing watershed.
In contrast to point-source controls, nonpoint-source controls usually take the form of required best management practices (BMPs) or other management measures. The lands that are most polluting within a watershed are sometimes called critical lands, and identification of such lands is one of the most important tasks in planning, watershed man-agement, and establishing and enforcing TMDLs.
7. Monitoring and enforcing complianceinvolves the collection of data for assessing compliance with water-quality-based controls (permits) and for evaluating whether the TMDLs, and control actions based on the TMDLs, are consistent with water-quality standards.
8. Measuring progressinvolves assessing the effectiveness of the contaminant-source controls and determining whether water-quality standards have been attained, qual-ity standards need to be revised, or more stringent controls should be applied. If water-quality standards are not met, TMDL allocations must be modified.
In implementing the principles of water-quality control, it is essential to understand the connection between contaminant-source loading and the water quality. An understanding of pollution abatement resulting from physical, chemical, and/or biological controls and an ability to model these processes are essential in controlling the quality of water in natural systems.
1.2 SOURCES OF WATER POLLUTION
Sources of water pollution are broadly grouped into point sources and nonpoint sources. Point sourcesare defined as localized discharges of contaminants and include industrial and municipal wastewater outfalls, septic tank discharges, and hazardous-waste spills. Nonpoint sourcesof pollution include contaminant sources that are distributed over large areas or are a composite of many point sources, including runofffrom agricultural opera-tions, the atmosphere, and urban runoff. Surface runoffthat collects in storm sewers and discharges via a pipe is still considered nonpoint-source pollution since it originates as diffuse runofffrom the land surface. Pollution loads from nonpoint sources are commonly calleddiffuse loads. The most widespread nonpoint-source pollutants in the United States are eroded sediments, fertilizers, and pesticides, associated primarily with agricultural operations (Corwin et al., 1999).
Black Sea, the Po River for the Adriatic Sea, the Susquehanna and Potomac Rivers for Chesapeake Bay, and the Mississippi River for the Gulf of Mexico.
Wet-weather dischargesrefer to discharges that result from precipitation events such as rainfall and snowmelt. Wet-weather discharges include stormwater runoff, combined-sewer overflows (CSOs), and wet-weather sanitary-sewer overflows (SSOs). Stormwater runoffcollects pollutants such as oil and grease, chemicals, nutrients, metals, and bacteria as it travels across land. CSOs and wet-weather SSOs contain a mixture of raw sewage, industrial wastewater, and stormwater, and have resulted in beach closings, shellfish bed closings, and aesthetic problems.
1.2.1 Point Sources
The identifying characteristic of point sources is that they discharge pollutants into receiv-ing waters at identifiable single- or multiple-point locations. A typical point source of con-tamination is shown in Figure 1.3. In most countries, these (point) sources are regulated, their control is mandated, and a permit is required for waste discharge. Point sources of contamination that are of concern in managing surface waters are domestic wastewater dis-charges, industrial disdis-charges, and spills.
Domestic Wastewater Discharges Most municipal wastewater treatment plants discharge their effluent into rivers, lakes, or oceans. For river discharges of municipal wastewater, the effect of the effluent on the dissolved oxygen and nutrient levels in the river are usually of most concern. Decreased oxygen levels in rivers can cause harm to the aquatic life, and increased nutrient levels stimulate the growth of algae, which consume
oxygen. For ocean discharges, pathogen and heavy-metal concentrations are usually of most concern. In particular, pathogenic microorganisms discharged into the ocean can infect humans who come in contact with the ocean water in recreational areas such as beaches. Domestic wastewater discharged from septic tanks contains large numbers of pathogenic microorganisms, with viruses of particular concern because of the ability of viruses to move considerable distances in ground water. Approximately 50 million resi-dents of the United States, 29% of the population, dispose of their sewage by individual on-site (septic) systems. Septic tanks represent the highest total volume of wastewater dis-charged directly to ground water and are the most common source of ground-water con-tamination (Novotny, 2003).
Properly designed, operated, and maintained sanitary-sewer systems collect and trans-port all of the sewage that flows into them to publicly owned treatment works (POTWs). However, occasional unintentional discharges of raw sewage from municipal sanitary sew-ers occur in almost every system. These types of discharges, collectively called sanitary-sewer overflows(SSOs), have a variety of causes, including but not limited to extreme weather, improper system operation and maintenance, and vandalism. There are at least 40,000 SSOs each year in the United States. The untreated sewage from SSOs can con-taminate receiving waters and cause serious water-quality problems. These SSOs can also back up into basements, causing property damage and threatening public health.
Combined-Sewer Overflows Combined-sewer systems are designed to collect rain-water runoff, domestic sewage, and industrial wastewater in the same pipe. Most of the time, combined-sewer systems transport all of their wastewater to a sewage treatment plant, where it is treated and discharged to a receiving water body. During periods of heavy rainfall or snowmelt, the wastewater volume in a combined-sewer system can exceed the capacity of the sewer system or treatment plant. For this reason, combined-sewer systems are designed to overflow occasionally and discharge excess wastewater directly to nearby streams, rivers, or other water bodies. These overflows, called combined-sewer overflows (CSOs), contain not only stormwater but also untreated human and industrial waste, toxic materials, and debris.
In the United States, combined-sewer systems are remnants of early infrastructure and are typically found in older communities. Combined-sewer systems currently serve approximately 770 communities containing about 40 million people. Most communities with combined-sewer systems (and therefore with CSOs) are located in the northeast and Great Lakes regions and the Pacific northwest. Figure 1.4 provides a rough illustration of the prevalence of combined-sewer systems in the United States.
Stormwater Discharges Stormwater discharges are generated by runofffrom open land and impervious areas such as paved streets, parking lots, and building rooftops dur-ing rainfall and snow events. Stormwater runoffoften contain pollutants in quantities that could affect water quality adversely. A typical stormwater outlet is shown in Figure 1.5. The primary method to control the quality and quantity of stormwater discharges is through the use of best management practices. Although stormwater runoffis commonly discharged through a single outfall pipe, such discharges are more accurately classified as nonpoint pollutant sources.
in industrial wastewaters. Some industries provide pretreatment prior to discharging their wastewaters either directly into surface waters or into municipal sewer systems for further treatment in combination with domestic wastewater. In many countries outside the United States, industries are permitted to discharge their wastewater without ade-quate pretreatment, and the resulting human and environmental impacts are usually noticeable.
FIGURE 1.4 Combined-sewer systems in the United States. (From USEPA, 2005b.)
Animal Feeding Operations Concentrated animal feeding operations (CAFOs) are considered point sources of contamination. To be considered a CAFO, a facility must first be defined as an animal feeding operation (AFO), where animals are kept and raised in confined areas. A typical AFO is shown in Figure 1.6. The following conditions are typi-cal of AFOs: (1) animals have been, are, or will be stabled or confined and fed or main-tained for a total of 45 days or more in any 12-month period; and (2) crops, vegetation, forage growth, or postharvest residues are not sustained in the normal growing season over any portion of the lot or facility.
There have been substantial changes in the U.S. animal production industry over the past several decades. Although the total number of AFOs has decreased, overall produc-tion has increased. As a result, CAFOs are increasing in size and generating consider-ably more waste requiring disposal over more limited areas. These operations are expanding to the central and southwestern regions of the United States, where land is less expensive and populations are relatively sparse. CAFO waste releases in the eastern United States have prompted a closer evaluation of their environmental impact on sur-face waters.
Spills Spills and accidental or intentional releases can occur in a variety of ways. Transportation accidents on highways and rail freight lines can result in major chemi-cal spills, and accidental releases at petroleum-product storage installations are another common source of accidental spills. Leaks and spills from underground storage tanks and piping into the ground water are of special concern because these releases may remain undetected for long periods of time.
1.2.2 Nonpoint Sources
Nonpoint sources of contamination generally occur over large areas and because of their diffuse nature, are more complex and difficult to control than point sources. Nonpoint-source
pollution is a direct result of land-use patterns, so many of the solutions to pollution by nonpoint sources lie in finding more effective ways to manage the land and stormwater runoff. Much nonpoint-source pollution occurs during rainstorms and spring snowmelt, resulting in large flow rates that make treatment even more difficult. Federal and state gov-ernments do not play a major role in local land-use decisions; therefore, local govgov-ernments must be responsible for maintaining water quality through nonpoint-source controls. Nonpoint sources of contamination that must generally be considered in managing water bodies are agricultural runoff, livestock operations, urban runoff, landfills, and recreational activities.
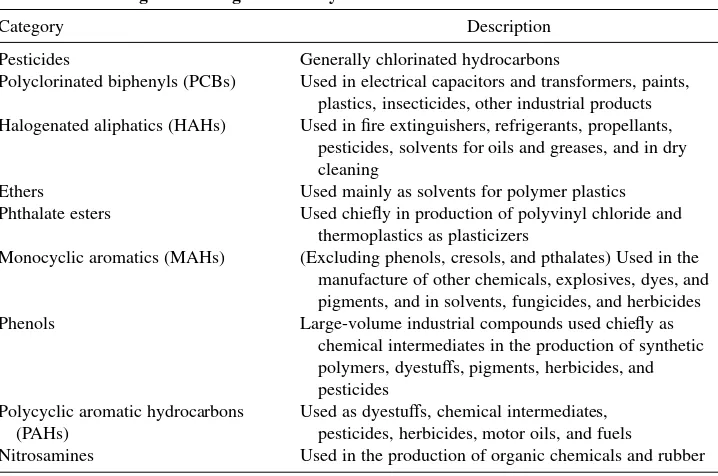
Runofffrom urban and agricultural areas are the primary sources of surface-water pollution in the United States (USEPA, 2000b). Ground-water contamination originating from septic tanks, leaking underground storage tanks, and waste-injection wells is quite common and are of particular concern when ground water is the source of domestic water supply. The strengths of various sources of water pollution are shown in Table 1.1. It is clearly apparent that pollutants at high concentrations can enter water bodies from a variety of sources, and control of these sources is central to effective water-quality management.
Agricultural Runoff Application of pesticides, herbicides, and fertilizers are all agricul-tural activities that influence the quality of both surface and ground waters. In the United States, certain pesticides and herbicides are banned because of their toxicity to humans or their adverse effect on the environment. The application of fertilizers is of major concern because dissolved nutrients in surface runoffaccelerate growth of algae and depletion of oxy-gen in surface waters. Nitrooxy-gen, in the form of nitrates, is a contaminant commonly found in ground water underlying agricultural areas and can be harmful to humans. Erosion caused by improper tilling techniques is another agricultural activity that can adversely affect water quality through increased sediment load, color, and turbidity (AWWA, 1990).
TABLE 1.1 Strength of Various Point and Nonpoint Sourcesa
Suspended Total Total Total BOD5 Solids Nitrogen Phosphorus Coliforms Source (mg/L) (mg/L) (mg/L) (mg/L) (MPN/100 mL)
Urban stormwater 10–250 (30) 3000–11,000 (650) 3–10 0.2–1.7 (0.6) 103–108 Construction-site NA 10,000–40,000 NA NA NA
runoff
Combined-sewer 60–200 100–1100 3–24 1–11 105–107 overflows
Light industrial 8–12 45–375 0.2–1.1 NA 10 area
Roof runoff 3–8 12–216 0.5–4 NA 102
Typical untreated (160) (225) (35) (10) 107–109 sewage
Typical POWTb (20) (20) (30) (10) 104–106 effluent
Livestock Feedlots have been shown to contribute nitrates to ground water, and patho-genic microorganisms to surface waters. Overgrazing eliminates the vegetative cover that prevents erosion, increasing the sediment loading to surface waters. In some extreme cases, livestock are allowed to wade in and cause direct contamination of streams. Such a circumstance is shown in Figure 1.7. This practice should be avoided as much as possible, since the direct pollution of streams by pathogens such as Cryptosporidium parvumis a likely and undesirable consequence.
Urban Runoff Urban runoffcontains contaminants that are washed from pavement sur-faces and carried to surface-water bodies. Contaminants contained in urban runoffinclude petroleum products, metals such as cadmium and lead from automobiles, salt and other deicing compounds, and silt and sediment from land erosion and wear on road and side-walk surfaces. Bacterial contamination from human and animal sources is also often pres-ent. The initial “flushing” of contaminants during storm events typically creates an initial peak in contaminant concentration, with diminishing concentration as pollutants are washed away (AWWA, 1990).
A major factor associated with impairment of waters in the United States is the amount of impervious area that is directly connected to urban runoffsystems (USEPA, 2002b), and such a connection is shown in Figure 1.8. According to Schueler (1995), there is a strong correlation between percent imperviousness of a watershed and stream health. Schueler (1995) further reported that stream degradation can occur when a water-shed becomes about 10% impervious, and degradation becomes unavoidable at 30% imperviousness.
Landfills Leachate from landfills can be a source of contamination, particularly for ground water. Water percolating through a landfill (leachate) contains many toxic con-stituents and is typically controlled by capping the landfill with a low-permeability cover
and installing a leachate-collection system. Many older landfills do not have leachate-collection systems.
Recreational Activities Recreational activities such as swimming, boating, and camp-ing can have a significant impact on water quality. The impact of human activities has typ-ically been reported in terms of increased levels of pathogenic microorganisms (AWWA, 1990).
1.3 LAWS AND REGULATIONS
Most water-control protocols are motivated directly or indirectly by environmental regula-tions. Consequently, to gain a proper understanding of water-control practice, one must have a good understanding of environmental regulations.
In the United States, Congress makes laws, and to put these laws into effect, Congress authorizes certain government agencies, such as the U.S. Environmental Protection Agency (USEPA), to create and enforce regulations to implement these laws. The creation of a law begins when a bill is proposed by a member of Congress. If both houses of Congress approve a bill, it goes to the President, who has the option to either approve (sign) it or veto it. If approved, the new law is called an act, and the text of the act is known as a public statute. Once an act is passed, the Government Printing Office incorporates the new law into the United States Code, which codifies (categorizes and compiles) all federal legislation. Authorized regulatory and enforcement agencies—such as the USEPA— identify the need for regulations to support implementation of the act passed by Congress. Proposed regulations are listed in the Federal Registerso that the public can provide com-ments to the agency. After considering all public comcom-ments and making appropriate modifications to proposed regulations, a final rule is issued and published in the Federal Register. Once a regulation is completed and has been published in the Federal Registeras afinal rule, it is codified by being published in the Code of Federal Regulations(CFR). The CFR is the official record of all regulations created by the federal government and is
divided into 50 volumes called titles, each of which focuses on a particular area. Almost all environmental regulations appear in Title 40, usually abbreviated as simply 40 CFR. Each CFR title is divided into various sections; for example, the baseline regulations deal-ing with stormwater discharges into waters of the United States are found in 40 CFR 122, and specific permit requirements are found in 40 CFR 122.26. The most important federal laws governing the quality of ground and surface waters in the United States are the Clean Water Act (CWA) and the Safe Drinking Water Act (SDWA).
Programs mandated by both the CWA and SDWA are administered at the federal level by the U.S. Environmental Protection Agency, and these programs are usually imple-mented through corresponding individual state programs. The CWA allows the delegation of many permitting, administrative, and enforcement aspects of the law to state govern-ments. In states with the authority to implement CWA programs, the USEPA still retains oversight responsibilities. In addition to the implementation of federal laws and regula-tions, state programs provide protection of public water supplies through water codes, san-itary regulations, regulation of inland wetland areas, and other means of watercourse and ground-water protection (AWWA, 1990). At the local level, municipal and county ordi-nances can provide significant protection through land-use controls that regulate develop-ment activities on key watershed areas.
1.3.1 Clean Water Act
The Clean Water Act, originally enacted in 1972, is intended to restore and maintain the physical, chemical, and biological integrity of waters of the United States. The Clean Water Act applies to surface waters, including rivers, lakes, estuaries, wetlands, and oceans, and focuses primarily on establishing water-quality standards and regulations to control discharges into surface waters. Major requirements of the Clean Water Act are:
• States must set water-quality standards to protect designated uses of all natural water bodies in the state.
• States must prepare and submit (to the USEPA) an annual report on the quality of all waters in the state.
• States must submit (to the USEPA) lists of surface waters that do not meet applicable water-quality standards after implementation of technology-based limitations. Such waters are called impaired waters. States must establish total maximum daily loads (TMDLs) for impaired waters on a prioritized schedule that considers the severity of the pollution and the uses to be made of such waters.
• The federal government must set industrywide, technology-based effluent standards for dischargers.
• All dischargers must obtain a permit issued by the federal government or authorized states that specifies discharge limits under the National Pollutant Discharge Elimination System (NPDES). The discharge limits are typically the stricter of the water-quality-based and technology-water-quality-based limits.
meet their water-quality standard are typically regulated using technology-based effluent standards, whereas discharges into impaired waters are regulated for each pollutant based on a total maximum daily load (TMDL), which is the amount of a contaminant that a water body can receive and still meet the water-quality standard. For each pollutant, the TMDL includes contributions from both point and nonpoint sources. Dissolved-oxygen concen-tration and algal biomass (or chlorophyll a) are the most commonly applied assessment endpoints in TMDLs (Tung, 2001).
1.3.2 Safe Drinking Water Act
The Safe Drinking Water Act (SDWA) was enacted in 1974 to protect public health by regulating the nation’s public drinking-water supply. The law was amended in 1986 and 1996 and requires many actions to protect drinking water and its sources. The SDWA applies to every public water system in the United States, and there are currently more than 160,000 public water systems. The SDWA does not regulate private wells that serve fewer than 25 persons. Major programs mandated by the SDWA that relate to water-qual-ity control in natural waters are drinking-water standards, source-water protection, and underground injection control.
Drinking-Water Standards Under the authority of the SDWA, the USEPA has prom-ulgated national primary drinking-water standards for certain radionuclide, microbiologi-cal, organic, and inorganic substances. These standards establish maximum contaminant levels (MCLs), which specify the maximum permissible level of a contaminant in water that may be delivered to a user of a public water-supply system. MCLs are established based on consideration of a range of factors, including not only the health effects of the contaminants but also the treatment capability, monitoring availability, and costs. In some cases, MCLs are replaced by treatment techniques (TTs), which are procedures that pub-lic water-supply systems must employ to ensure contaminant control. Required treatment techniques for pathogens are contained in the Surface Water Treatment Rule (SWTR) and the coliform standard. The SWTR requires that surface water, and ground water under the direct influence of surface water, undergo some combination of disinfection and filtration to meet the following criteria:
• A minimum of 99.9% of Giardia lambliaand 99.99% of viruses are to be killed or inactivated.
• The turbidity must be maintained at less than 5 nephelometric turbidity units (NTU) at all times and less than 1 NTU in 95% of daily samples.
• The total heterotrophic bacterial level, as determined by plate count, must be less than 500 colonies per milliliter.
The coliform standard requires that no more than 5% of water samples test positive for col-iforms in a month, and of those positives, that there be no samples that test positive for fecal coliforms.
of the year (most cities, towns, schools, businesses, campgrounds, and shopping malls are served by public water systems). The 10% of Americans whose water comes from private wells (individual wells serving fewer than 25 persons) are not protected by these federal standards. People with private wells are responsible for making sure that their own drink-ing water is safe. Bottled water is regulated by the U.S. Food and Drug Administration as a food product and is required to meet standards equivalent to those that the USEPA sets for drinking water.
Source-Water Protection Under provisions of the Safe Drinking Water Act, the USEPA also establishes minimum water-quality criteria for water that may be taken into a water-supply system. All states are required to develop source-water assessment plans (SWAPs) to protect public water supplies from contaminant sources within the catchment area of the drinking-water intake. This catchment area defines the source-water protection area (SWPA) of the intake. Key components of SWAPs are as follows:
1. Delineation of the source-water protection area.For ground-water systems, available information about ground-water flow and recharge is used to determine the source-water protection area around a well or well field. Such areas are called wellhead protection areas. Wellhead protection areas are typically divided into three zones, with an inner zone given the most protection, an intermediate zone where detailed contaminant inventories are con-ducted and best management practices required, and an outer zone where the potential impact of contaminants on drinking-water intakes is regarded as minimal. The inner zone is usually delineated using a distance criterion, the intermediate zone (also known as the inventory region) delineated by time of travel, and the outer zone delineated by a hydroge-ologic boundary. For surface-water intakes drawing water from a stream, river, lake, or reservoir, the land area in the watershed upstream of the intake defines the source-water pro-tection area. Surface-water intakes commonly have two propro-tection zones, an inner zone that is typically delineated by an upstream distance or travel time (based on the average annual highflow) plus a minimum buffer width. Outer zones are typically delineated by watershed boundaries. Water-supply wells classified as ground water under the direct influence of sur-face water (GWUDI) are treated as sursur-face-water sources for delineation purposes.
2. Inventory of actual and potential sources of contamination.Sources of pollutants that could potentially contaminate the water supply are identified. This inventory usually results in a list of facilities and activities within the delineated area that may release con-taminants into the underground water supply (for wells) or the watershed of the river or lake (for surface-water sources). Some examples of potential pollutant sources include landfills, underground or aboveground fuel storage tanks, residential or commercial septic systems, urban runofffrom streets and lawns, farms and other entities that apply pesticides and fertilizers, and sludge-disposal sites.
specific potential contamination sources or from individual chemicals that could pollute the water. In some cases, a susceptibility ranking of high, medium, or low is assigned to each pollutant source.
4. Releasing the results of the assessments to the public.After the source-water assess-ment for a particular water system is completed, the information must be summarized for the public. Such summaries help communities better understand the potential threats to their water supplies and identify priority needs for protecting the water from contamination. Local communities, working in cooperation with local, regional, and state agencies, can use the information gathered through the assessment process to create broader source-water protection programs to address current and future threats to the quality of their drinking-water supplies.
Communities use a wide array of source-water protection methods to prevent contami-nation of their drinking-water supplies. One management option involves regulations, such as prohibiting or restricting land uses that may release contaminants in critical source-water protection areas. To go along with these regulations, many communities hold local events and distribute information to educate and encourage citizens and businesses to recy-cle used oil, limit their use of pesticides, participate in watershed recy-cleanup activities, and engage in a variety of other prevention activities. Another approach to source-water pro-tection is to purchase land or create conservation easements to serve as propro-tection zones near drinking-water sources.
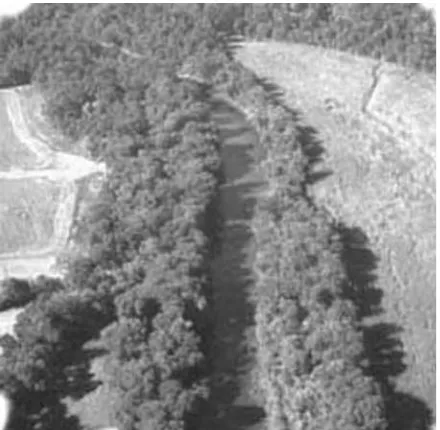
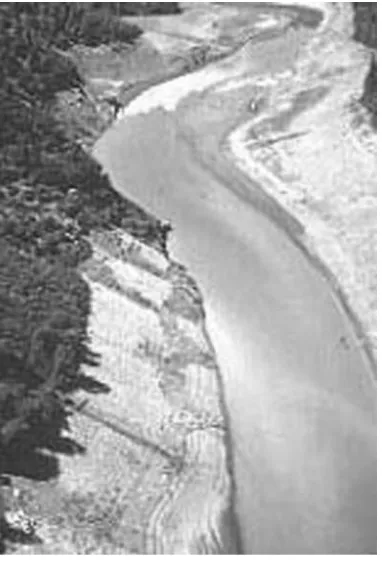
The use of prescribed buffer zones and travel times to protect surface-water intakes and the use of travel times to protect ground-water intakes are the most common approaches to controlling the susceptibility of drinking-water intakes to contamination (USEPA, 1997a, b). A typical riparian (river) buffer zone consisting of a forested area is shown in Figure 1.9. Buffer zones can be created through utility ownership or usage restrictions,
thereby providing for filtration of runoffthrough natural vegetation. The required buffer areas take into account exposure to contamination and the degree of treatment provided by the buffer. Wetlands are frequently used as buffers for water-supply intakes, and preserva-tion of wetlands maintains the natural filtration and cleansing provided by these critical areas.
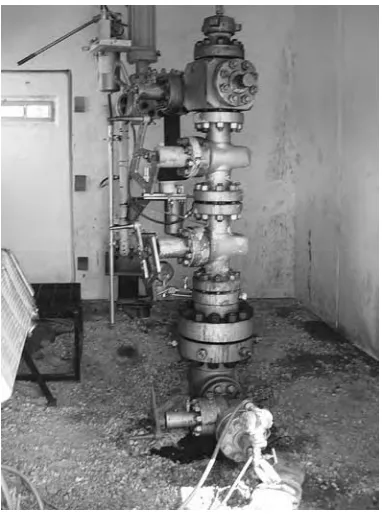
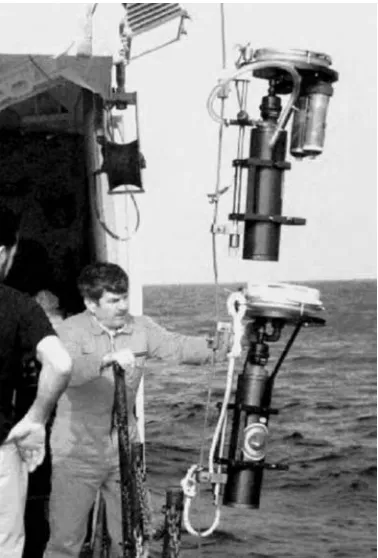
Underground Injection Control Program The underground injection control (UIC) program provides safeguards such that injection wells do not endanger underground sources of drinking water (USDWs). Facilities across the United States discharge into underground formations a variety of hazardous and nonhazardous fluids via more than 800,000 injection wells, and a typical injection well is shown in Figure 1.10. Agricultural operations and the chemical and petroleum industries could not exist without underground injection wells since it is frequently cost-prohibitive to treat and release to surface waters the large amounts of wastes that these industries produce each year. When injection wells are properly sited, constructed, and operated, these wells are an effective and environmen-tally safe alternative to surface disposal.
An injection well is defined as a bored, drilled, or driven shaft whose depth is greater than the largest surface dimension; a dug hole whose depth is greater than the largest sur-face dimension; an improved sinkhole; or a subsursur-face fluid distribution system. This definition covers a wide variety of injection practices, ranging from more than 140,000 technically sophisticated highly monitored wells that pump fluids into isolated formations up to 2 miles below Earth’s surface to the far more numerous on-site drainage systems,
such as septic systems, dry wells, and stormwater wells, that discharge fluids a few meters underground.
USEPA groups underground injection wells into five classes for regulatory control pur-poses. Each class includes wells with similar functions, construction, and operating fea-tures, so that technical requirements can be applied consistently to the class:
• Class I wells: inject hazardous and nonhazardous fluids (industrial and municipal wastes) into isolated formations beneath the lowermost underground source of drink-ing water (USDW). Because these wells inject hazardous waste, class I wells are the most strictly regulated and are regulated further under the Resource Conservation and Recovery Act (RCRA).
• Class II wells:inject brines and other fluids associated with oil and gas production. • Class III wells:injectfluids associated with solution mining of minerals.
• Class IV wells:inject hazardous or radioactive wastes into or above a USDW and are banned unless authorized under other statutes for ground-water remediation. • Class V wells:include all underground injection not included in classes I through IV.
Generally, most class V wells inject nonhazardous fluids into or above a USDW and are on-site disposal systems such as floor and sink drains, which discharge to dry wells, septic systems, leach fields, and drainage wells. Injection practices or wells that are not covered by the UIC Program include single-family septic systems and cesspools as well as nonresidential septic systems and cesspools serving fewer than 20 persons that inject only sanitary wastewater.
All injection wells are not waste-disposal wells. Some class V wells, for example, inject surface water to replenish depleted aquifers or to prevent saltwater intrusion. Some class II wells inject fluids for enhanced recovery of oil and natural gas.
Most injection wells have the potential to inject fluids that may cause a public water system to violate drinking water standards. In general, the UIC program prevents contam-ination of water supplies by setting minimum requirements for state UIC programs. A basic concept of USEPA’s UIC program is to prevent contamination by keeping injected
fluids within the intended injection zone, or in the case of injection directly or indirectly into a USDW, the fluids must not endanger or have the potential to endanger a current or future public water supply. Most of the minimum requirements that affect the siting of an injection well and the construction, operation, maintenance, monitoring, testing, and
finally, the closure of the well, are designed to address these concerns. All injection wells require authorization under general rules or specific permits, and most states have primary enforcement authority (primacy) for the UIC program.
1.4 STRATEGY FOR WATER-QUALITY MANAGEMENT
The strategy for water-quality management in the United States is dictated primarily by the Clean Water Act and has three major components:
1. Designate the use of each natural water body.
Regulatory categories of designated uses include public water supply, recreation, and propagation of fish and wildlife; other uses, such as navigation and irrigation, can also be specified. For each designated use, water-quality criteria are established by the state with the approval of the USEPA. Comparing the quality of a water body with the criteria cor-responding to its designated use is called water-body assessment. If the water-quality cri-teria are met by the water body, the designated use is attained.
1.4.1 Use-Attainability Analysis
If the water-quality criteria are not met, the designated use has not been attained and a use-attainability analysis(UAA) must be done. The primary objectives of a UAA are to deter-mine what maximum pollutant loads [expressed as total maximum daily loads (TMDLs)] are consistent with meeting the water-quality criteria and whether limiting these loads are feasible from a socioeconomic viewpoint. Therefore, a UAA has three components: (1) water-body assessment, (2) determination of total maximum daily load, and (3) socioeco-nomic analysis. Possible outcomes of a use-attainability analysis are that the designated use (a) is attainable, (b) is not attainable and should be downgraded, or (c) is more than attainable and should be upgraded. Acceptable reasons for changing the designated use and/or water-quality criteria of a water body are:
• Naturally occurring pollutant concentrations prevent attainment of the use.
• Natural, ephemeral, intermittent, or low flow or water levels prevent the attainment of the use unless these conditions are compensated for by the discharge of a sufficient volume of effluent discharge without violating conservation requirements.
• Human-caused conditions or sources of pollution prevent the attainment of the use and cannot be remedied or would cause more environmental damage to correct than to leave in place.
• Dams, diversions, or other types of hydrologic modifications preclude the attainment of the use and its feasibility to restore the water body to its original condition or to operate such modification in a way that would result in the attainment of the use. • Physical conditions related to the natural features of the water body, such as the lack
of proper substrate, cover,flow, depth, pools, riffles, and the like, unrelated to water quality, preclude attainment of aquatic-life protection uses.
• More stringent controls would result in substantial and widespread adverse societal and economic impact.
1.4.2 Total Maximum Daily Load Process
The TMDL process is the preferred planning process in situations where simple control of point sources by permits based on technology-based standards or on waste load allocations alone would fail to accomplish water-quality goals in water-quality-limited receiving waters. The outcome of this process is a watershed management plan that puts controls on sources of pollution located within the watershed. Management options in water-quality-limited (impaired or threatened) waters are as follows (Novotny, 1996, 1999):
by issuing TMDL-based point-discharge (NPDES) permits. These permits are more stringent than those mandated by technology-based effluent standards.
2. A combination of additional point-source controls and feasible best management practices to reduce nonpoint-source loads. In this approach, loading capacity from point and nonpoint sources and TMDLs must be determined for both low-flow and wet-weather conditions. This alternative is more efficient and equitable than a sole reliance on point-source controls.
3. Water-body restoration and waste assimilative capacity enhancement. For some water-quality-limited watersheds, enough pollutants have accumulated in the sediments that even if all present point and nonpoint discharges are eliminated, the water-quality goals will not be achieved. Assimilative capacity can be increased by means such as
low-flow augmentation, contaminated-sediment removal or capping, in-stream aeration, restoration of riparian wetlands, and implementation of riparian buffer strips.
4. Changing the designated use and associated water-quality standards.If a use-attainability analysis (UAA) proves that the existing water-quality standards are not attain-able, the designated use of the water body, and associated standards, can be adjusted to reflect the attainable optimum use.
An implementation plan must generally be part of a TMDL study, and this plan is subject to approval by a regulatory agency, which in the United States is the U.S. Environmental Protection Agency or a delegated state agency.
SUMMARY
The regulation and management of potential water pollutants are best accomplished by taking into account the relationship between the location and magnitude of these pollutant sources and their water-quality impact. This approach to pollution control, generally referred to as water-quality-based pollution control, requires consideration of the impact on both ground and surface waters. For surface waters, the land area of concern is the watershed, and for ground waters, pollution-handling activities on the overlying land area are of most concern.
Sources of water pollution are grouped into point and nonpoint sources. Point sources discharge pollutants into receiving waters at identifiable locations, typically out of the end of a pipe, and include domestic wastewater discharges, combined sewer overflows, indus-trial discharges, animal feeding operations, and spills. Nonpoint sources of water pollu-tion, which occur over large areas and tend to be diffuse in nature, include agricultural runoff, livestock, urban runoff, landfills, and recreational activities.
calculated that would be consistent with the water body meeting the water-quality criteria associated with its designated use. The TMDL is allocated between point sources, non-point sources, and background loading of contaminants into the polluted water body. Any water body that does not meet its water-quality criteria can technically be referred to as polluted. The Safe Drinking Water Act includes several provisions that complement the Clean Water Act in controlling the quality of natural water bodies, such as the establish-ment of drinking-water standards that are commonly used as water-quality criteria for ground waters; source-water protection, wellhead protection, and sole-source aquifer pro-grams that require regulation of pollutant sources that could affect drinking water quality; and the underground injection program that protects underground sources of drinking water.
The most fundamental water-quality management issues to be addressed when a water body does not meet its water-quality criteria are related to the following two questions: (1) Is the designated use attainable? and (2) What pollutant loads on the water body would be consistent with attaining the designated use? To answer the first question, a use-attainabil-ity analysis must be conducted, and to answer the second question, the TMDL process must be followed.
PROBLEMS
1.1. What is the organizational structure of the U.S. Environmental Protection Agency? Explain how this structure is related to laws governing water quality.
1.2. What is the organizational structure of your state agency responsible for environ-mental protection? Explain how this structure is related to the federal and state laws governing water quality.
1.3. Briefly summarize the federal regulations authorized by the Clean Water Act.
1.4. The loading capacity of a water body that would be consistent with the water body attaining its designated use is calculated to be 100 kg of phosphorus per year. (a) If a 10% factor of safety is mandated by the appropriate regulatory agency, what
is the TMDL for phosphorus?
22
WATER-QUALITY STANDARDS
2.1 INTRODUCTION
The acceptable quality of a natural water body depends on its present and future most beneficial use. Inland and marine waters should be aesthetically pleasing and of acceptable quality to support healthy and diverse aquatic ecosystems as well as human recreational uses such as fishing and swimming. Freshwater bodies such as rivers, lakes, and aquifers are typically sources of drinking water, and the quality of these waters should be consis-tent with the level of water treatment provided prior to distribution in public water-supply systems. Ground-water quality is typically superior to that of surface water in bacterio-logical content, turbidity, and total organic concentrations. However, the mineral content (hardness, iron, manganese) of ground water may be inferior and require additional treat-ment prior to public consumption. Ground-water supplies are frequently consumed directly by the public or pumped into water-distribution systems with minimal treatment. In natural water bodies, water-quality criteria are generally considered from two view-points: human health and aquatic life. Human-health-based water-quality criteria are derived from assumptions related to the degree of human contact, quantity of water ingested during human contact, and the amount of aquatic organisms (e.g., fish) consumed that are derived from the water body (USEPA, 1994). Quantitative human-health water-quality criteria are derived from experimental dose–response relationships and acceptable risk (of illness) and are typically stated in terms of concentrations corresponding to an acceptable level of risk. Aquatic-life water-quality criteria are derived from mortality studies of selected organisms exposed to various levels of contamination in the water, and these crite-ria are stated in terms of acceptable duration and frequency of exposure. In the United States, aquatic-life water-quality criteria are typically stated in the form that aquatic ecosys-tems will not be impaired significantly if (1) the 1-hour average concentration does not
exceed the recommended acute criterionmore than once every 3 years on average; and (2) the 4-day (96-hour) average concentration of the pollutant does not exceed the recom-mended chronic criterion more than once every 3 years on average (USEPA, 1986). Contaminant limits for acute exposure are higher than contaminant limits for chronic expo-sure, but there is no general rule as to whether human-health or aquatic-life criteria is more restrictive.
2.2 MEASURES OF WATER QUALITY
Water quality is assessed based on (1) the present and future most beneficial use of the water body, and (2) a set of water-quality criteria that correspond to the intended use of the water body. In addition to specifying a designated use and water-quality criteria to pro-tect the designated use, an antidegradation policy is generally instituted to keep waters that meet water-quality criteria from deteriorating from their current condition, even if the existing water-quality criteria are met in the deteriorated condition. Water-quality criteria are generally formulated to maintain the physical, chemical, and biological integrity of a water body. Measures used to assess the suitability of a water body for various uses are listed in Table 2.1. The interrelationships between the physical, chemical, and biological measures are complex, and alterations in the physical and/or chemical condition generally result in changes in biological condition.
2.2.1 Physical Measures
Physical measures that directly affect the quality of aquatic-life habitat include flow con-ditions, substrate, in-stream habitat, riparian habitat, and thermal pollution. These meas-ures are described below.
TABLE 2.1 Factors Used in Water-Body Surveys and Assessments
Physical Measures Chemical Measures Biological Measures
In-stream characteristics Dissolved oxygen Biological inventory (existing) Size (width, depth) Toxicants Fish
Flow, velocity Suspended solids Macroinvertibrates Annual hydrology Nutrients Microinvertibrates
Total volume Nitrogen Phytoplankton
Reaeration rates Phosphorus Periphyton Gradient, pools, riffles Sediment oxygen demand Macrophytes
Temperature Salinity Biological potential analysis Sedimentation Hardness Diversity Indexes Channel modifications Alkalinity HSI models Channel stability pH Tissue analysis Substrate characteristics Dissolved solids Recovery index
Channel debris Intolerant species analysis Sludge deposits Omnivore–carnivore analysis Riparian characteristics
Downstream characteristics
Flow Conditions Slope and velocity divide streams into four categories: moun-tain streams, piedmont streams, valley streams, and plains and coastal streams. Mountain streams, sometimes called trout streams, have steep gradients and rapid currents; streambeds consisting of rock, boulders, and sometimes sand and gravel; and are well aerated and cool, with temperatures rarely exceeding 20⬚C.Piedmont streamsare larger than mountain streams, with depths up to 2 m; have rapid currents with alternating rif-fles(shallow, fast-moving waters) and pools(deep slow-moving waters); and streambeds typically consist of gravel. A typical pool and riffle in Elizabeth Brook (Massachusetts) are shown in Figure 2.1 Riffles (rapids) are inhabited by salmonids and pools by rheophilic cyprinids. Valley streamshave moderate gradient and current with alternating rapids and more extensive quiet waters than in piedmont zones. Trout are still present in rapid stretches. Plains and coastal streams include the lower stretches of rivers and canals, have low currents, high temperatures and low dissolved oxygen in the sum-mer, and turbid waters. The main fish species are bream, channel catfish, sunfish, and largemouth bass.
For excellent habitat,flows should exceed 0.05 m3/s for cold streams and 0.15 m3/s for warm streams. Poor habitat usually exists for flows less than 0.01 m3/s in cold streams and 0.03 m3/s in warm streams. For benthic and fish communities, four general categories of velocity (V) and depth (H) are optimal (Novotny, 2003): slow (V⬍0.3 m/s) and shallow (H⬍0.5 m); (2) slow (V⬍0.3 m/s) and deep (H⬎0.5 m); (3) fast (V⬎0.3 m/s) and deep (H⬎0.5 m); and (4) fast (V⬎0.3 m/s) and shallow (H⬍0.5 m).
Thepool/riffle ratioorbend/run ratiois calculated by dividing the distance between riffles or bends by the width of the stream, respectively. The pool/riffle ratio is used to classify streams with higher slope (mountain, piedmont, and valley), and the bend/run ratio is used to classify slow-moving lowland streams. An optimum value of these ratios is in the range 5 to 7 (Novotny, 2003); ratios greater than 20 correspond to channels that are essentially straight and are poor habitat for many aquatic species. Disruption of the run–riffle–pool sequence has detrimental consequences on macroinvertibrate and fish populations, while habitat diversity is related directly to the degree of meandering in nat-ural and channelized streams (Zimmer and Bachman, 1976, 1978; Karr and Schlosser, 1977).
Substrate Substrateis the material that makes up the streambed. Sand and gravel are common substrate materials, and these materials are contrasted in Figure 2.2. The type of substrate is influenced significantly by the velocity of flow in the stream, and a typical rela-tionship between the type of substrate and the velocity in a stream is given in Table 2.2. It is also useful to note that sand settles in streams where velocities are less than 0.25 to 1.2 m/s, gravel settles in streams where velocities are less than 1.2 to 1.7 m/s, and erosion of sand and gravel riverbeds occurs at velocities greater than 1.7 m/s (DeBarry, 2004). Stream velocities below 0.1 m/s are typically categorized as slow, 0.25 to 0.5 m/s as mod-erate, and greater than 0.5 m/s as swift. In general, clean and shifting sand and silt is the poorest habitat. Bedrock, gravel, and rubble on the one side and clay and mud on the other side, especially when mixed with sand, support increasing biomass. Substrate with more than 50% cobble gravel is regarded as excellent habitat conditions; substrate with less than 10% cobble gravel is regarded as poor habitat. Watercourses with swift velocities (⬎0.5 m/s) that have cobble and gravel beds have the greatest invertebrate diversity (DeBarry, 2004).
Embeddednessis a measure of how much of the surface area of the larger substrate par-ticles is surrounded by finer sediment. This provides a measure of the degree to which the
TABLE 2.2 Flow Velocity Versus Type of Substrate Velocity (m/s) Type of Substrate
⬍0.2 Silt and bottom muck
0.2–0.4 Silt and sand
0.4–0.5 Sand
⬎0.5 Gravel and rocks
Source:USEPA (1983b).
primary substrate (e.g., cobble) is buried in finer sediments. The embeddedness measure allows evaluation of the substrate as a habitat for benthic macroinvertibrates, spawning of
fish, and egg incubation. Gravel, cobble, and boulder particles between 0 and 25% fraction surrounded by fine sediments are excellent habitat conditions; gravel, cobble, and boulder particles with greater than 75% fraction surrounded by fine sediments are poor habitat conditions.
In-Stream Habitat The most common channel-alteration activities are channelization, impounding for navigation and electric energy production, channel straightening, reduc-tion of flow by withdrawals, removal of bank vegetation, and building of vertical embank-ments and flood walls. The impact of these alterations range from minor to complete destruction of habitat. Channel alteration that causes little or no enlargement of islands or point bars are best for maintaining habitat; channel alterations that cause heavy deposits of
fine material, increased bar development, and the filling of most pools with silt have the greatest (negative) impact on habitat. Quantitatively, channel modifications that cause less than 5% of the channel bottom to be affected by scouring and deposition have minimal impact; modifications that cause more than 50% of the channel bottom to be affected and where only large rocks or riffle are exposed have significant impact. Channel alterations that lead to unstable side slopes (⬎60%) or increased erosion will clearly have negative impacts on in-stream habitat. An example of severe stream-channel erosion is illustrated in Figure 2.3.
Riparian Habitat In most humid regions of the eastern and southern United States, nat-ural riparian areas consist mostly of forests. In the more arid western parts of the United States, natural riparian areas consist of narrow strips of stream bank vegetation made up of grassland, brush, and other nonforested ecosystems. Modification of these natural ripar-ian ecosystems typically has negative impacts on stream water quality. Forest riparripar-ian buffers provide shade that keep stream temperatures low; filter, absorb, and adsorb pollu-tants; provide an area for sediment deposition; promote microbial decomposition of organic matter and nutrients; minimize or prevent stream bank erosion; provide terrestrial,
stream bank, and aquatic habitat and species biodiversity; open wildlife cooridors; provide infiltration, which replenishes ground water and cool stream base flow; and provide
base-flow attenuation. The preserved riparian area adjacent to the San Joaquin River is shown in Figure 2.4. This extremely valuable riparian habitat passes though miles of farmland in the Central Valley of California.
Reduction or elimination of woods and brush vegetation eliminates wildlife habitat, canopy cover, and shade. Reduction or elimination of shading by stream bank vegetation reduces water quality by increasing sun-energy input, which increases water temperature. Cooler streams contain more oxygen, providing better support for aquatic life. Unshaded streams, partly because of an increase in sunlight and increased stream temperature, pro-mote undesirable filamentous algae, whereas shaded streams support the advantageous diatomatious algae.
Excellent conditions exist when over 80% of the stream bank is covered by vegetation or boulders or cobble; poor habitat conditions exist when less than 25% of the stream bank is covered with vegetation, gravel, or larger material. Shrubs provide excellent stream bank cover. Poor conditions exist when more than 50% of the stream bank has no vegetation and the dominant material is soil or rock.
The reduction or elimination of riparian wetlands reduces habitat for aquatic and ter-restrial organisms and deprives the stream of buffering capacity for diffuse pollutant loads from surrounding lands. This can adversely affect the diversity and species composition in streams and other surface waters since riparian wetlands provide cover and shelter for fish and other organisms.
As streams increase in size, the integrated effects of adjacent riparian ecosystems should decrease relative to the overall water quality of the stream. Higher-order streams are more influenced by land use within a watershed than by the riparian buffer condi-tions. Conversely, first-order streams, or smaller intermittent streams, have little up-gradient contributing drainage area and short contributing flow paths; therefore, the condition of the riparian buffer may have a significant impact on the water quality of the stream.
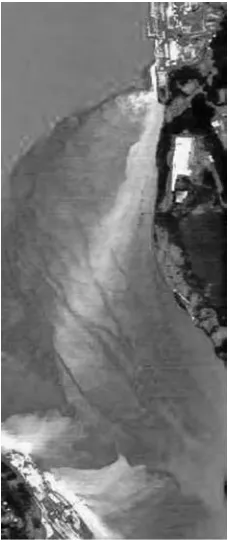
Thermal Pollution The primary source of thermal pollution is waste heat from nuclear and fossil-fuel electric power plants. Commonly, such discharges are about 10⬚C above the temperature of the receiving water (Clark, 1997). Approximately half of the fuel energy used by a typical power plant is dissipated as waste heat to waterways, usually to an adja-cent water body. Many fish species (e.g., salmon) are extremely sensitive to temperature and cannot adjust readily to warmer waters. Conversely, some fish species thrive in warmer waters near power plants and can be severely harmed by a sudden drop in temperature that usually occurs when a plant shuts down for scheduled maintenance or an unscheduled out-age. A hyperspectral image showing thermal plumes from the cities of Indian Point and Lovett (New York) into the Hudson River are shown in Figure 2.5.
In coastal power stations that discharge to temperate seas, heated discharges are gener-ally of little consequence, but in tropical seas, where summer temperatures are already near the thermal death point of many organisms, the increase in temperature can cause sub-stantial loss of life. Most modern power plants are required to install cooling towers that release waste heat to the atmosphere rather than to water bodies.
2.2.2 Chemical Measures
Regulated chemical compounds or combinations of compounds are those that are consid-ered to be toxic to human and aquatic life and that occur or have the potential to occur in the water environment at harmful levels. In the United States, such toxic pollutants are
collectively referred to as priority pollutants, and the Clean Water Act defines these pollu-tants as those that after discharge and upon exposure, ingestion, inhalation, or assimilation into any organism, either directly from the environment or indirectly by ingestion through food chains, will cause death, disease, behavioral abnormalities, cancer, genetic mutation, physiological malfunctions (including malfunctions in reproduction), or physical defor-mations in such organisms or their offspring. The current list of priority pollutants, given in Appendix C.3, contains 129 pollutants, of which 13 are toxic metals and the remaining are mostly organic chemicals. Even though almost all water-quality constituents may become toxic at high enough levels, priority pollutants are either toxic at relatively low lev-els or at levlev-els that may result from waste discharges. The chemical measures that are included in water-quality standards include priority pollutants plus additional chemical measures that describe the ambient environment, such as dissolved oxygen. Key chemical measures of water quality are described in the following sections.
Dissolved Oxygen Dissolved oxygen (DO) is the amount of molecular oxygen dis-solved in water and is one of the most important parameters affecting the health of aquatic ecosystems,fish mortality, odors, and other aesthetic qualities of surface waters. Discharges of oxidizable organic substances into water bodies result in the consumption of oxygen and the depression of dissolved-oxygen levels. If dissolved-oxygen levels fall too low, the effects on fish can range from a reduction in reproductive capacity to suffocation and death. Larvae and juvenile fish are especially sensitive and require higher levels of dissolved oxy-gen than those required by more mature fish. Oxygen depletion at the lower depths of lakes and reservoirs create reducing conditions in which iron and manganese can be solubilized, and taste and odor problems may also increase because of the release of anoxic and/or anaero-bic decay products such as hydrogen sulfide. Nutrient enrichment in surface waters is often signaled by excessive oxygen production, leading to supersaturation in some cases, and by hypoxia or anoxia in deep waters where excessive plant production is consumed.
Saturation levels of DO decrease with increasing temperature, as illustrated in Table 2.3, for a standard atmospheric pressure of 101 kPa. One of the most commonly used empiri-cal equations for estimating the saturation concentration of dissolved oxygen, DOsat, is given by the American Public Health Association (APHA, 1992):
ln DOsat⫽ ⫺139.34411⫹ ᎏ1.5757
whereTais the absolute temperature (K) of the water. Equation 2.1 is sometimes referred to as the Benson–Krause equation. A more compact equation recommended by the U.S. Environmental Protection Agency (USEPA, 1995) is given by
(2.2)
whereTis the water temperature in ⬚C. Equation 2.2 is accurate to within 0.03 mg/L, as compared with Equation 2.1, on which the values given in Table 2.3 are based (McCutcheon, 1985). The saturation concentration of oxygen in water is affected by the presence of chlorides (salt), which reduce the saturation concentration by about
0.015 mg/L per 100 mg/L chloride at low temperatures (5 to 10⬚C) and by about 0.008 mg/L per 100 mg/L chloride at higher temperatures (20 to 30⬚C) (Tebbutt, 1998). The following equation is recommended to account for the effect of salinity on the satura-tion concentrasatura-tion of dissolved oxygen (APHA, 1992):
(2.3)
where DOsis the saturated dissolved-oxygen concentration at salinity S, where Sis in parts per thousand (ppt). For high-elevation streams and lakes, the barometric-pressure effect is important, and the following equation is used to quantify the pressure effect on the satu-rated dissolved-oxygen concentration:
ln DOs⫽ln DOsat⫺S
冢
1.764⫻10⫺2⫺ ᎏ 10T .7
a
54 ᎏ ⫹ ᎏ21
T 4
a
0 2
.7
ᎏ
冣
TABLE 2.3 Saturation of Dissolved Oxygen in Water Temperature (⬚C) Dissolved Oxygen (mg/L)
0 14.6
5 12.8
10 11.3
15 10.1
20 9.1
25 8.2
30 7.5
35 6.9
DOP⫽DOsatPᎏᎏ[1⫺(1(⫺PwvP/P)](1ᎏ⫺θP)
wv)(1⫺θ) (2.4)
where DOPis the saturated dissolved-oxygen concentration at pressure P(atm),Pwvis the partial pressure of water vapor (atm), which can be estimated using the relation (Lung, 2001)
lnPwv⫽11.8671⫺ ᎏ384 T
0.70 ᎏ ⫺ ᎏ216
T ,9
2 61
ᎏ (2.5)
whereTis the temperature in ⬚C and θis given by
θ⫽0.000975⫺1.426⫻10⫺5T⫹6.436⫻10⫺8T2 (2.6)
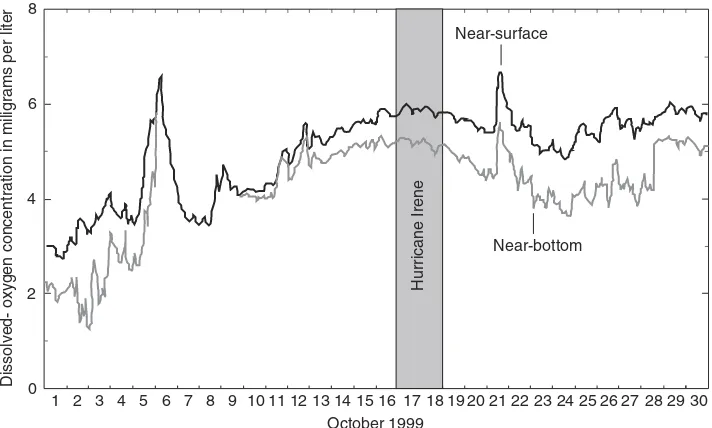
Cool waters typically contain higher levels of dissolved oxygen, and consequently, aquatic life in streams and lakes is usually under more oxygen stress during the warm sum-mer months than during the cool winter months. The minimum dissolved oxygen level needed to support a diverse aquatic ecosystem is typically on the order of 5 mg/L. An illus-tration of dissolved-oxygen fluctuations in the Neuse River at marker 38 in October 1999 is shown in Figure 2.6.
with the saturation concentration given by Equation 2.2? (c) What would be the effect on the saturation concentration of dissolved oxygen if saltwater intrusion causes the chloride con-centration to increase from 0 mg/L to 2500 mg/L? (d) Compare the saturation concon-centration of dissolved oxygen in freshwater at 20⬚C in Miami, where atmospheric pressure is 101 kPa, with the saturation concentration in Denver, where atmospheric pressure is 83.4 kPa.
SOLUTION (a) Equation 2.1 gives DOsatin terms of the absolute temperature,Ta, where
Ta⫽273.15⫹20⫽293.15 K. Hence, Equation 2.1 gives
This is the same value of DOsatfor freshwater given in Table 2.3. (b) According to Equation 2.2,
DOsat⫽ ᎏ
This is the same value (9.1 mg/L) as that given in Table 2.3 and calculated using Equation 2.1. Since Equation 2.2 is supposed to agree with Equation 2.1 within 0.03 mg/L, the cal-culated result is expected.
(c) The impact of salinity on the saturation concentration of dissolved oxygen is given by Equation 2.3, and the relationship between chloride concentration,c, and salinity,S, in seawater is given by
S⫽1.80655c (2.7)
whereSandcare in parts per thousand. In the present case,c⫽2500 mg/L⫽2.5 kg/m3⫽ 2.5/1000⫽0.00250⫽2.50 ppt, where the density of water is taken as 1000 kg/m3. Applying Equation 2.7 to estimate the salinity gives
S⫽1.80655(2.50)⫽4.52 ppt
and Equation 2.3 gives the corresponding dissolved oxygen as
ln DOs⫽ln DOsat⫺S
冢
1.764⫻10⫺2⫺ ᎏ10Therefore, increasing the chloride concentration from 0 mg/L to 2500 mg/L reduces the saturation concentration of dissolved oxygen from 9.1 mg/L to 8.8 mg/L, a reduction of approximately 3%.
(d) The impact of atmospheric pressure on dissolved-oxygen concentration is given by Equation 2.4. In this case, DOsat⫽9.1 mg/L, P⫽83.4 kPa⫽83.4/101.325⫽0.823 atm, andPwvis given by Equation 2.5 as