PROCEEDINGS
PREFACE
We are very pleased to present The 1st International Conference on Business, Economics, Socio-Culture and Tourism in Semarang University, Central java, Indonesia. The 65 abstracts were presented on 24th August 2016 formed the heart of the conference and provided ample opportunity for discussion. This change, allowing the conference to end with invited talks, was a departure from the format used of ICBEST gatherings in which the conferences ended with announcement of Best Paper. The abstracts were split almost equally between the four main conference areas, i.e., business, economics, socio-culture and tourism. The 1st ICBEST presents 2 keynote speakers from National Kaohsiung University of Applied Sciences - Taiwan (Prof. Jen-der Day, Ph.D) and Mahidol University International College - Thailand (Dr.Nipawan Thirawat), and many presenters from 5 countries (Indonesia, Malaysia, India, Pakistan and Australia). This international conference on Business, Economics, Socio-Culture and Tourism is as a medium for academic, scholar and practitioners on exchange information, research idea and as a discussion forum to open network on matters that need to be anticipated by the policy maker who caused the global powers.
All in all, the 1st ICBEST in Semarang, Central Java, Indonesia was very successful. The keynote speakers and the progress and special reports bridged the gap between the different fields of many subjects, making it possible for non-experts in a given area to gain insight into new areas. Also, included among the speakers were several young scientists, namely, postdocs and students, who brought new perspectives to their fields. Hopefully we able to continuing success of this conference series means that planning can now proceed with confidence for the next event.
TABLE OF CONTENT
Preface ... iii
Table of Content ... iv
Stepwise Strategies for Taiwan's Semiconductor Industry as Core Technology ... 1
Organizational Significance and Impact of Employee Value Proposition ... 9
Willingness to Pay as an Indication of Public Sharing in The Efforts of Improving Clean Water Service in Bekasi Regency... 17
Modelling of Timely Submission of Financial Statements in Manufacturing Companies Listed in Indonesia Stock Exchange ... 27
Banking Competition and Capital Ratios: Evidence From The Indonesian Banking Industry ... 35
Musharaka: Perceptions & Importancce ... 45
Social Capital and Innovation Capabilities: Strategic Resource to Improve Entrepreneurial and Performance of SMEs Creative Industry ... 55
Entrepreneurial Orientation, Access to Finance and Business Performance: A Preliminary Study... 65
Underwater Cultural Heritage in Karimunjawa Islands ... 75
The Impact of Service Quality on Customer Loyalty Toward Customer Satisfaction as Intervening Variable (Case Study on Alam Indah Restaurant Semarang) ... 83
Analysis Macroeconomic on Islamicity Performance Index Through Third Fund Third Parties The Islamic Cooperation ... 93
Budgetary Goals Characteristics and Managerial Performance ... 107
Questioning The Readiness of Manado as a Tourism Destination; Poor Service of Waitresses in The Local Restaurants ... 113
The Effect of Market, Innovativeness and Crativity Marketing Strategic on Marketing Performance: A Research From Welahan Jepara Rattans SME ... 123
The Model of Relationship Quality Student Loyalty ... 131
Masjid Raya At-Taqwa Cirebon as an Alternative Tourism Religi... 143
Fraternal Culture in Build Harmony Selling Price Determination: Perspective of Kejawen Panunggalan Community ... 155
The Role of Coaching Organization Forum Peduli Remaja Jambi (FPRJ) Applicative Value of Planting Means The Religion of Islamic with Mentoring... 167
Readiness of Traditional Fishermen in Kali Adem, Muara Angke Jakarta in Using Smart Fishermen Information System ... 175
Company‘s Measurement and Management Substitution as an Indication of the Change in PublicAccountingFirms at Manufacturing Companies Listed in Indonesia Stock Exchange... 187
Repeat Purchase Intention in Freight Service Company in Semarang ... 193
Japanese Honorifics Speech within Tourism Vocabulary Used by GRO Staff at HIS Information Centre in Ubud ... 203
Capital Structure, Working Capital, Firm Performance and Firm Value: An Empirical Study in Manufacturing Industry on Indonesia Stock Exchange ... 211
Earnings Response Coefficient (ERC): Market Reaction to Earnings Announcement ... 219
Capital Expenditure Budget Allocation (Provincial Government of Indonesia) ... 237
Analysis of Knowledge of Entrepreneurship, Self Efficacy, and Attitude to Intention Entrepreneurship Entrepreneurial Women (Case Study of Koperasi Setia Bhakti Wanita Surabaya) ... 257 Orientation Marketing Partnership Increase in Operating Performance of The Company: A Theoretical Development (Development Model At Company Multifinance in Indonesia)... 269 Implementation Program of Corporate Social Responsibility at Batik SMEs in Kampung Batik Semarang ... 289 Capital Intencity Ratio (CIR), Firm Size (SIZE), Earning Per Share (EPS), Debt to Equity Ratio (DER), and Dividend Payout Ratio (DPR) to Financial Performance (ROA) With Earnings Management as Variable Moderating. (Study on Manufacturing Company Food And Beverage Sector That Go Public In Indonesia Period 2010-2014) ... 297 Factors – Alignment of Factors Affecting The Provision of Income Smoothing Assets: (Practice Management Income on Islamic Banking in Indonesia in 2011-2015) ... 305 The Analysis of Business Performance of SMEs ... 315 The Impact Factors of Default Risk ... 329 Job Characteristics and Perceived Organizational Support as Driving Employee Engagement (A Study on Employee PT. Semen Indonesia) ... 339 Socio-Economic Impact of Islamic Microfinance: An Overview of Malaysian Experiences ... 347 Effect of Non Financial Factors on The Financial Performance ofFarmer Cooperatives in Bali ... 355
STEPWISE STRATEGIES FOR TAIWAN'S SEMICONDUCTOR INDUSTRY
AS CORE TECHNOLOGY
Jen-Der Day1& Muhammad Farid2
1Dept. of Industrial Engineering and Management,National Kaohsiung University of Applied
Sciences,Taiwan
2College of Engineering, Universitas Negeri Makassar, Indonesia
([email protected], [email protected])
ABSTRACT
Even thoughTaiwan is small, she has become the industry‘s leading in the field of semiconductor. The result can be seen, Taiwan occupies a position in the semiconductor industrydevelopment. The semiconductor manufacturing equipment export markets is number one in the world in 2016 and contributed the Taiwan export amount to 41.4% in 2015. To determine a core technology requires a decision-making process considering existing resources potential and competent to other countries that have been and will develop theircore technologies. To find out how Taiwan government prepares their process, this article discusses the stepwise strategies adopted by Taiwan‘s government to define the core technology and prepare the policies to support that realization. A variety of data, including government policies, industrial technology research institute programs, research universities, industry and economic news, and relevant literature are surveyed. Four stepwise strategies are developed as follows. Firstly, fast-follower approach makes a critical decision determining semiconductor industry. Secondly, establish industrial technology research institute (ITRI). Thirdly, initiate development Hsinchusciences park (HSP), and finally linkage between universities and industry to integrate academic-industrial resources. The study suggests that stepwise strategies to develop and maintain core technology in competitive semiconductor technology challenge to create innovation step by step.
Keywords: Semiconductor Industry, Core Technology, Stepwise Strategies, ITRI.
1. INTRODUCTION
Competitiveness of a nationrelies upon the ability of its industry to innovate and improvement, to compete and survive in an era of global competition. Companies gain advantage against the world‘s best competitors
because of pressure and challenge. Demands and dispute make firms expand enhancement against the
world‘s best(Porter, 1990). According to the World Economic Forum (2015), there are 12 pillars that affect the global competitive index, among others: Institutions, infrastructure, macroeconomic environment, higher education and training, technological readiness, , financial market development, business sophistication,good market efficiency, market size, labor market efficiency, and innovation.
A technological factor affecting the country becomes an important point in increasing competition index. In addition, the ability of a country to determine the core technology and also take a strategic step in determining policies and deciding that technology will have an impact on the competitiveness of nations. Having regard to the ability of internal resources and external conditions with attention to technology that has been and will be developed other nations. This will give an estimate in terms of policy making the right technology in a country. Superior technology and core technology will provide an overview of each country in a position to determine the direction that technology will take.
Taiwan as small island country has the potential of such natural resources and human resources. The ability to determine the excellent and core technology is ushering Taiwan became one of the world's largest semiconductor exporter. There are three questions, 1) How do Taiwan‘s strategic steps in determine its
superior technology and core technology?, 2) How can Taiwan survive with an increasingly competitive environment?, and the last 3) How to face the challenges in the future.
2. IDENTIFYNG CORE TECHNOLOGY
technologies in accordance with their capabilities. For example Japan define as core automotive and electronics technology, and South Korea select electronics as a base technology.
Some potential industry from Taiwan those have been developed and have become export commodities include electronics, flat panels, energy, agriculture, machinery, petrochemicals, metals, textiles, plastics, and chemicals. Based on the results of studies conducted by the Taiwanese government in 1970 to make critical decisions by adopting a fast-follower approach (Wang & Chiu, 2014). In 1973, the government established Industrial Technology Research Institute (ITRI) has been committed to serving industries stay sustainable and competitive.
SEMICONDUCTOR INDUSTRY DEVELOPMENT
According to Greve (2012) ―Semiconductors are materials that have an electrical conductivity intermediate
between the electrical conductivity of good conductor (such as aluminum and copper) and good insulators (some glasses and plastics). Semiconductor technology refers to sequence of process steps used to fabricate
semiconductor devices‖ (p. 2).
By the end of 2014 (Table 1), Taiwan semiconductor industry involved of 16 fabrication companies, 245 IC fabless design houses, 7 substrate suppliers, 37 packaging and testing houses, 11 wafer suppliers, 14 lead frames company and 3 mask makers.
Table 1: Taiwan Semiconductor Industry
No Company Amount
1 Fabrication 16
2 IC fabless design houses 245
3 Substrate suppliers 7
4 Packaging and testing houses 37
5 Wafer suppliers 11
6 Lead frames 14
7 Mask makers 3
Total 333
Source: Taiwan Semiconductor Industry Association (TSIA) 2015
Figure 1. Taiwan Export Source: Worksman (2016)
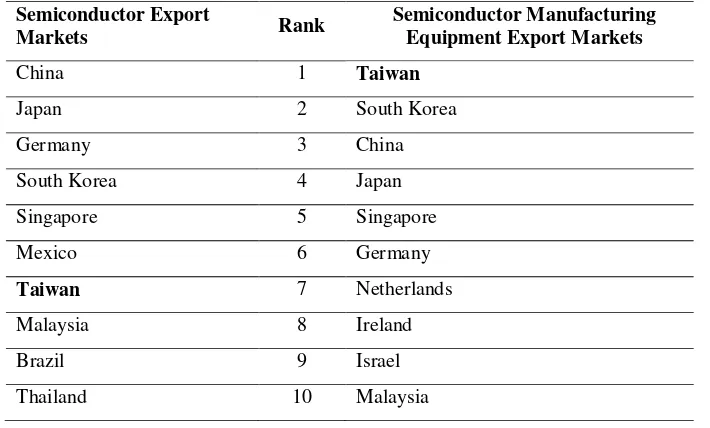
billion (4.1%), medical, technical equipment: $17.8 billion (6.4%),Plastics: $18.5 billion (6.6%), machines, engines, pumps: $29 billion (10.4%), and electronic equipment: US$116 billion (41.4% of total exports). According to International Trade Administration (ITA) (2015) positioning Taiwan rank the seventh in a top semiconductor export market to 2016 and the first rank in top semiconductor manufacturing equipment export markets can be seen in Table 2.
Table 2: Top Semiconductor and Manufacturing Equipment Export Market to 2016
Semiconductor Export
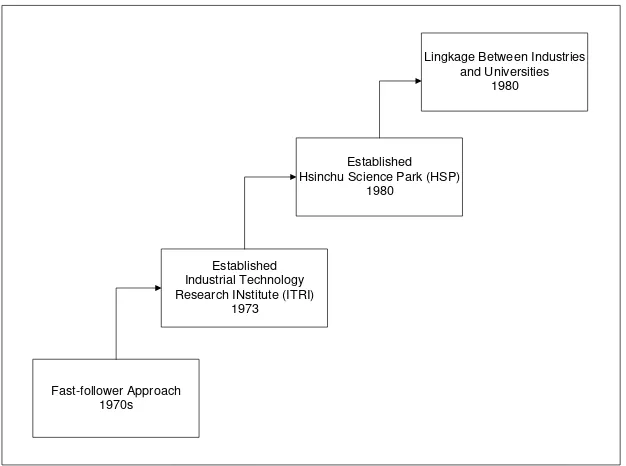
Figure 2. Stepwise Strategies of Taiwan to develop Semiconductor Technology
4.1. Fast-Follower Approach
According Wunker (2012) firms or countries searching for approaches to support development by catching new markets, there is a squeezing need to ponder in case it‘s sensible to be alate follower, fast follower orearly mover.Every of these alternatives requirea different competitive strategy. A more astute methodology is to watch how early mover preferred standpoint may bond initiative in specific markets, after consider what methodologies and industry environmentsaccept fast followers or late followers in different settings to triumph.
Firstly early mover approach,if the suitability of an early mover position is controlled by the components, an organization meeting these criteria ought to drain its points of interest for all they are worth. Secondly fast-follower approach, fast-followers require the control to keep and after that to move rapidly before an industry's aggressive request gets to be an unavoidable. In any case, there is a basic admonition: Many organizations think that its difficult to be a fast follower; when they get the chance to showcase fundamentally, they will be past the point of no return. Due to variables, for example, decision-making timeframes, product-improvementsequences and the distance of the sales procedure, an organization's consequent passage into a rapidly moving business sector might be so deferred as to be superfluous (Wunker, 2012).
Taiwan government has acted a critical role in the development of Taiwan Semiconductor Industry (TSI). In the 1970s, as a result of little size of nationalcompanies and their falling behind externalcompanies in technology and innovation, the government created a strategically basic choice to begin TSI by adopting fast-follower approach. It implies the government would endeavor to secure technological abilities from foreign sources and give essential assets to begin domestic pioneer research (Wang & Chiu, 2014).
With a suitable fast follower approach to begin the industry, trailed by the fruitful improvement of a positive industrial nature and creative plans of action, and reinforced by a hard-working and knowledgeable workforce fit for reacting to change with prodigious organizational and operational adaptability, Taiwan semiconductor industry has prospered to end up a top player in the worldwide semiconductor market. This achievement has additionally added to the accomplishment of other innovative commercial ventures in the country (Wang & Chiu, 2014).
4.2. Industrial Technology Research Institute (ITRI)
So as to empower the national industrial segment to put resources into research and development deeds, the real type of government specialized help to industry is to contract non-profit research organizations to perform non specific innovative improvement and after that to exchange their research outcomes to the national industrial segment (Hsu & Chiang, 2000).
Fast-follower Approach 1970s
Established Industrial Technology Research INstitute (ITRI)
1973
Established Hsinchu Science Park (HSP)
1980
Lingkage Between Industries and Universities
The government established ITRI has been dedicated to helping industries stay competitive and sustainable. Since 1973, this institution is a nonprofit R&D organization aiming to innovate a improve future, engaging in applied research and technical services. ITRI has played a vital role in Taiwan's economic growth as it shifted from a labor-intensive industry to a value-added, innovation-driven one.
As a national research institute, ITRI attempts connected research with the mission of quickening industrial technology improvement in Taiwan to advance industrial development and social prosperity. Generally, ITRI publishes research results to the industrial segment in time with the end goal of keeping up the intensity of national industries in the worldwide business sector. Mainly, It gives facilities and assignments the technology improvement to small and medium entrepreneurial firms (Hung & Chu, 2006).
Moving forward, the organization will keep serving as a pioneer for industries by establishment its abilities of multidisciplinary advancement and collaboration with global accomplices everywhere throughout the world. Services delivered of ITRI to the industry in Taiwan, including: industrial consultancy services, new ventures, education, and training service, testing and certification, open lab/incubator, technology transfer, and R&D collaboration (ITRI, 2016).
4.3. Hsinchu Science Park (HSP)
Developed in December 1980, the Hsinchu Science Park (HSP) with a specific end goal to pull hi-tech entrepreneurs and encourage their progressive in Taiwan. It is entirely government oriented, for instance, by competently supported one stop service;the improvement of accessible area with infrastructure facilities; national and global network; automated customs service and on-job coaching. Through its proceeded with endeavors, the pursuing industries have been effectively created: Integrated Circuits (IC), Computers and Peripherals (C&P), Telecommunications (Telecom), Biotechnology (Biotech), and Precision Machinery (PM). Its performance additionally exhibits its honor in appropriate as benchmarking model of first hi-tech industry improvement in Taiwan furthermore its exceptionally good reputation in the world (Lee & Yang, 2000).
HSP give effect to accelerate the development process of semiconductor industry. If we look at Figure 2 shows the increase in the number of firms from year to year increased significantly. Firms that join at the beginning totaling 17units, along with the growth and increasing activities in the field of electronics by 2015 company in HSP amounted to 478 units.
Figure 3. Firms in HSP
Source: http://www.sipa.gov.tw/english
Further aspects of the total sales in HSP, based on the figure 3 below shows the fluctuations in sales at the beginning of the establishment precisely in 1985 still amounted to US$ 3.27(hundred million).The next year to increase rapidly through 2007 reached US$ 357.79(hundred million).When the economic crisis in 2008, sales decreased until 2009. Then rose again in 2010 and then fluctuated until 2015 to reach US$ 343.70 (hundred million).
cooperative operations could encouraged R&D innovative investment, 3) upgraded the national core competence, 4) encouraged the hi-tech quality of life society for public progress development, 5) for the next local hi-tech industry expansiondesign by provided a worthy real references model, 6) best fit adaptation by demonstrated permanent dynamic flexibility.
Figure 4: Combined Sales in HSP Source: http://www.sipa.gov.tw/english (2016)
4.4. Linkage Between Universities and Industry Resources
In addition to supported by the research institute that has been founded at the beginning, also sustained of research on product development and innovation prospect. These two institutions that encourage Taiwan could persevere through the competition in the semiconductor technology. System for technology diffusion between industry and universities to combine academic assets and successfully direct R&D outcomes, a strategy of Taiwan government (MOEA) launched three disseminations into practice, one of them are Technology Transfer Centers (TTCs) and universities (Mathews & Hu, 2007).Industrial Technology Research Institute, National ChiaoTung University (NCTU),and National TsingHuaUniversity (NTHU), there are research and educational institutes nearby region of the HSP (Lee & Yang, 2000).
Table 3: Piloting Cooperation Project Between Industries and Academia
at Science Parks, statistics, 2010-2014
Year Cases (Units)
Amount
(US$ 1 Million)
R&D Personnel from participating companies
(Persons)
High-tech industrial Manpower training
(Persons)
2010 33 4.431 538 197
2011 23 2.634 313 123
2012 21 2.546 265 106
2013 20 2.390 260 96
2014 18 2.186 245 79
Total 115 14.188 1,621 601
Source: HSP Annual Report (2014)
Based on HSP annual report (2014) description piloting cooperation project between industries and academia at science parks. During 2010-2014 total cases 115 units or average 23 units per year. The grants research project total US$ 14.188 Million or average US$ 2.837 Million per years. R&D personnel from participating companies amount 1,621 personnel or average 324 personnel per year. Furthermore, high-tech industrial manpower training amount 601 people or average 120 people per year shown in Table 3.
0 100 200 300 400
Combined Sales in HSP
5. FUTURE TECHNOLOGICAL CHALLENGES
With experiences that have been there, Taiwan can contribute to the development and advancement of the global semiconductor industry technology to affect the development of the nation. On the other hand, whether there has been this experience will lead Taiwan to be able to survive in global competition and able to respond to the dynamic changes in the semiconductor industry.
ITRI role in conducting research and development is crucial challenges of technological change. At the beginning of its founded to focus on the semiconductor industry, along with the development then expanding the study in several fields of research. Publication ITRI spring Issue (2016) featuring some of the latest research results, among others: New development Internet of things (IoT), panel display industries, self-driving cars and drones, green industry application, LED Technology creates new value for agriculture, water technology, next -generation technology for desalination.
6. CONCLUSION
During five decades, Taiwan has able to survive and develop semiconductor technologies and industry. It is caused by government policy in determining the strategic steps and encourages innovation in following market needs. Four stepwise were carried out starting fast-follower approach to making a critical decision determining semiconductor industry, in 1973 establish industrial technology research institute (ITRI), in 1980 establish Hsinchu Science Park (HSP), and develop semiconductor research with collaboration universities and industries.
Challenges ahead, if Taiwan was able to survive with the competition getting tougher with countries that earlier develop industry or the emergence of new countries that try to develop this technology. In order to survive in the competitive semiconductor industry, Taiwan continues to innovate in the field of semiconductor technology.
In addition, developing other technologies to be an alternative to sustain the core technologies that have been run. Industry developed, among others: optoelectronics, computer and peripherals, telecommunication, precision machinery, and biotechnology. This will provide support in Taiwan's technology and industry in the future.
7. REFERENCES
Dahlman, C.(2007). Technology, globalization, and international competitiveness: Challenges for developing countries. In: United Nations Department of Economic and Social Affairs (ed): Industrial Development in the 21st Century:
Sustainable Development Perspectives. New York: United Nations: 29-83,
http://www.un.org/esa/sustdev/publications/industrial_development/full_report.pdf (27.08.2012).
Lee, W-H. & Yang, W-T.(2000).The cradle of Taiwan high technology industry development-Hsinchu Science Park (HSP), Technovation, 20, 55-59.
Grave, D.W.(2012).Semiconductor devices and technology,
file:///F:/Paper%20Prof.%20Jen%20Der%20Day/gREVE%20(2012)%20SEMICONDUCTOR%20DEVICES%20A ND%20TECHNOLOGY.pdf
Hsinchu Science Park (2014).Annual Report. http://pavo.sipa.gov.tw/sipaCa/AReport/103/en/index.html#
Hsu, C-W. & Chiang, H-C.(2001).The government strategy for the upgrading of industrial technology in Taiwan, Technovation, 21, 123-132.
Hung, S-C.& Chu, Y-Y.(2001). Simulating new industries from emerging technologies: challenges for the public sector, Technovation, 26, 104-110.
ITRI (2015). Innovating a better, ITRI Brochure,
https://www.itri.org.tw/eng/Content/Publications/book_abstract.aspx?&SiteID=1&MmmID=617731525164776565 &CatID=617756023740326001
ITRI (2016).How ITRI's LED technology creates value for agriculture, ITRI Today, 84 Spring Issue.
Mathews, J.A.& Hu, M.C.(2007). Enhancing the role of universities in building national innovative capacity in Asia: the case of Taiwan, World Development, 35 (6),1005–1020.
TSIA (2015).Overview on Taiwan Semiconductor Industry, http://www.tsia.org.tw/Uploads/2015%20Overview-Final.pdf TSIA (2016). http://www.tsia.org.tw/en/index.php
Wang, C-T & Chiu, C-S.(2014). Competitive strategies for Taiwan's semiconductor industry in a new world economy, Technology in Society, 36, 60-73.
World Economic Forum (2015).The Global Competitiveness Report2015-2016, http://www3.weforum.org/docs/gcr/2015-2016/Global_Competitiveness_Report_2015-2016.pdf
Workman, D.(2016). Taiwan's Top 10 Export, World's Top Export http://www.worldstopexports.com/taiwans-top-exports/
ORGANIZATIONAL SIGNIFICANCE AND
IMPACT OF EMPLOYEE VALUE PROPOSITION
Avinash Pawar
University of Pune, Rajiv Gandhi Business School (Corresponding Email: [email protected])
ABSTRACT
Employee Value Proposition (EVP) is the balance of the rewards and benefits that are received by employees in return for their performance at the workplace. Organizations generally develop an EVP to provide a consistent platform for employer brand communication and experience management. In this study, researcher has discussed about many aspects related to the significance and impact that employee value Proposition creates on the organizations. The study starts with discussing factors that comprise Employee Value Proposition and the way these factors weigh against one another. An endeavor has been created to determine however these factors modification happens with strategical changes. These expressed factors will then be compared with the Employee Value Proposition factors of assorted different firms to envision however the factors expressed are enforced. This study any discusses however alongside keeping the strategy of the corporate seeable and benchmark exercises and surveys for Employee Value Proposition for a company will be sculptured.
Keywords: Employee Value Proposition (EVP), Career Development, Compensation, Offerings and Benefits
1. INTRODUCTION
Employee's value proposition has begun picking up good faith until since the ideas of talent management, employee retention, wearing down and employer branding and so on has picked up prominence. Caught between these two assumptions lies the actual effectiveness of the concept, which has helped a lot of organizations in giving their employees what they actually expect, in increasing engagement, in bettering efficiency and in slashing turnover rates. Discussed below are the underlying factors and research which has gone into the nativity of the concept of an Employee Value Proposition. The HR professionals many a times looks at it, if at all, as a document which they need to create because competition around them is creating one whereas the line managers consider it an ineffective piece of paper which adds to their budget and has no consequential use in helping them increase the top line. For a long time now Employee Value Proposition has been a rather defied topic in the field of Human Resource Management. Different articles as under have acknowledged the helpfulness of employee's value proposition as a vital employment branding apparatus. In the article" connecting the Employee's Value Proposition and business results: preparatory discoveries from a linkage research pilot study (Heger Brian K., 2007) uncovers that Employee's value proposition has been recommended to be a determinant of employee engagement and retention, both of which affect basic business results. An article distributed "the war of talent" in the McKinsey Quarterly, recommended that organizations with prevalent Employee's Value Proposition helps customizing an organization's "brand" and "products" the occupations it brings to the table to speak to the particular people it needs to discover and keep.
1.1 Why do companies have an EVP?
Most companies have an employee value proposition to: 1) Attract, motivate, and retain the right talent 2) Provide line-of-sight to the company‘s culture.
It also helps provide line-of-sight between the firm brand, leadership brand, and employee brand. To be effective, the EVP needs to be more than a mere corporate tag line or words on a piece of laminated paper. The EVP needs to be made real to employees and also has to provide clear principals/guidelines that are globally shared but adaptable to different geographies, talent segments, and industries. It‘s a theory, no it‘s a
training, or wait, is it just a fancy document? These are the most frequent comments which pop up in the
mind of a ‗layman‘ when the term EVP or Employee Value Proposition is discussed. The problem gets more
serious when HR professionals not deft with the concept may agree to its importance but put it on a backburner or even worse, create something not up to the mark. Truly, a half-baked EVP can be much worse
organization, but also scares away new talent. The concept is very new to the HR industry and it is only in the period over last few years that organizations have acknowledged the importance and the impact that an EVP can have on all facets of HR be it employee recruitment, selection, engagement or retention.
2. THEORETICAL FRAMEWORK
For the uninitiated, it is an answer to the employee‘s questions: ―What‘s in it for me?‖ and ―What more can you offer?‖Formally, Minchington (2005) defines an Employee Value Proposition (EVP) as a set of associations and offerings provided by an organization in return for the skills, capabilities and experiences an employee brings to the organization. It is an employee-centered approach that is aligned to existing, integrated workforce planning strategies as it has been informed by existing employees and the external target audience.
Tandehill (2006) reinforces it as a statement of why the total work experience at an organization is superior to that at other organizations. The value proposition should identify the unique people policies, processes and
programs that demonstrate the organization‘s commitment to i.e., employee growth, management
development, ongoing employee recognition, community service, etc. It should list out the central reasons that people will choose to commit themselves to an organization.
EVP, of late has become closely related to the concept of employer branding, and the term EVP is being used
to define the underlying ‗offer‘ on which an organization‘s employer brand marketing and management
activities are based. In this context, the EVP is also often referred to as the Employer Brand Proposition.
2.1 Pillars of Employee Value Proposition
Gone are the days when the employer defined the workplace. According to a NASSCOM-McKinsey report, only 25 per cent of fresh engineers; and a mere 10% of fresh graduates are actually employable, giving the employable talent pool (old and fresh), an uncanny leverage over employers. They want a better understanding of their employment options and a greater say in how work is assigned, assessed and
rewarded; rather, employees‘ priorities and preferences dictate what the workplace should look like,
particularly now that technology makes it easier than ever to design a variety of flexible arrangements. Companies operating with both young and aging workforces have to craft methods to engage and re-engage the talent and those that fail to respond to this change and do not succeed in defining their employee value proposition will fail to attract, retain or develop talent effectively.
As an EVP affects both internal and external perceptions of a company, human resource professionals should act as a facilitator among the various verticals and should ensure collaboration to ensure the employee and customer experiences are integrated and aligned. According to Tandehill Human Capital Consulting, some questions which should be answered during the collaboration include:
1) How unique are our non-traditional rewards? For example, Nucor offers $2,000-per-year college scholarships to each child of an employee who has more than 2 years of service. The Levi Strauss Foundation donates $500 to community organizations in which an employee actively participates for
a year. McDonald‘s give 3 months sabbatical after 10 years of service.
2) How are we better at our management? For example, Boeing has a ―no messenger‖ policy. Team
members must solve problems on the spot and are discouraged from finding a manager to solve it. Whole Foods runs its grocery, baking and produce departments with self-managed teams. Self-directed work teams at Baylor Medical Centre set their own schedules and do their own interviewing and hiring.
3) What makes our culture special? For example, Starbucks creates an inclusive culture by providing part-time employees with full benefits and stock options. First Federal Bank of California has an informal culture reinforced by a policy that requires employees to address each other on a first-name basis. And among the many ways Ben & Jerry‘s differentiate itself as it donates 1 percent of profits
to programs that support peace.
After defining all of the above, then the company discusses the role compensation plays in the employment value proposition. The pay should exist to provide employees with a fair return on the investment they make of time, skills and energy, but ideally, it should not be the fundamental reason they come to work. According to Jeffrey Pfeffer, professor of organizational behavior at Stanford Business School in the May 1998 edition of Harvard. Business Review, ―People work for money, but they work even more for getting meaning out of
employees and will pay the price in lack of loyalty and commitment.‖ According to a survey done by Mercer, the top drivers for employee engagement are as shown in the figure on the left. It is evident that employees consider Career Development, Confidence in senior management and Recognition as the three most important factors for being engaged with their work.
3. ATTRIBUTES OF EVP
Sibson Consulting has created a ―Reward of Work‖ (ROW) model which talks about reward elements and the
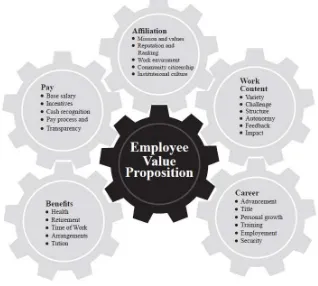
process of creating a ‗formalized‘ clear framework for building a total rewards strategy which translates into a proposition of value for the employees. Under this approach, rewards, both financial and non-financial are prioritized according to the needs and preferences of key talent segments in an organization. This EVP framework has five elements:
Compensation: The money employees receive for their work and performance Benefits: Indirect compensation including health, retirement, and time off Work content: The satisfaction employees receive from their work
Career: The long-term opportunities employees have for development and advancement Affiliation: The feeling of belongingness employees have towards the organizations
4. RESULTS AND TRENDS
4.1 Employee Engagement Trends
Figure 2: Employee Engagement Trends in Asia
Source: Employee Engagement Trends in Asia – Survey (May, 2010)
Organizations need to consider this as a skeleton framework and understand and design their own value proposition, the preferences of their staff, and the causes of any gaps between employee and/or organization aspirations and the actual EVP.
Sibson then went on to study the importance which different age groups within an organization attach to the five elements. The data from Sibson Consulting ―Rewards of Work‖ study, based on 1,059 respondents,
reveal the elements that employers can use to drive employee performance over the course of their careers. The research shows that:
1) Benefits are of average importance for employees of all ages. Employees aged 30 and younger rated benefits fourth for driving performance. Benefits tied for fourth place among workers ages 31 to 50; tied for third for those ages 51 to 60; and ranked third among those aged 61 and older. Surprisingly, the youngest respondent group was the most likely age group (62%) to rate benefits as important or very important. This finding does not indicate that benefits are less important to older employees than to younger employees, but it does indicate that benefits tend to become less effective motivators as people age.
2) Work content is the top motivator for every age group. Respondents of every age chose this element as the primary driver of good performance. It was the only element to maintain the same relative importance in each age group.
3) Career elements, such as title, status and opportunities for growth, decline in value among older employees. Career elements were rated second most important by employees age 30 and younger. They slipped to a third place for workers ages 31 to 50 and finally dropped to last place for respondents age 51 and older. While 81% of workers age 30 and younger indicated that career elements were important or very important in motivating their performance, only 41% of those older than 60 agreed.
4) Compensation gains - and then loses - importance as the age brackets progress. Although employees age 30 and younger ranked compensation as the third most important motivator, it rose to second place for those age 31 to 60. Once employees reached 61 and older, however, compensation fell to fourth place.
employees reached age 51 to 60. At that point, it rose to fourth place, only to leap into second place among those aged 61 and older.
Generally, most of the elements lose some of their ability to motivate performance among older employees. The opposite is true for affiliation. It is interesting to note that after age 30, less than two-thirds of respondents said they were motivated to perform by affiliation, career, compensation and benefits. Thus, while tailoring elements to each employee is not advisable or practical, knowing how cross sections of the workforce perceive these elements can help organizations communicate its offerings for optimal impact. A company may be able to improve its ability to motivate and engage its workers by understanding what elements to focus on to yield the greatest return on investment. A program that gives an organization the flexibility to adapt and communicate reward vehicles as needed, will be a more effective motivator than one that adheres to a rigid, one-size-fits-all message. Given the differences in what motivates employees in different age groups, as the demographics of the workforce shift, organizations should consider whether their employee value proposition needs to shift as well.
An article on Talent and Analytics talks about ways of using analytics to calculate what employees value most, and by using that data to create a model that will boost retention rates. This application of analytics
leads to predictive action, a rung on the ladder in which companies anticipate employees‘ preferences and
future behaviors and tailor HR practices to help them hold on to their valuable talent. This was the approach taken by Convergys, a company that manages billing, payroll, benefits and pensions for businesses in 40
countries. After the company‘s initial public offering in 1999, the Convergys workforce doubled to 35,000,
but turnover was a major headache – the company had to recruit 50,000 new people in 1999 to maintain that level of staffing. To reduce attrition, Convergys turned to a consumer marketing technique, conjoint analysis. When used with products, such analysis helps companies determine how people value different combinations of features. When used with employees, it helps companies figure out the mix of benefits most likely to encourage people to stay with the organization.Accenture is working to map their EVP into their delivery framework. The emphasis is on their programs and processes and ways to bring the EVP to life though these. They use an employee experience framework, which helps them connect the EVP framework to their HR processes.
At Statoil, how goals are delivered is just as important as what is delivered. Both are important and valued equally at Statoil and linked to employee reward and recognition programs.
As the member practices show, there is a menu of options when it comes to trying to make EVPs a reality in the organization. These examples highlight the need to focus on how companies communicate with their employees, how work is done and delivered, providing role clarity, establishing patterns, linking EVPs to recruiting efforts, linking EVPs to the performance management system, producing scorecards, providing leadership autonomy for local adaptation, providing events and programs to reinforce the EVP, and mapping the EVP to the HR delivery system.
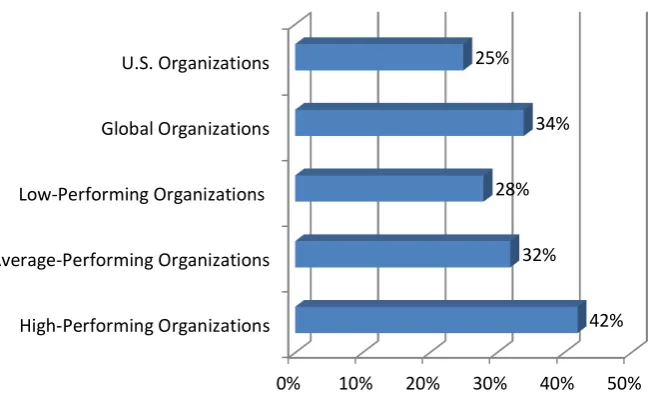
4.2 Effectiveness of Employee Value Proposition
Figure 3: Classifying Percentage of Organizations with Formalized EVPs
Source: “Creating a sustainable Rewards and Talent Management Model.”, Global Talent Management and Rewards Study, Towers Watson (2010)
According to a research article (Attracting and Retaining Critical Talent Segments, Building a Competitive Employment Value Proposition, Corporate Leadership Council, Corporate Executive Board, 2006), an effective EVP provides organizations with quantifiable benefits:
Improved attractiveness: Organizations with effective EVPs are able to source from a much deeper pool of talent in the labor market. Top-performing organizations draw candidates from about 60% of the labor
market, including ―passive‖ candidates who would otherwise be content to stay with their current job. Lesser -performing organizations are able to source only from the most active 40% of the workforce.
Greater employee commitment: Organizations with effective EVPs enjoy significantly higher levels of commitment from their employees. Top-performing organizations have 30-40% of their workforce displaying high levels of commitment, compared to less than 10% in under-performing organizations.
Compensation savings: Organizations with effective EVPs are able to reduce the compensation premium required to attract new candidates. Top-performing organizations are able to spend 10% less on base pay compared to under-performing organizations.
5. CONCLUSION
A Well designed Employee Value Proposition (EVP) can help to attract the talent, increasing Employee Engagement and Organizational Performance
A strong employer brand that helps you create competitive advantage in the talent market begins with a well-defined Employee Value Proposition (EVP). Employer brand is the impression candidates have of a company and what it would be like to work for that company.
The employee value proposition defines the full array of elements a company delivers to employees in return for the contribution they make to the organization. It‘s a deliberate construct of the underlying ―offer‖ on which the organization‘s employer brand is based. According to research by the Corporate Leadership Council, a well thought through and executed EVP can:
Improve the commitment of new hires by up to 29% and Reduce new hire compensation premiums by up to 50%.
Increase the likelihood of employees acting as advocates from an average of 24% to 47%.
Helps you attract and retain talent you might otherwise lose to organizations with more attractive EVPs and appeal to people in different markets and tough-to-hire talent groups.
Helps you re-engage a disenchanted workforce and understand your HR priorities. Helps you gain a reputation as a great place to work.
0% 10% 20% 30% 40% 50%
High-Performing Organizations Average-Performing Organizations Low-Performing Organizations
Global Organizations U.S. Organizations
42% 32%
Show a turnover rate up to 40% lower than companies with lower levels of engagement Gain up to 18% higher levels of productivity and 35% more efficiency
Be 59% more likely to innovate
Improve customer loyalty: 41% of customers are loyal because of good employee attitude Improve customer experience: 70% of brand experience is determined by people experience
6. REFERENCES
Backhaus, K, &Tikoo. S., (2004). Conceptualizing and researching employer branding. Career Development International, 9(5), 501-517.
Bergstrom, K., & Anderson, M. (2001). Delivering on promises to the marketplace: using employment branding to build employee satisfaction. Journal of Integrated Communications.
Corporate Executive Board. (2006). Attracting and retaining critical talent segments, identifying drivers of attraction and commitment in the global labour market.
Corporate Leadership Council Research. (2006). Employment Value Proposition Survey. Corporate Leadership Council Research. (2012). Employment Value Proposition Survey.
Eshiteti S, Okaka, O., Maragia, S., Odera, O. and Akerele, E. (2013). Effects of Succession Planning Programs on Staff Retention. Mediterranean Journal of Sciences
Handler, C. (2007). Hiring for potential vs. Skill: Hiring for potential vs. hiring for key knowledge, skills and experience. Heger, B.K. (2007). Linking Employment Value Proposition (EVP) to Employee Engagement and Business Outcomes:
Preliminary Findings from a Linkage Research Pilot Study. Organizational Development Journal, 25(2): 21 -33 Kathy Kibbe, Laura Sejen, Kathryn Yates. ―why an Employee Value Proposition Matters: Creating Alignment,
Engagement and Stronger Business Results,‖ Towers Watson, October 13, 2010
http://www.mercer.com.hk/webcasts/OptimizingYourBenefitsInvestment
http://www.sibson.com/services/organization-and-talent/employee-value-proposition/
Talking ‗about my generation: Segal examines what motivates employees of different ages. By Trevor Kunkle and Aaron Sorensen (September 1, 2008)
Talent and analytics: new approaches, higher ROI by Jeanne G. Harris, Elizabeth Craig and David A. Light; Journal of Business Strategy. VOL. 32; NO.6, 2011
Towers Watson, ―Creating a sustainable Rewards and Talent Management Model.‖, Global Talent Management and
Rewards Study 2010.
WILLINGNESS TO PAY AS AN INDICATION OF PUBLIC SHARING IN THE
EFFORTS OF IMPROVING CLEAN WATER SERVICE IN BEKASI REGENCY
Ninin Gusdini1), M.Yanuar J Purwanto2), Kukuh Murtilaksono3) and Kholil4)
1)A Student of Natural Resources Management Study Program– IPB 2) Department of Civil and Environmental Engineering - IPB 3) Department of Soil Science and Land Resources Management - IPB
4) Environmental Engineering Study Program-Usahid
(Corresponding Email: 1)[email protected])
ABSTRACT
Clean water services fulfilling the quality, quantity, continuity and affordability requirements are absolute in each effort of meeting clean water needs. The government as the authority holder in the efforts of fulfilling public needs for clean water requires the support and cooperation from numerous stakeholders, including the community. The public support may be indicated based on their willingness to pay for various attempts related to improvement of clear water service. The research is aimed to analyze the amount of public‘s willingness to pay as an indication of public sharing value and to identify the level of public affordability for clean water. The method used in this research was the Contingent Valuation Method (CVM). The results indicate that nominally, the amount of public sharing increases in line with increasing income, as indicated by the WTP value. The public willingness to pay with pipeline service is higher than the non-pipeline services in each income group. The amount of individual WTP in Bekasi Regency, at around IDR 58.333 to IDR 140.909 per month varies based on the income level.
Keywords: clean water, willingness to pay, public sharing, CVM
INTRODUCTION
Background
The main pillar in the strategy of development in a region is by ensuring the fulfillment of clean water needs in the region (Vasquez W 2013). Based on this, various parties should allocate adequate investment in water infrastructure. More often, the provision of clean water infrastructure done by the government is based on political aspects and less considers the public participation, both in terms of material and non-materials. It results in the discontinued water service that has been provided; hence there are plenty of investments that are not functioning optimally. The success in clean water service can be met by estimating the value of clean water services, so it can be adapted to the existing policies, economic incentives, and institutional management (Birol E 2006; Vasquez W 2013).
Bekasi Regency is one of areas with highly rapid development prospects. It is due to the location of Bekasi Regency which is relatively close to Jakarta and Bekasi City, in which the cities have extremely high density and are difficult to develop horizontally. This development has a consequence on the increasing population, which in turn leads in increasing clean water needs of the community (Cheng Qi 2011; Pingali 2007). The local government as the authority in the development of clean water infrastructure and facilities in its jurisdiction requires the support of many parties, including the public. One of the roles/ involvement of the society is on the economic aspect, where people contribute to the efforts made by the government to meet the
of public‘s clean water needs.
Willingness to Pay (WTP) is a description of public purchasing power based on consumers' perceptions (Dinauli 2006). The WTP value implies indicators of utility obtained from goods or services. The high utility of a product would encourage someone to be willing to contribute to the sustainability/ benefits of these goods and services (Delaney L 2004). The amount of WTP value can be used to predict the amount of public participation, and can also be used to estimate the clean water service tariff from the consumers (Yudariansyah H 2006), as well as to determine the condition of the existing water service based on the perception of the public /users (Irawan 2009).
by local government and Regional Water Company to formulate strategic and tactical policies in addressing the clean water needs in a sustainable manner in Bekasi Regency.
Objectives
The objectives of this research are:
1) To analyze public perception on clean water service that they currently receive.
2) To analyze the value of public sharing based on the willingness of the community to pay in efforts of improving water service
3) Identifying the factors affecting the selection of clean water main source
THEORETICAL BASIS
The community participation in the provision of clean water is influenced by many factors, including socio-cultural condition and the public economic abilities. The high level socioeconomic condition in the community will lead to increased participation in water supply activities, especially activities in meeting the needs in their neighborhood. According to (Wirdanaf 2006), the forms of community participation in the development process that is commonly found are:
1) Participation in decision making: the role undertaken on the stage of an activity being planned, all provisions which are later used are prepared and determined in the implementation of development activities.
2) The participation in plans implementation activities, namely the roles of the public when the plans are being carried out.
3) The participation in enjoying the outcome; it is the community who should enjoy the outcome of an activity.
4) The participation in the evaluation, namely the role of the community to provide feedback after the implementation of the development is completed.
In generating public participation, a real program is required that can be utilized by the community directly. Various efforts for the fulfillment of public facilities requiring public involvement in maintaining the sustainability of the program need the fulfillment of the three basic principles of community-based services, namely (McIntosh 2003):
1) Affordability, i.e. fee for utilizing service facilities should result in access to the services provided. 2) Capable of self-financing, thus the services can be sustained.
3) Capable to be applied in other places; it does not only apply in particular locations only.
One of community participation in water supply is realized in the form of public sharing economically which is used to maintain the sustainability of clean water supply system. The public will use their income to obtain maximum satisfaction from water services which will be enjoyed and reflected on the price scale by the willingness to pay on clean water supply services. McIntosh (2003) states that someone willingness to pay in the household scale (domestic) depends on the household income, the amount of water consumption, the amount of tariffs and their alternative water sources.
Someone willingness to pay certainly will not grow by itself, instead comes from certain factors. Jacobsen et al. (2013) argue that the concept of willingness to pay (WTP) highly depends on economic abilities, preferences and awareness of individuals related to the benefits for the use of a product. Preferences can emerge due to excellent service, whilst the awareness will emerge due to awareness efforts undertaken by the government by performing a variety of dissemination on the importance of environmental security and participation of all segments in the society within. Yudarniansyah H et al. (2006) proposes that the value of public willingness to pay for clean water services implemented by Malang Regional Water Company is IDR 750/ m3, lower than the ability to pay the community of IDR 1768/ m3 and also lower than water tariff
prevailing at that time, i.e. IDR 1300/ m3. In research done in different location, namely in Surakarta Regional Water Company, conducted by Irawan (2009), it is showed that WTP value is still between IDR 489/ m3 up to IDR 1065/ m3depending on customers‘ classification. From two similar studies, it appears that
Company as the provider of clean water, but there must be synergy efforts of all stakeholders involved in the provision of clean water.
METHODOLOGY
Sampling
The sampling was done based on purposive method. The number of samples in this research was 250 families, composed of the community using the non-pipeline and pipeline services. Sample points were determined based on the development areas of Bekasi Regency set forth in the RTRW. The development areas in question were divided into four groups; each development area was represented by the development centers and areas with poor clean water service. The number of samples from each sample location was taken proportionally.
The information taken through a questionnaire in this stage included:
1) General data of the respondents, including name, age, education, occupation, gender and address. 2) The socioeconomic data of respondents, including the number of people living at the same house,
family income, costs incurred for electricity and water consumption per month and the allocation of household expenditures in a month.
3) The data related to the fulfillment of clean water needs, including clean water sources, the condition of the water source, the distance to the water source, the distance between the water source and septic tank, the types of activities using clean water, the amount of water used, methods to obtain clean water, costs incurred for clean water fulfillment, the amount of funds that incurred for the needs of sustainable clean water.
The Analysis of Public Willingness to Pay
The Wilingness to Pay (WTP) is the willingness of users to incur reward upon services obtained or the amount of average rupiahs incurred by the public as payment of clean water supply service unit that they enjoy. WTP is an individual economic assessment on a service being received (Irawan 2009). WTP is highly influenced by the quality of care received, public economic ability, and socio-cultural condition of the society (Wicaksono 2006).
The determination of the clean water fulfillment‘s economic value in Bekasi Regency is done through sampling. Willingness to Pay value or WTP is directly obtained directly from respondents (direct approach) on the performance clean water needs fulfillment in Bekasi Regency. The method commonly used to determine the WTP value based on the survey results is Contingent Valuation Method (CVM).
In this context, the bid value is set based on fund allocation used to meet the clean water needs, as determined by UNICEF (4% of the average income). The form of the services offered is a piped water supply system which can be utilized directly in their houses by fulfilling qualify, quantity and continuity.
Steps taken in this method include:
1) First Step: Making Market Hypothesis
This stage is a preliminary stage that is aimed to obtain a preliminary description on water services in Bekasi Regency. Questionnaires containing information on clean water supply in Bekasi Regency meets the requirements for clean water provision and the means on how the government obtains funds to meet public access to quality clean water needs.
2) The Second Step: Getting the Bids Value
The auction value got through direct surveys using questionnaires spread to the respondents. Via the questions in the questionnaires, the information of maximum value in willingness to pay of the respondents. The value of public willingness to pay in a certain range set earlier. This value is shown to the respondents via the card or using the structured questions thus the respondents can choose the answers provided.
3) The Third Step: Calculating the Average WTP
4) The Fourth Step: Aggregating the Bids Curve
The bids curve is obtained by regressing WTP as the dependent variable with several independent variables.
5) The Fifth Step: Aggregating the Data
At this stage, the bids mean obtained is being aggregated in step three. This process involves the conversion of sample mean data to population mean as a whole. One way to convert the sample is by multiplying the sample mean with the number of households in the population (N).
RESULTS AND DISCUSSIONS
Respondents
The total respondents used in this research are 250 families. They are spread in 12 districts out of 23 districts in Bekasi Regency. The sampling site is determined based on the development area (WP) set forth in the RTRW of Bekasi Regency; each WP is taken three districts representing the central development area, clean water areas of which clean water service is poor and the areas with good clean water service. The total respondents from each sampling location are set proportionally. The determination of the location has been confirmed to Bekasi Regional Water Company to minimize error in determining the sample location. The respondents are consisted of 61.2% males and 38.8% females at the age distribution between (25- > 55) years, with the dominant age (25-34) years. The dominant age profile of the respondents is in line with the dominant age profile of the Regional Socio-Economic Survey (Suseda) of Bekasi Regency, 2014. From these survey results, the he society's dominant age is (25-34) years old (Regency BPS, 2014). In terms of education, the respondents are relatively varied, from elementary school to university graduates; with dominant education level is High School of 54%. This condition is in line with the results of Bekasi
Regency‘s Suseda 2014, stating that the dominant education level is high school graduates (BPS 2014). The type of respondents‘ work is quite varied with the dominant type being the private sector employees at 59.6% .They work mostly in the industry, spread in the area of Bekasi Regency. The result is in line with the
dominant profile of workers‘ livelihood as industrial sector workers conveyed in the result of Suseda 2014
(Regency BPS of 2014). Based on the description of the respondents in general, the respondents‘ profile is
similar with the community profile in Bekasi Regency surveyed by BPS in 2014.
From the economic side, the dominant income of the respondents ranges from IDR 1,000,000 – IDR
3,000,000 at 35.6%. The dominant amount of respondents‘ monthly spending is between IDR 1,000,000 - IDR 2,000,000, and IDR 2,100,000 - IDR 3,000,000 at 33%. The dominant total people within one household are around 4-5. The result of 2014 Suseda shows that the average spending per capita population is IDR 646,843 or equivalent to IDR 2,587,374 per family. The description of expenditure per family amongst the sampling is relatively the same with 2014 Suseda result. Based on the description of respondents‘ economic condition, it shows that the community income and expenditure is relatively balanced, thus the potential for income monthly saving is relatively low. The economic condition of the respondents is in line with the dominant education level and the type of work. The description of socioeconomic respondents can be seen in Table 1.
Table 1. The Socioeconomics Condition of the Respondents
No Socio-economic Condition Category Total (%)
1 Education Did not finish elementary school 2.4
Elementary School 4.0
3 Occupation Doctor/Teacher/Consultant/Service Sector 4.0
Farmer 2.4
Housewives 11.2
No Socio-economic Condition Category Total (%)
The public water needs are fulfilled through a pipeline system and non-pipeline system. Pipeline system is served by Regional Water Company and private water company, whilst the non-pipeline is served independently for each family or community. Based on sampling results, the dominant source of water used by the respondent is pumped wells of 36% and 22% for water gallons, while the Regional Water Company at 28% and the rest uses surface water, public hydrants and bulk water.
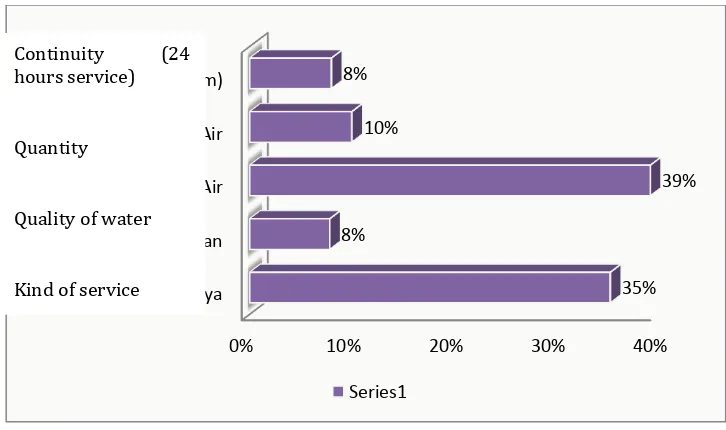
Each water service must meet the requirements of quality, quantity, continuity (Alayla 1998) and affordability (Regulation of Minister of Home Affairs No 23 of 2006). The quality aspect can affect the safety of water users from the health side. The quantity aspect and water continuity can affect sanitation and health, whilst the affordability will affect welfare of the water users.
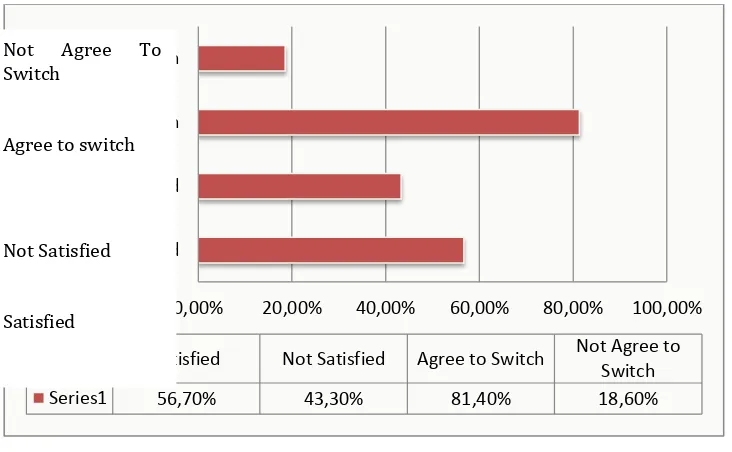
The sampling results show that in terms of quality, 61.9% of respondents using the pipeline water users are satisfied, and the rest are unsatisfied with the quality of water that they use. Meanwhile for the respondents using non-pipeline water, 62.7% of them are satisfied and the rest are unsatisfied with the quality of the water resources that they use. The level of satisfaction on water quality between the pipeline system and non-pipeline system is relatively almost equal, but the satisfaction level on non-non-pipeline water sources is higher. It becomes an input as an initial indication on the water quality supplied through the pipeline system. In general, the quality of the pipeline system should be more secure than non-pipeline system, as it has gone through the treatment process. The test result on water quality samples at several locations show that most samples do not meet the drinking water standards set by Regulation of Minister of Health 416 of 1999. All samples of well water using pumps and dipper does not meet the standard, especially for minerals and metals parameter (such as iron, magnesium, hardness, chloride), Total Dissolved Solids (TDS) and bacteorology, except for ground water source using jetpump. As for the resources managed by the community, there are also some parameters that do not meet quality standard, such as organic matter and bacteria. This would potentially disrupt and endanger users, especially in the long run, both in terms of health aesthetics. For samples of pipeline water, some sources are derived from the Regional Water Company management still have incompatible parameters with such standards, including clor, bacteria, and pH. This parameter needs to get attention from the Regional Water Company as it is thought to emerge due to leaks in the distribution network, causing water cross connection. Meanwhile the quality of pipeline water is managed by private Regional Water Company has met the standards. The incompatibility of water quality consumed by the public is relatively difficult or does not visible by naked/ physical eye, thus people commonly do not feel that the water source is not in trouble or is not fit for consumption, or in some areas, the community basically know that the water resource quality is not feasible, but they do not have other alternatives, hence they still use it, but only for limited use or not for cooking and drinking. The water needs for cooking and drinking for the community are met by utilizing recycled water gallons.
there are more clean water alternative source. In water pipeline system, there are many factors affecting water adequacy on customers, including leakage of distribution network, processing condition, or disorders of the source. If there is disturbance on one of these factors, it will affect the water quantity received by the society. Thereby, the performance of treatment plants, distribution networks and source become one of determinant in
the fulfillment of customers‘ clean water source. The illustration of respondents‘ satisfaction level proportion
on the quantity of clean water can be seen in Figure 1.
Figure 1. The Proportion of Satisfaction Level on Clean Water Quantity
Based on the continuity, in the context that the existing water source can be utilized for 24 hours, the result obtained is that 75.6% of respondents have water source that can be used 24 hours, and there are still 24.4% of the respondents whose water source cannot be utilized within 24 hours. In proportion, the respondents who have not been able to take advantage of clean water source for 24 hours are higher than the respondents groups who use pipeline water resources, compared than those utilizing non-pipeline system. Based on 2014 performance evaluation result on Regional Water Company, average service time from Regional Water Company reaches 20:31 hours per day. This evaluation result also shows that the regional water company has not been able to meet the water needs of the society according to the requirements of service continuity. The community that cannot utilize the water in 24 hours are doing individual water reservoirs to meet the clean water needs for 24 hours.
The affordability of water service is related to public ability in terms of economic sector in meeting water needs. The Regulation No. 23 of 2006 requires that costs allocated public to meet monthly water needs should be no more than 4% of family income. If the spending on clean water is more than 4% of the income,
it will affect the welfare level of the community. The sampling results indicate that the average respondents‘
expenditure based on income is shown in Table 2.
Table 2. The Proportion of Water Cost Expenditure on Income
No Income Average Expenditure for Water(IDR) The proportion of expenditure on income (%)
1 < IDR 1 million 50.000 5.00
2 IDR 1 million – IDR 3 million
87.000 4.35
3 IDR 3.1 million – IDR 5
million 120.000 3.00
4 > IDR 5 million 140.000 2.80
Source: Sampling, 2015
Based on Table 2, it appears that the expenditure burden to meet the clean water needs for very low-income people (< IDR 1 million) is the highest amongst the other groups that are classified based on income. It shows that the public with income < IDR 3 million are vulnerable to non-prosper condition due to spending to meet the clean water needs. Judging such condition, the government role in ensuring the fulfillment of water needs and building prosperous society, thus it is necessary to be focused on a program that is intended for families with income < IDR 3,000,000/ month. Besides, for Regional Water Company managing the water supply pipeline system, the water pricing with full-cost recovery criteria should be set for customers