JEJAK
Journal of Economics and Policy
http://journal.unnes.ac.id/nju/index.php/jejak
Export Performance and Competitiveness
of Indonesian Food Commodities
Firmansyah1, Wahyu Widodo2, Karsinah3, Shanty Oktavilia4
1,2Economics and Business Faculty, Diponegoro University, Semarang, Indonesia 3,4Economics Faculty, Universitas Negeri Semarang, Indonesia
Permalink/DOI: http://dx.doi.org/10.15294/jejak.v10i2.11294
Received: February 2017; Accepted: May 2017; Published: September 2017
Abstract
The developments of the world trade requires the improvement of the competitiveness of products, including agricultural
commodities. At the regional level, Indonesia’s agricultural commodities face the ASEAN free market competition. This study aims to identify and examine the competitiveness of Indonesian exports of several agricultural commodities in the international market by employing the index of competitiveness of trade specialization by trade specialization index (TSI), and the index of market penetration, by revealed comparative advantage (RCA). This study observed the HS 4 digit agricultural commodities, along 2011-2015. The study finds that the index of commodity trade specialization of estate crops sub-sector is in a stage of maturation of the world trade, or it has a very strong competitiveness. The food crops sub-sector stand on the introduction stage of the world trade or it has low competitiveness, or in other words, Indonesia is a net importer of the sector commodities. Although some of commodities have the strong competitiveness, but on the other hand, they do not have a strong comparative advantage. This is shown by the RCA value that less than 1. It means that a part of agricultural commodities, namely food crops, horticulture and estate, are still import oriented.
Key words :export competitiveness, trade specialization index (TSI), revealed comparative advantage (RCA), agricultural commodity,
food crops.
How to Cite: Firmansyah, F., Widodo, W., Karsinah, K., & Oktavilia, S. (2017). Export Performance and Competitiveness of Indonesian Food Commodities. JEJAK: Jurnal Ekonomi Dan Kebijakan, 10(2), 289-301. doi:http://dx.doi.org/10.15294/jejak.v10i2.11294
© 2017 Semarang State University. All rights reserved Corresponding author :
Address: Jl. H. Prof. Soedarto, SH. – Tembalang-Semarang 50275 , Jawa Tengah
Email : [email protected]
INTRODUCTION
The implementation of the ASEAN Economy Community (AEC) since 1 January 2016 has been bringing the logical consequence of the liberalization of regional trade by the reduction of tariffs, the harmonization of regulation, and the facilitation of trade in goods and services. Trade competition occurred in all sectors, including agriculture. In the domestic economy, the agricultural sector is proved to be able to recover the economy in times of crisis. In addition to contributing to the national economy, this sector also roles in the creation of employment, income increasing, ensuring the needs of local food, raw materials production, and a source of foreign exchange. Comprehensively, the agricultural sector plays a role in maintaining food security, economic stability and political security.
The role of the agricultural sector in the economy is indicated by its significant contribution to the Gross Domestic Product (GDP) of Indonesia in 2015 (13.49 percent), increase from 2014 which amounted by 13.34 percent (BPS, 2017). The contribution of the sector to the national economy is the second largest after the manufacturing. In 2015, the average of labor absorption by agricultural sector is 34 per cent per year of the total workforce of Indonesia (World Development Indicators, World Bank).
Efforts to improve the agricultural sector, one of which is to encourage the production of agricultural commodities which have eminent competitiveness in the international market. Government attention on the development of agricultural sector is an important issue of government policies as stated in the Ministry of Agriculture Strategic Plan 2015-2019. The agricultural policies among others are the reduction of import
dependence, the increase of the competitiveness of products in domestic trade, the anticipation of the free market MEA as well as consolidation and increasing competitiveness of agricultural products in the international market. This study aims to identify and analyze the competitiveness of Indonesian agricultural commodities, especially food, including sub-sectors of food crops, horticulture and estate crops.
Measuring the competitiveness of agricultural commodities is important to identify the position of agricultural commodities in the international market. Competitiveness is defined by Esterhuizen.al. (2008) as an ability of an industry or company to compete successfully to achieve sustainable growth in the global environment when it derives at least the opportunity cost of the resources employed. In this study, the measurement of competitiveness refers to the size which is used by Balassa (1965) that referred by some studies such as Vollrath (1991), Batra and Khan (2005), Oktavilia (2013), Laursen (2015). This study empirically finds a
measurement of the comparative and
competitive advantages of Indonesian agricultural commodities which are compared to its world export values.
The international trade becomes one of the main factors to boost the economic growth. The impact of international trade on the economy, social, and political is perceived especially in the last century, although it has been held since long before. It occurs after the capablity of the international trade now in supporting industrialization, transportation, globalization, and the growing number of multinational companies.
production. The differences between countries in the ownership of resources provide opportunities of trade between countries and each country contributes to they gains from trade (Krugman, Obstfeld, & Melitz, 2012).
The concept of trade as description above, is the comparatif advantage of a country. A country will export a commodity to another country if it has a comparative advantage in producing the commodity relatively. The comparative advantage is not only derived from natural factors only, but it can also be created. In addition, the dynamics of the abundance and the management of resources, lead the the comparative advantage is behave static and dynamic (Anggarwal & Agmon, 1990).
Beside the comparative advantage, the concept of competitiveness or competitive advantage is more often used in measuring the advantages and profit sustainability of a firm against its competitors. The firm can be said to have a competitiveness against its competitors if the profit sustainability of the firm larger than the competitors. The benefits of international trade that can be perceived by some countries, among others, are as follows (Krugman et al., 2012). (1) To attaint the goods and services that can not be produced in their own country. There are many factors that influence the differences in production in each country, which include: geography, climate, level of science and technology and so forth, (2) To gain from specialization. The major cause of foreign trade activities is to obtain profits by specialization. Although a country can produce same type of goods which those manufactured by other countries, but sometime it's better if the country imports the goods from abroad, (3) To expand the market and increase profits.
With the international trade, the entrepreneur can run the machines to the maximum, and sell the surplus products abroad, (4) To get the transfer of modern technology. Foreign trade allows a country to learn the more efficient production techniques and the more modern management
There are several factors that drive a country to do international trade, among others are to meet the needs of goods and services in the country, to derive the profit and to increase the state revenues and to increase the ability of the mastery of science and technology to process the resources (Salvatore, 1996).
The level of country's competitiveness in the international trade, is basically determined by two factors, namely comparative advantage and competitive advantage. Furthermore, the comparative advantage can be considered as a natural factor and the competitive advantage is considered as acquired factors.
In addition to these two factors, the level of competitiveness of a country is actually also influenced by the so-called Sustainable Competitive Advantage (SCA). It mainly within the framework of the global competition level which is becoming hard or Hyper Competitive (D'Aveni, 1994).
The D'Aveni’s Hyper Competitive analysis
Advantage may applicable to the development of agriculture commodities.
The earliest concept of comparative advantage which was presented by Ricardo (1817), is the oldest international trade theory. The historical of comparative advantage starting from the ideas of Adam Smith about the market size in production that led to the specialization of trade. The idea was then developed by David Ricardo who brought the concept of comparative advantage in international trade. The concept of comparative advantage and then further developed by JS Mill through the concept of infant industries and politics of protection
through the mechanism of income
distribution (Masters, 1995).
The concept of comparative advantage largely comes from specialization which based on the proportion of labor costs. This
Comparative advantage explains how trade can benefit the countries through the use of resources (land, labor, capital input) which are more efficient at the time of warld market production are limited. Each country should produce and export products that have
a comparative advantage, namely
commodities have certain qualities but produced with a ratio of lower input costs compared to production in other countries (Leishman, Menkhaus, and Whipple, 1999).
The development of the concept of international competitiveness is still attractive and become a concern for academics and policy makers. International
competitiveness, in the context of trade in goods and services, referring to how a country to secure his position in maintain the gains in world trade (Krugman, 1994). Some researchers define competitive advantage in the same way as a comparative advantage, and several others watched as a broad economic characteristics (Siggel, 2007). Comparative advantage is a theoretical concept that involves comparisons between countries and products. Measurement of comparative advantage would ideally allow us to predict the flow of trade and to evaluate the extent to which the allocation of resources between industrial optimal or not. However, the comparative advantage is the concept of micro-economics, with a focus on industry-specific trade, explains why one country may export labor-intensive products while other countries may specialize in capital-intensive (Leishman et al., 1999).
While the view of competitive advantage has a little meaning from a macro economic perspective. The concept of competitive advantage introduced by Porter (1990), as a matter of industry competitiveness is always associated with competitive strategy oriented to the low price and product differentiation. Industrial competitiveness is the ability of an industry to gain a competitive edge by relying on factor conditions; demand conditions; corporate strategy and structure of the competition; as well as supporting industries and related industries (Porter, Ketels, and Delgado, 2008).
Competitive advantage is the concept of balance, how to predict trading patterns when prices, trade flows and the exchange rate is in equilibrium. Development of products that have competitive advantages regard the current
economic conditions, exchange rate
RESEARCH METHODS
This study employs secondary data of
export of Indonesia’s agricultural
commodities with the 4 digits Harmonized Commodity Description and Coding-Systems (HS-4). Analyses are performed by description of the performance of agricultural export commodities along 2011-2015. Analysis of export performance and competitiveness of
Indonesia’s agricultural commodities in the
international market is applied by two methods of measurement of the performance of export competitiveness, by Trade Specialization Index (TSI) and the index of market penetration by the Revealed Comparative Advantage (RCA). Strategy to increase the exports of agricultural commodities is carried out by the literature research and the documents related to the government planning of agricultural exports.
Trade Specialization Index (TSI)
The Trade Specialization Index (ISP) is a tool for analyzing the position and or stage of development of the commodity. The ISP is used to illustrate whether a domestic agricultural commodities tend to be exports or imports commodities. The ISP analysis also provides an overview regarding the position of Indonesia, whether it tend to be the exporting or importing country of agricultural commodities. In general, ISP is formulated as follows:
Interpretation of the TSI value as follows: 1 s/d -0,5 : The commodity is in the introduction 0,1 s/d 0,7 : The commodity in export expansion stage of the world trade or it has high competitiveness
0,8 s/d 1,0 : The commodity in maturation stage of the world trade or it has a very high
competitiveness
Revealed comparative advantage (RCA)
The RCA index was first introduced by Liesner (1958) and operationalized by Balassa (1965), which is used to measure the comparative advantage. The comparative advantages of a
country is empirically measured by
mathematical calculation of the data of the national export value, which is compared to the value of world exports. The calculation of so-called Balassa Revealed Comparative Advantage, which is known as the Balassa RCA index, world exports. The index neutralizes the effects of the economic size of a commodity or industry of a country, so that possible to make comparisons between countries on different commodities and or different industries.
If the RCA index value of a country/region for a particular commodity is greater than one (1), it means that the country has a comparative
advantage (above the world average) in the commodity. Conversely, if the RCA index value is less than one, it means that its comparative advantage for the commodity is lower (below the world average).
A more detailed analysis, to demonstrate the power of comparative advantage, the Balassa RCA indices can be classified into four: Classification 1, if 0
<RCA≤1 then there is no comparative advantage; Classification 2, if 1 <RCA≤2 then
there is a weak comparative advantage;
Classification 3, if 2 <RCA≤4 then there is a
moderate comparative advantage; and Classification 4, if 4 <RCA then there is a strong comparative advantage (Hinloopen, 2001).
RESULTS AND DISCUSSION
The export performance of agricultural commodities show an increase of the share of Indonesian non-oil exports value along 2012-2015. Although there is a declining growth in the last period, the role of agricultural commodities increases in the form of the non-oil exports. It indicates that in free trade with
the increase in competition, Indonesia’s
agricultural commodities can be accepted in the world market.
Source: Ministry of Trade Republic of Indonesia (2016)
Figure 1. The Export Growth of Agricultural Commodity and the Export Proportion of
Agricultural Commodities to Indonesia’s
Non-oil Exports (Percent).
In 2015, the contribution of agricultural export commodities reached 4.27 percent of total
Indonesia’s non-oil exports, it increases from
2014 (Figure 1).
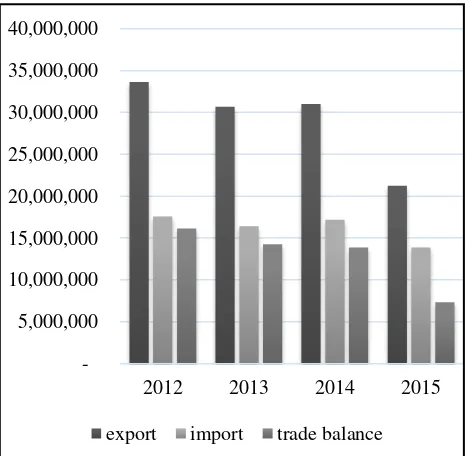
The export performance of agricultural commodities is also indicated by the position of the surplus of the trade balance in 2012-2015. The surplus of trade balance shows that the value of agricultural commodities exported are greater than the imports in the same period (Figure 2). Despite the decline in value, the trade surplus of agricultural commodities in 2014 which is amounted to 13884.19 Million US $, and up to the third quarter of 2015, the trade surplus reaches US $ 7388.15 million.
Source: Ministry of TradeRepublic of Indonesia (2016)
Figure 2. Value of Exports, Imports and Trade
Balance of Indonesia’s Agricultural Commodities
(000 US $)
In aggregate, the index of Indonesia’s
agricultural commodities trade specialization is in the level of 0.1 up to 0.7. It means that the
Indonesia’s agricultural commodities as a whole
are in a stage of exports expansion of the world trade or it can be said it has a high competitiveness (Figure 3).
5,000,000 10,000,000 15,000,000 20,000,000 25,000,000 30,000,000 35,000,000 40,000,000
2012 2013 2014 2015
Source: Ministry of TradeRepublic of Indonesia (2016)
Figure 3. Trade Specialization Index of
the Indonesia’s Agricultural Commodities
2012-2015
However, the good performance of
Indonesia’s agricultural commodities
exported, do not occur evenly in all sub-sectors. The overall proportion of exports of agricultural commodities is contributed by the estate crops sub-sector (94.27 percent) and the livestock sector (3.08 percent). When
it is observed from the trade performance of the food crops sub-sector, it has a high dependence on imports, which is indicated by the proportion of exports is only 1.15 percent, while the proportion of imports reached 45.83 percent (Figure 4).
Source: Ministry of TradeRepublic of Indonesia (2016)
Figure 4. Export and Import Proportion of Agricultural Commodities (Percent)
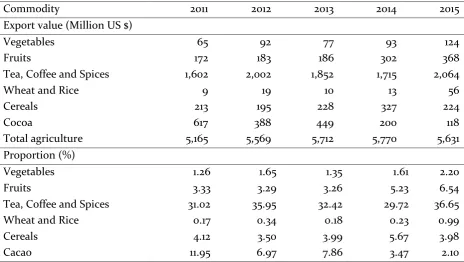
Table 1.The Exports Value and Proportion of Indonesia’s Agricultural Commodities 2011-2015
Commodity 2011 2012 2013 2014 2015
Export value (Million US $)
Vegetables 65 92 77 93 124
Fruits 172 183 186 302 368
Tea, Coffee and Spices 1,602 2,002 1,852 1,715 2,064
Wheat and Rice 9 19 10 13 56
Cereals 213 195 228 327 224
Cocoa 617 388 449 200 118
Total agriculture 5,165 5,569 5,712 5,770 5,631
Proportion (%)
Vegetables 1.26 1.65 1.35 1.61 2.20
Fruits 3.33 3.29 3.26 5.23 6.54
Tea, Coffee and Spices 31.02 35.95 32.42 29.72 36.65
Wheat and Rice 0.17 0.34 0.18 0.23 0.99
Cereals 4.12 3.50 3.99 5.67 3.98
Cacao 11.95 6.97 7.86 3.47 2.10
Source : Data Process
0.314 0.303 0.288
0.209
0.050
0.100 0.150 0.200 0.250 0.300 0.350
2012 2013 2014 2015
food crops
hortic ulture
livesto ck
estate crops export 1.15 1.5 3.08 94.27 import 45.83 9.63 19.27 25.27
P
er
ce
n
This study analyzes the performance of export of agricultural commodities, namely the food crops, horticulture, and estate crops sub sectors. Estimated data shows that the Food agricultural commodities, which is the estate crops sub-sector is the most contributor to agricultural exports. On the food commodities, such as tea, coffee and spices is a contributor to the export of agricultural commodities, which contribution reached 36.65 percent. In the group of horticulture, the fruits commodity contributes 6.54 percent of the total agricultural exports in 2015 (Table 1)
The small proportion of exports occurs in the food crops sub-sector. The wheat and rice contribute 0.99 percent only of the total export of agricultural commodities. The results of the performance analysis of
agricultural competitiveness with HS-2 digits code indicate that the TSI value of the Cocoa and Cocoa Preparations (18) and Coffee, Tea and Spices (09) commodities is in the range of 0.1 to 0.7, which these commodities are in the stage of exports expansion of world trade or it have a high competitiveness. The Fruit and Nuts (08) have a range value between -0.4 to 0, which it means that the Fruit and Nuts (08) are at the stage of import substitution of the world trade. While commodity with HS-10 code (Cereals), 12 (Seeds and Grains), and 07 (Edible Vegetables) state at the stage of introduction in world trade or competitiveness still low. This is indicated by the value of TSI, which are in the range of 1 to -0.5. At this level, Indonesia is still experiencing dependency on imports of the three commodities (Table 2).
Table 2. The Export Performance Competitiveness of Trade Specialization Index HS-2 of Agricultural Commodity
HS Commodity Trade Specialization Index
2011 2012 2013 2014 2015
10 Cereals -0.9 -0.9 -0.9 -0.9 -0.9
12 Seeds And Grains -0.7 -0.7 -0.7 -0.6 -0.6
18 Cocoa And Cocoa Preparations 0.76 0.71 0.69 0.45 0.63
07 Edible Vegetables -0.7 -0.6 -0.7 -0.7 -0.6
08 Fruit And Nuts -0.3 -0.3 -0.2 0 0.07
09 Coffee, Tea And Spices 0.55 0.72 0.87 0.82 0.88
Source: Ministry of TradeRepublic of Indonesia (2016)
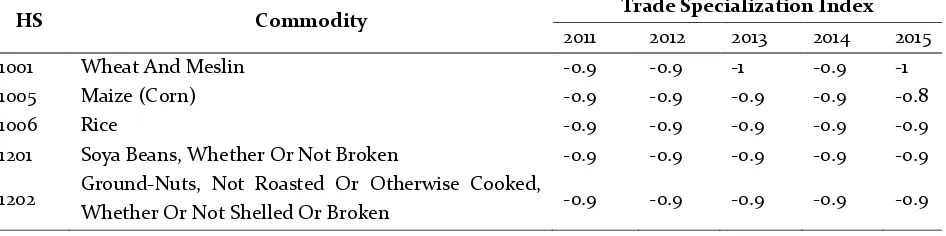
Table 3. Export Performance Competitiveness of Agricultural Commodity by Trade Specialization Index of HS-4 Food Crops Sub sector
HS Commodity Trade Specialization Index
2011 2012 2013 2014 2015
1001 Wheat And Meslin -0.9 -0.9 -1 -0.9 -1
1005 Maize (Corn) -0.9 -0.9 -0.9 -0.9 -0.8
1006 Rice -0.9 -0.9 -0.9 -0.9 -0.9
1201 Soya Beans, Whether Or Not Broken -0.9 -0.9 -0.9 -0.9 -0.9
1202 Ground-Nuts, Not Roasted Or Otherwise Cooked,
Whether Or Not Shelled Or Broken -0.9 -0.9 -0.9 -0.9 -0.9
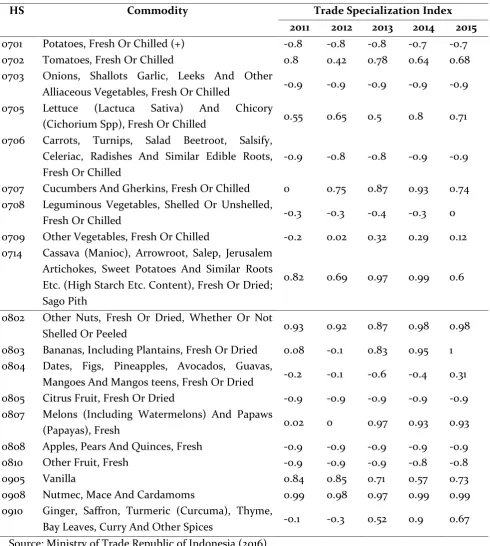
Table 4. Performance of Export Competitiveness of Trade Specialization Index of HS-4 Horticulture Commodity Sub-Sector
HS Commodity Trade Specialization Index
2011 2012 2013 2014 2015
0701 Potatoes, Fresh Or Chilled (+) -0.8 -0.8 -0.8 -0.7 -0.7
0702 Tomatoes, Fresh Or Chilled 0.8 0.42 0.78 0.64 0.68
0703 Onions, Shallots Garlic, Leeks And Other
Alliaceous Vegetables, Fresh Or Chilled -0.9 -0.9 -0.9 -0.9 -0.9
0705 Lettuce (Lactuca Sativa) And Chicory
(Cichorium Spp), Fresh Or Chilled 0.55 0.65 0.5 0.8 0.71
0706 Carrots, Turnips, Salad Beetroot, Salsify, Celeriac, Radishes And Similar Edible Roots, Fresh Or Chilled
-0.9 -0.8 -0.8 -0.9 -0.9
0707 Cucumbers And Gherkins, Fresh Or Chilled 0 0.75 0.87 0.93 0.74
0708 Leguminous Vegetables, Shelled Or Unshelled,
Fresh Or Chilled -0.3 -0.3 -0.4 -0.3 0
0709 Other Vegetables, Fresh Or Chilled -0.2 0.02 0.32 0.29 0.12
0714 Cassava (Manioc), Arrowroot, Salep, Jerusalem Artichokes, Sweet Potatoes And Similar Roots Etc. (High Starch Etc. Content), Fresh Or Dried; Sago Pith
0.82 0.69 0.97 0.99 0.6
0802 Other Nuts, Fresh Or Dried, Whether Or Not
Shelled Or Peeled 0.93 0.92 0.87 0.98 0.98
0803 Bananas, Including Plantains, Fresh Or Dried 0.08 -0.1 0.83 0.95 1 0804 Dates, Figs, Pineapples, Avocados, Guavas,
Mangoes And Mangos teens, Fresh Or Dried -0.2 -0.1 -0.6 -0.4 0.31
0805 Citrus Fruit, Fresh Or Dried -0.9 -0.9 -0.9 -0.9 -0.9
0807 Melons (Including Watermelons) And Papaws
(Papayas), Fresh 0.02 0 0.97 0.93 0.93
0808 Apples, Pears And Quinces, Fresh -0.9 -0.9 -0.9 -0.9 -0.9
0810 Other Fruit, Fresh -0.9 -0.9 -0.9 -0.8 -0.8
0905 Vanilla 0.84 0.85 0.71 0.57 0.73
0908 Nutmec, Mace And Cardamoms 0.99 0.98 0.97 0.99 0.99
0910 Ginger, Saffron, Turmeric (Curcuma), Thyme,
Bay Leaves, Curry And Other Spices -0.1 -0.3 0.52 0.9 0.67
Source: Ministry of TradeRepublic of Indonesia (2016)
The export performance of agricultural food commodities analyzes in more detail to HS-4 exports commodity. In the sub-sector of food crops, it shows that all of the HS-4 commodities still experience the import
The analysis of the performance of the export competitiveness of HS-4 horticulture sub sector, shows that there are 12 commodities have strong competitiveness in the international market and 6 commodities are still in the introduction stage with the low competitiveness. On the 12 commodities that have strong competitiveness, there is a commodity with the TSI which in the range of 0.8 to 1, namely Other Nuts, Fresh or Dried, Whether or not Shelled or Peeled; Bananas, Including Plantains, Fresh Or Dried; Melons (including Watermelons) and Papayas, Fresh and Nutmec, Mace and Cardamoms. In all four commodities, it have been in the maturation stage of the world trade or have a very strong competitiveness (Table 4).
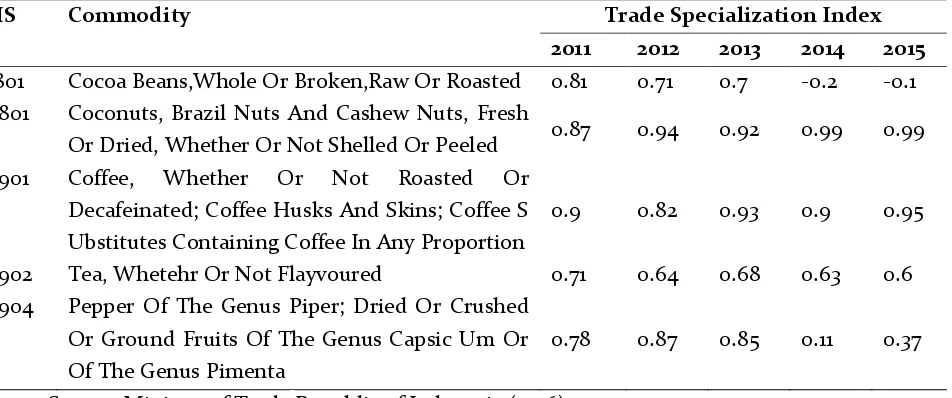
The export performance of estate crops
sub-sector is the most excellent
competitiveness compare to other two sub-sectors. The commodities of cocoa beans, whole or broken, raw or roasted decline in competitiveness in the past two years, reach the level of not competitive. However, these commodities have a strong competitiveness
in 2011-2013The decline is due to competition on the world market and the decrease of demand of Cocoa Beans, Whole or Broken, Raw or Roasted commodities in the world market. The coconuts commodities, brazil nuts and cashew nuts, fresh or dried from, whether or not shelled or peeled; and coffee, whether or not roasted or decaffeinated; coffee husks and skins; coffee substitutes containing coffee in any proportion have the TSI that almost close to 1, which means that the two commodities have a very well-established competitiveness in the international market (Table 5).
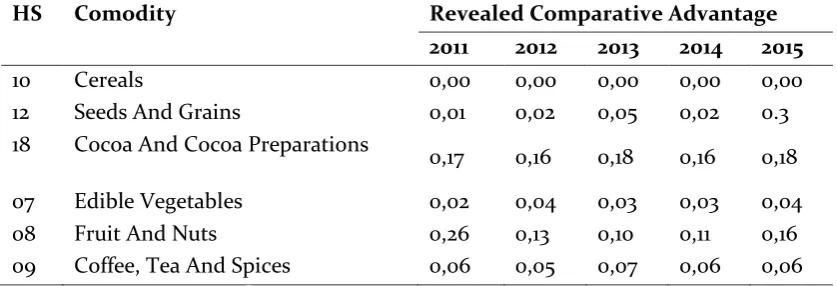
Analysis of market penetration by using the Revealed Comparative Advantage indicates the description the comparative advantages of
Indonesia’s agricultural export commodities in
the international market. The HS-2 commodities with show that Indonesia’s food agricultural commodities have the RCA values less than 1 in the period of observation. This suggests that the agricultural commodities which have a comparative advantage observed low or under the world average.
Table 5. Performance of the Export Competitiveness of Trade Specialization Index of HS-4 Estate Crop Sector
HS Commodity Trade Specialization Index
2011 2012 2013 2014 2015
1801 Cocoa Beans,Whole Or Broken,Raw Or Roasted 0.81 0.71 0.7 -0.2 -0.1
0801 Coconuts, Brazil Nuts And Cashew Nuts, Fresh
Or Dried, Whether Or Not Shelled Or Peeled 0.87 0.94 0.92 0.99 0.99
0901 Coffee, Whether Or Not Roasted Or
Decafeinated; Coffee Husks And Skins; Coffee S Ubstitutes Containing Coffee In Any Proportion
0.9 0.82 0.93 0.9 0.95
0902 Tea, Whetehr Or Not Flayvoured 0.71 0.64 0.68 0.63 0.6
0904 Pepper Of The Genus Piper; Dried Or Crushed Or Ground Fruits Of The Genus Capsic Um Or Of The Genus Pimenta
0.78 0.87 0.85 0.11 0.37
Table 6. Analysis of Comparative Advantage by Revealed Comparative Advantage for Indonesia HS-2 Agricultural Commodities
HS Comodity Revealed Comparative Advantage
2011 2012 2013 2014 2015
10 Cereals 0,00 0,00 0,00 0,00 0,00
12 Seeds And Grains 0,01 0,02 0,05 0,02 0.3
18 Cocoa And Cocoa Preparations
0,17 0,16 0,18 0,16 0,18
07 Edible Vegetables 0,02 0,04 0,03 0,03 0,04
08 Fruit And Nuts 0,26 0,13 0,10 0,11 0,16
09 Coffee, Tea And Spices 0,06 0,05 0,07 0,06 0,06
Source: Ministry of TradeRepublic of Indonesia (2016)
From the RCA estimation results, it are known that the HS-4 food crops, horticulture
and estate crops have a low comparative
commodity. No commodity which it’s RCA
value that greater than 1. It also indicates that the level of market penetration of Indonesian food commodity is still low (See Appendix)
CONCLUSION
Free trade is theoretically acceptable because there are profits earned by the countries involved in, based on the concepts of comparative advantage. Indonesia as an agrarian country that largely of the population livelihood as farmers, is faced with the increase of strong competition with other countries in the region and the world.
The analysis results show that even though the growth of agricultural sector trade balance is surplus, but apparently in some performance indicators of competitiveness of trade, some food commodities have low competitiveness. Some policies recommended include, first, the diversification of products that can increase value added and competitiveness of Indonesian agricultural commodities in the international market. Second, improvement the quality control and standardization problems, associated with agricultural commodities of Indonesia that more enter the international market easily.
REFERENCE
Anggarwal, R., and Agmon., T. (1990). The International Success of Developing Country Firms: Role of Government Directed Comparative Advantage. Management International Review, 30(2), 2–3. Balassa, B. (1965). Trade Liberalization and Revealed
Comparative Advantage. The Manchester School of Economic and Social Studies, 33(2 / May), 99– 123.
Batra, A. and Zeba K. (2005). Revealed Comparative Advantage: An Analysis for India and China. Working Paper No. 168. Indian Council for Research on International Economic Relations D’Aveni, R. . (1994). Hypercompetition: Managing the
dynamics of strategic maneuvering. New York: The Free Press.
Hinloopen, J. (2001). On the empirical distribution of the Balassa Index. Review of World Economics, 137(1), 1–49.
Krugman, P. (1994). Competitiveness: A Dangerous Obsession. Foreign Affairs, 73(2), 28–44.
Krugman, P. R., Obstfeld, M., and Melitz, M. J. (2012). International economics : theory and policy. Policy (Vol. New York,).
Laursen, K.(2015). Revealed comparative advantage and the alternatives as measures of international specialization. Eurasia Bus Rev 5, 99-115.
for Agriculture Commodities: An Empirical Analysis of Wool Exporters.
Ma, A. S. (2013). Revealed Comparative Advantage Measure: ASEAN-China Trade Flows. Journal of Economics and Sustainable Development, 4(7), 136–145.
Masters, W. A. (1995). Guidelines on National Comparative Advantage and Agriculture Trade. Agriculture Policy Analysis Project, Phase III,
Januari -(6). Retrieved from
http://sites.tufts.edu/willmasters/files/2010/06/M asters-Guidelines_APAP1995.pdf
Oktavilia, S. (2013). Perdagangan Bebas Regional dan Daya Saing Komoditas Pertanian Indonesia. Prosiding Seminar Nasional dan Call For Paper Forum Manajemen Indonesia (FMI) Ke-5 Pontianak 23-24 Oktober 2013 Volume 5 No. 1 Tahun 2013.
Porter, M. E. (1990). The competitive advantage of Nations. Harvard Business Review, 2(March / April).
Porter, M., Ketels, C., and Delgado, M. (2008). The microeconomic foundations of prosperity: findings from the business competitiveness index in WEF,. Geneva.
Ricardo, D. (1817). On The Principles of Political Economy and Taxation. London.
Salvatore, D. (1996). International Economics, Fifth Edition. PrenticeHall, Inc, A Simon and Schuster Company Englewood Clifs, New Jersey.
Vollrath,T. (1991). A Theoretical Evaluation of Alternative Trade Intensity Measure of Revealed Comparative Advantage. Review of World Economics, 127,265-280.
APPENDIX
Appendix 1. Analysis of Comparative Advantage by Revealed Comparative Advantage on Indonesia HS-4 Food Crops Sub-sector
HS Commodity Revealed Comparative Advantage
2011 2012 2013 2014 2015
1001 Wheat And Meslin 0,00 0,00 0,00 0,00 0,00
1005 Maize (Corn) 0,00 0,00 0,00 0,00 0,00
1006 Rice 0,00 0,00 0,00 0,00 0,00
1201 Soya Beans, Whether Or Not Broken 0,00 0,00 0,00 0,00 0,00
1202 Ground-Nuts, Not Roasted Or Otherwise
Cooked, Whether Or Not Shelled Or Broken 0,01 0,02 0,05 0,02 0,02
Appendix 2. Analysis of Comparative Advantage by Revealed Comparative Advantage on
Indonesia’s HS-4 Estate Crops Sub-Sector
HS Commodity Revealed Comparative Advantage
2011 2012 2013 2014 2015
1801 Cocoa Beans,Whole Or Broken,Raw Or Roasted 0,17 0,16 0,18 0,16 0,18
0801 Coconuts, Brazil Nuts And Cashew Nuts, Fresh
Or Dried, Whether Or Not Shelled Or Peeled 0,26 0,13 0,10 0,11 0,16
0901
Coffee, Whether Or Not Roasted Or Decafeinated; Coffee Husks And Skins; Coffee S Ubstitutes Containing Coffee In Any Proportion
0,06 0,05 0,07 0,06 0,06
0902 Tea, Whetehr Or Not Flayvoured 0,05 0,05 0,05 0,04 0,04
0904
Pepper Of The Genus Piper; Dried Or Crushed Or Ground Fruits Of The Genus Capsic Um Or Of The Genus Pimenta
Appendix 3. Analysis of Comparative Advantage by Revealed Comparative Advantage on
Indonesia’s HS-4 Horticulture Sub-Sector
HS Commodity Revealed Comparative Advantage
2011 2012 2013 2014 2015
0701 Potatoes, Fresh Or Chilled (+) 0,01 0,02 0,03 0,02 0,01
0702 Tomatoes, Fresh Or Chilled 0,00 0,00 0,00 0,00 0,00
0703 Onions, Shallots Garlic, Leeks And Other
Alliaceous Vegetables, Fresh Or Chilled 0,00 0,00 0,00 0,00 0,00
0705 Lettuce (Lactuca Sativa) And Chicory
(Cichorium Spp), Fresh Or Chilled 0,00 0,00 0,00 0,00 0,00
0706
Carrots, Turnips, Salad Beetroot, Salsify, Celeriac, Radishes And Similar Edible Roots, Fresh Or Chilled
0,00 0,00 0,00 0,00 0,00
0707 Cucumbers And Gherkins, Fresh Or Chilled 0,00 0,00 0,00 0,00 0,00
0708 Leguminous Vegetables, Shelled Or Unshelled,
Fresh Or Chilled 0,01 0,02 0,03 0,02 0,01
0709 Other Vegetables, Fresh Or Chilled 0,00 0,04 0,19 0,09 0,00
0714
Cassava (Manioc), Arrowroot, Salep, Jerusalem Artichokes, Sweet Potatoes And Sim Ilar Roots Etc. (High Starch Etc. Content), Fresh Or Dried; Sago Pith
0,02 0,04 0,03 0,03 0,04
0802 Other Nuts, Fresh Or Dried, Whether Or Not
Shelled Or Peeled 0,10 0,11 0,13 0,09 0,10
0803 Bananas, Including Plantains, Fresh Or Dried 0,00 0,00 0,00 0,00 0,00
0804 Dates, Figs, Pineapples, Avocados, Guavas,
Mangoes And Mangosteens, Fresh Or Dri Ed 0,01 0,01 0,01 0,01 0,01
0805 Citrus Fruit, Fresh Or Dried 0,00 0,00 0,00 0,00 0,00
0807 Melons (Including Watermelons) And Papaws
(Papayas), Fresh 0,00 0,00 0,00 0,00 0,00
0808 Apples, Pears And Quinces, Fresh 0,00 0,00 0,00 0,00 0,00
0810 Other Fruit, Fresh 0,00 0,00 0,00 0,00 0,00
0905 Vanilla 0,06 0,05 0,05 0,04 0,06
0908 Nutmec, Mace And Cardamoms 0,43 0,51 0,51 0,45 0,74
0910 Ginger, Saffron, Turmeric (Curcuma), Thyme,