A Study On The Different Applications Of Performance-Based Budget And Zero-Based Budget On
Regional Task Force Units In North Sumatra
Author’s Details:
(1)Arifin Lubis, (2)Hasan Sakti Siregar, (3)Syarief Fauzi*
1
Universitas Sumatera Utara
Abstract. This research aims to analyze the effect of zero-based and performance-based budget on the performance of government task force units in Medan city and other nearby districts. It is an explanatory survey that describes the causal relationship of a phenomenon. The population of this study involves all the treasurers of task force units in the cities/districts namely, Medan, Asahan, Batubara and Tanjungbalai. Using the stratified random sampling, there were 210 questionnaires distributed to the chosen respondents. The study has found that the application of zero-based budget does not affect partially the performance of task force units. Moreover, the application of performance-based budget affects partially the performance of task force units in Medan city. In addition, it concludes that there is a difference in performance between the Zero-based budget (ZBB) and Performance-based budget.
Keyword: Zero-based budget, performance-based budget, performance of regional government and the task force units.
1. INTRODUCTION
Performance-based budget is a budgeting system adopted by the regional government that has been seen as crucial in obtaining transparent financial results. The performance indicators have been used in the planning and documentation of the government budgeting process. As highlighted in Act No. 22/1999 on Regional Government and Law No. 25/1999 on Fiscal Balance between Central and Regional Territories, the regional government has an authority in the budgeting development which includes formulating and evaluating policies. With the greater authority in the budgeting implementation, the regional financial budget and its management should be done transparently and always be guided by the principles set out in the financial regulations (Bastian, 2006). In relation to the regional budget, it has also been used as a tool to determine the amount of income or expenses to help in the decision-making, development planning, as well as the authorization of expenditures in the future. This is the main policy instrument of regional governments which occupy a central position on the capability and effectiveness of budgeting development.
Meanwhile, according to the enactment of Government Regulation No. 105/1999, the budget only provides information about the number of sources of income and uses of funds, while the information on performance as well as economic and social circumstances and opportunities are not captured. This is in spite of the fact that this information is an indicator that should be the benchmark in preparing the budget. The vagueness of the information causes the budget system to fail to provide a comprehensive picture of the
Earlier, the structure of the regional budget had taken place before the issuance of regulations on the local autonomy where it had used an incremental approach and line items. The incremental approach using the previous year's data is a basis for adjusting the size of addition or reduction of the amount without the use of a more rational reason. Yet, this approach does not only guarantee the fulfillment of the real needs, but also it leads to continuous errors. Meanwhile, the
line item approach is a planned budget based on items that had existed in the past, whereby it does not allow local governments to eliminate one or more items of expenditure that have long existed. The logical consequence of this approach is the occurrence of both overfinancing and underfinancing in a work unit. Thus, this may lead to uneconomial public services, inefficiency and ineffectiveness, and failure to fulfill the demands and needs of the public.
In relation with financial management and budgeting system which have been set up by the regional government, it is indicated that the absorption and implementation of both are different in terms of the types and characteristics of administration in the city and district government. The differences revolve around the public service and policy, government investment, development planning and social culture issues that are used as the type of regional government variables (Abdullah, 2014). This study aims to see differences in the application of the zero-based and performance-based budgets. It will also reveal the effect of the application of the performance-based budget on the performance of government task force units. This research observed 33 task force units in the Medan city and other districts nearby the Medan city.
The formulation of the problem in this study is as follows: 1. Does the application of zero-based and
performance-based budgets influence the performance of government task force units in Medan city and other nearby districts?
2. Is there a difference between the achievement of the application of the zero-based with performance-based budgets on the government task force units in the city and district government?
3. Are there significant differences on the managerial aspect of performance budgeting in the city and district government?
assessing the economics and efficiency if applied by other Each activity will be evaluated separately through various programs developed in the vision of the year (Uluum, 2004). This concept is intended to overcome the weaknesses of the traditional budget system. Some of the weaknesses of the traditional budget system are revealed, among others: 1. Inadequate relationship between the annual budget
with the long-term development plan.
2. The effectiveness of the incremental approach that led to a large amount of spending is not thoroughly examined.
3. The process of a separate budget for current and capital expenditure/investment.
4. The budget is an annual tradition which is too short, especially for capital projects that encourage undesirable practices.
The preparation of budget using the ZBB concept can eliminate incrementalism and line-item that have been assumed to start from zero. This incremental budget will be based on the size of this year’s budget to set the next year's budget i.e. by adjusting the rate of inflation or population. Budget items that are not relevant to support the achievement of organizational goals can be eliminated from the structure of the budget or new items may appear (Fisher et. al., 2002).
The Implementation Process of ZBB
The ZBB implementation process consists of three stages (Uluum, 2004), namely:
1. Identification of decision units
The ZBB system is based on the responsibility center as a basis for planning and controlling the budget. A unit is a set
of decision-making units at a smaller level, for example, a regional government is a unit to make big decisions that can be broken up again into offices; agencies broken down into sub-agencies; sub-agencies split into sub-programs, and so on. Thus, a local government can have thousands of decision units. After undertaking the identification of decision units appropriately, then it needs to prepare a document which contains the decision unit goals and actions that can be done to achieve objectives. The document is referred to as decision packages.
2. Determination of the decision packages
Decision package is a comprehensive overview of
organizations’ activities that can be evaluated on an
individual basis. The package of decision made by the manager must indicate in detail the estimated costs and
revenues which are expressed in terms of tasks’
achievements and benefits. Theoretically, decision packages are intended to identify alternative actions in implementing the functions of the unit for determining the differences in the performance level in each alternative. There are two types of decision package, namely:
a. Package of mutually-exclusive decisions; they consist of packages that have the same function. If one of the packages is selected, then the consequence would be rejecting all other alternatives.
b. Package incremental decisions. This package reflects the different levels of performance which are associated with costs in carrying out a particular activity. There is a base package that shows a minimal level of activity, and other packages have higher level of activity that will affect the rise in cost. Each of the packages has the costs and benefits that have been clearly tabulated.
3. Ranking and evaluating the decision package.
If the decision package has been prepared, the next step is to rank all the packages based on the benefits to the organization. This stage is the bridge to get to the process of resource allocation among various activities, some of which already exist and others are entirely new.
Advantages of ZBB Disadvantages of ZBB
The process of making a decision can ensure the availability of more useful information for management.
It is difficult to be applied because it takes a long time, too theoretical and impractical, costly and produce a working paper that has accumulated due to the decision-making package.
The funds can be allocated more efficiently, because there are several decision alternatives on
implementation of the decision.
Implementation of ZBB cause behavioral problems in organizations.
All programs and activities are always reviewed. Allows the emergence of the mistaken impression that all packages have to go into budget decisions.
Decision makers can obtain information about activities
in a critical condition and urgently. ZBB tend to emphasize short-term benefits
Requires special expertise in the determination of priorities and more complete data and analysis support that is strong enough.
Source: Uluum (2004)
created to meet unlimited social needs. It is also to avoid the duplication of work plans and aims to minimize the gap between the target and the results achieved based on performance measures.
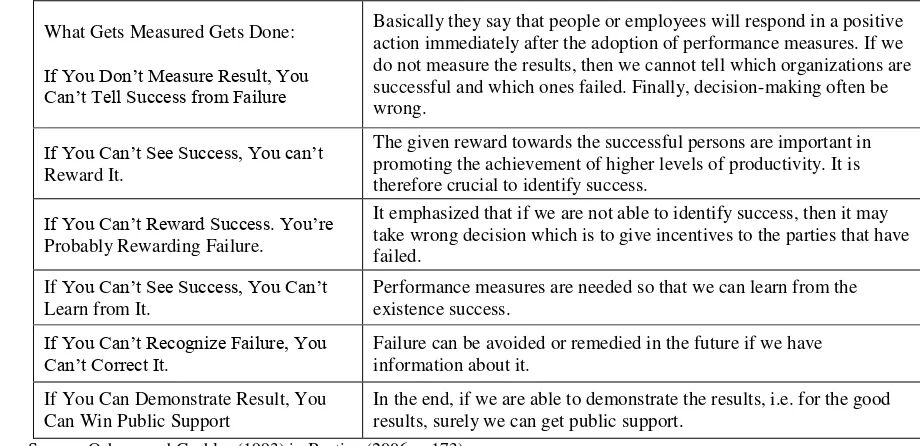
According to Mahmudi and Mardiasmo (2005, p.6) it is stated that performance refers to “something related to the activities of doing the job that include the outcome of the work". In short, it can be explained that the performance was a result of the activities that have been done. Osborn and Gaebler (1993) in Bastian (2006, p.173) argue over the power of performance measurements as presented in Table 1.
Table 1. The Power of Performance Measurement
What Gets Measured Gets Done:
If You Don’t Measure Result, You Can’t Tell Success from Failure
Basically they say that people or employees will respond in a positive action immediately after the adoption of performance measures. If we do not measure the results, then we cannot tell which organizations are successful and which ones failed. Finally, decision-making often be wrong.
If You Can’t See Success, You can’t
Reward It.
The given reward towards the successful persons are important in promoting the achievement of higher levels of productivity. It is therefore crucial to identify success.
If You Can’t RewardSuccess. You’re
Probably Rewarding Failure.
It emphasized that if we are not able to identify success, then it may take wrong decision which is to give incentives to the parties that have failed.
If You Can’t See Success, You Can’t Learn from It.
Performance measures are needed so that we can learn from the existence success.
If You Can’t Recognize Failure, You
Can’t Correct It. Failure can be avoided or remedied in the future if we have information about it. If You Can Demonstrate Result, You
Can Win Public Support
In the end, if we are able to demonstrate the results, i.e. for the good results, surely we can get public support.
Source: Osborn and Gaebler (1993) in Bastian (2006, p.173).
The budgeting performance measures give impetus to the budgetary executive to be able to achieve maximum results in the size of the specified performance. Failure in achieving performance is a measurement to make improvements in the future, while the success of the performance requires an appreciation that can improve productivity as well as to gain public support. Moreover, measuring the performance of activities of an organization may reflect the concern of the management. An organization's business activities need to know whether the service they provide meets the principles of economy, and is efficient and effective. This represents the manager’s accountability to stakeholders. The business services are responsible not only in physical terms, but more than that, they suggest that it is a good business management.
Several researchers define the performance measurement differently, but most of them agreed that it is the process of measuring the performance done by the managers as an accountability process for all activities to stakeholders. Hatry (1999) defines performance measurement as a measurement result and the efficiency of services based on regular bases. In relation to the performance measurement for government agencies, Whittaker (1995) defines it as a management tool used to improve the quality of decision making and accountability in assessing the success or failure of the implementation of activities in accordance with the objectives that have been set previously in order to realize the mission and vision of government agencies. Similarly, Smith (1996) states that the performance measurement system can assist managers in monitoring the implementation of organizational strategies by comparing the current results with the strategic goals, or it is a method to assess the progress that has been achieved compared to the intended purpose.
The government institutions in terms of their provision of public services cannot be compared directly with the management of production, as has been done by private companies. Therefore it needs a performance measurement and assessment with its own manners. The information on the performance will expectedly assist in the formulation of the budget plan as well as used for
employees’ appraisals that will help to improve the government's ability to manage its resources. Good performance measurement system will help employees to demonstrate to the public and policy makers that the public services have been held fairly, which in turn will form public trust (Hatry, 1999).
2.3. Review on Previous Researches
The matrix of previous researches related to this study is reviewed in the Table below:
Table 2. Review on Previous Researches
No. Author/Year Title Variable adopted Findings of Research
1. Erwati, Misni
(2009)
The effect of preparation participation on performance-based budget of task force units with organizational commitment and leadership style as moderating in Jambi
Performance as a commitment and leadership style as a moderating variable. Data validity and up to date; (6) Working description & performance.
Based on the results of linear regression model, it found 5 factors that affect the budget planning
Highlight the synergies between the planning (resourceallocation) and control (performance evaluation) functions of managerial accounting practices such as budgeting.Our results also suggest that by designing the internal information system to reduce information asymmetry among subordinates, the firm model on task force units in Purwokerto district
Task force unit performance
Easy to implement, but requires adequate human resources and should be supported with adequate funding. Personel Competence affect on Annual Performance Plan.
6. Rahmanti (2003) Implementation of UAD
performance measurement model in Magelang office
The health performance of task force units
The model can not be used to measure the health status as a primary indicator that describes the success/failure of development in the health field.
2.4. Conceptual Framework
Below is the conceptual framework proposed in this study:
Figure 1. Conceptual Framework
2.5. Hypotheses
The hypotheses of this study are as follows:
1. The application of zero-based and performance-based budget influences the performance of government’s task force unit in the Medan city and other districts.
3. There are significant differences on the managerial aspect of performance budgeting in the city and district governments.
3. RESEARCH METHODOLOGY 3.1. Population and Sampling Frame
The population of this study includes all the treasurers and the members of treasury who are involved in the preparation of budget in each of the task force units in the Medan city and other districts/cities such as Asahan, Batubara and Tanjungbalai. The samples are 210 respondents derived from the stratified random sampling.
3.2. Operational Definition and Measurement of Variables
Both independent and dependent variables are defined and explained in Table 3 below.
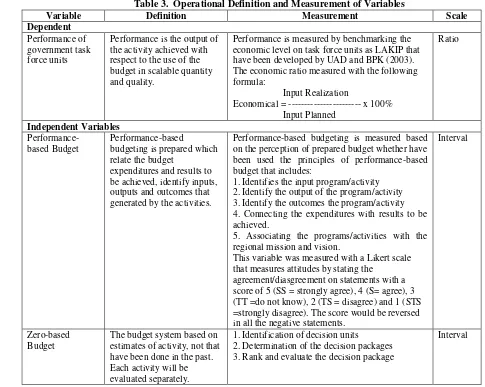
Table 3. Operational Definition and Measurement of Variables
Variable Definition Measurement Scale
Dependent
Performance of government task force units
Performance is the output of the activity achieved with respect to the use of the budget in scalable quantity and quality.
Performance is measured by benchmarking the economic level on task force units as LAKIP that have been developed by UAD and BPK (2003). The economic ratio measured with the following formula:
Input Realization
Economical = --- x 100% Input Planned
Ratio
Independent Variables
Performance-based Budget
Performance-based
budgeting is prepared which relate the budget
expenditures and results to be achieved, identify inputs, outputs and outcomes that generated by the activities.
Performance-based budgeting is measured based on the perception of prepared budget whether have been used the principles of performance-based budget that includes:
1. Identifies the input program/activity 2. Identify the output of the program/activity 3. Identify the outcomes the program/activity 4. Connecting the expenditures with results to be achieved.
5. Associating the programs/activities with the regional mission and vision.
This variable was measured with a Likert scale that measures attitudes by stating the
agreement/diasgreement on statements with a score of 5 (SS = strongly agree), 4 (S= agree), 3 (TT =do not know), 2 (TS = disagree) and 1 (STS =strongly disagree). The score would be reversed in all the negative statements.
Interval
Zero-based Budget
The budget system based on estimates of activity, not that have been done in the past. Each activity will be evaluated separately.
1. Identification of decision units
2. Determination of the decision packages 3. Rank and evaluate the decision package
Interval
3.3. Data Collection and Analysis
The data collection of this study uses the primary (questionnaire) and secondary data. The questionnaire consists of two parts; (i) a number of general questions of demographic items; (ii) a number of statements related to performance-based budgeting. Then this research uses a form of structural equation modeling in the data analysis, whereby the variables can be assessed based on the reflective and formative theories. Using WarpPLS SPSS 3.0, several statistical tests were run in this study.
4. FINDINGS AND DISCUSSION. 4.1. Data Description
There are 300 questionnaires that had been distributed to the respondents. However, 210 questionnaires are used for data analysis; in other words, this study has 70% return rate.
4.2. The Instrument Analysis of the Research 4.2.1. The Zero-based Budget Variable
Table 4. Validity Test of Zero-based Budget Item-Total Statistics
Scale Mean if Item Deleted
Scale Variance if Item Deleted
Corrected Item-Total Correlation
Cronbach's Alpha if Item Deleted
zbb1 15.9000 3.574 .560 .675
zbb2 15.9905 3.646 .584 .668
zbb3 16.1048 3.989 .422 .725
zbb4 16.4381 3.798 .495 .700
zbb5 16.5762 3.537 .475 .712
Source: Data Output, 2014.
Table 4 shows that 5 items of the variable are valid questions that can be used for the variable’s analysis with a correlation coefficient (r) greater than 0.1361.
4.2.2. The Performance-based Budget Variable
The results of the validity and reliability of performance -based budgeting variable can be seen in Table below.
Table 5. Validity Test of Performance-based Budget Item-Total Statistics
Scale Mean if Item Deleted
Scale Variance if Item Deleted
Corrected Item-Total Correlation
Cronbach's Alpha if Item Deleted
abk1 16.2381 4.919 .672 .809
abk2 16.3619 4.510 .703 .797
abk3 16.4714 4.499 .738 .788
abk4 16.4857 4.691 .614 .822
abk5 16.3857 4.870 .541 .842
Source: Data Output, 2014.
Table 5 shows the 5 items of the performance-based budget. All 5 items are valid questions that can be used for the variable’s analysis with a correlation coefficient (r) greater than 0.1361.
4.2.3 The Budget Performance Variable
The results of validity and reliability of the variable can be seen in Table below.
Tabel 6. Validity Test of Budget Performance Item-Total Statistics
Scale Mean if Item Deleted
Scale Variance if Item Deleted
Corrected Item-Total Correlation
Cronbach's Alpha if Item Deleted
k1 7.1619 2.634 .609 .771
k2 7.5571 1.702 .742 .616
k3 7.5286 2.203 .615 .752
Source: Data Output, 2014.
Table 6 shows the 3 items of budget performance variable. All 3 items are valid that can be used for the variable’s analysis with a correlation coefficient (r) greater than 0.1361.
4.2.4 The Size of Regional Government Variable
The results of the questionnaire’s validity and reliability of the size of the regional government variable can be seen in Tablebelow.
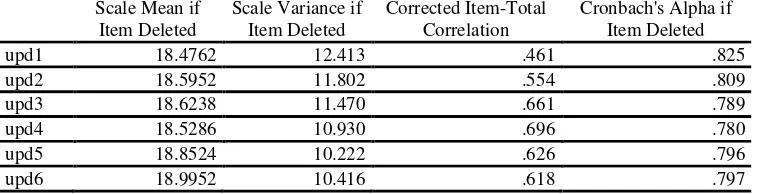
Table 7. Validity Test of Regional Government Item-Total Statistics
Scale Mean if Item Deleted
Scale Variance if Item Deleted
Corrected Item-Total Correlation
Cronbach's Alpha if Item Deleted
upd1 18.4762 12.413 .461 .825
upd2 18.5952 11.802 .554 .809
upd3 18.6238 11.470 .661 .789
upd4 18.5286 10.930 .696 .780
upd5 18.8524 10.222 .626 .796
upd6 18.9952 10.416 .618 .797
Table 7 shows that the 6 items of regional government variable are valid questions that can be used for the variable’s analysis with a correlation coefficient (r) greater than 0.1361.
4.3. Classical Assumption Test
Based on the results of the normality test using the test chart, it can be concluded that the data have a normal distribution.
Figure 2. Normal P-Plot of Regression Standardized Residual
By looking at the graphs that display the normal plot in Figure 2, it can be concluded that the data spread around the diagonal line and follow the direction of the diagonal line. This shows that the data residuals are normally distributed. Similarly, the results of the histogram graph in Figure 2 show that the data are normally distributed residuals are seen from the picture in bell shape (symmetrical).
4.3.1. Multicollinearity Test
Based on the results of the correlation between the independent variables, by looking at the value of VIF we can conclude that the multicollinearity problem does not occur. This is supported by the full value Collon VIF that is relatively small, i.e. no greater than 3.3 (Kock, 2013).
Table 8. Multicollinearity Test Result
Source: Test Result WarpPLS. 2014.
The results conclude that the independent variable does not create any multicollinearity problem in the regression analysis model.
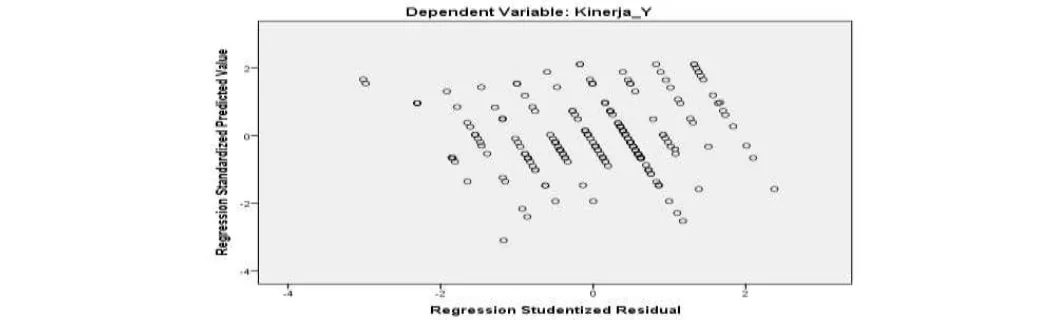
4.3.2 Heteroscedasticity test
Figure 3. Scatterplots Graph
The scatterplot graph shows that the dots randomly spread in both above and below 0 on the Y axis. It does not form a specific pattern which concludes that there is no heteroscedasticity in the regression model.
4.4. Hypotheses Test
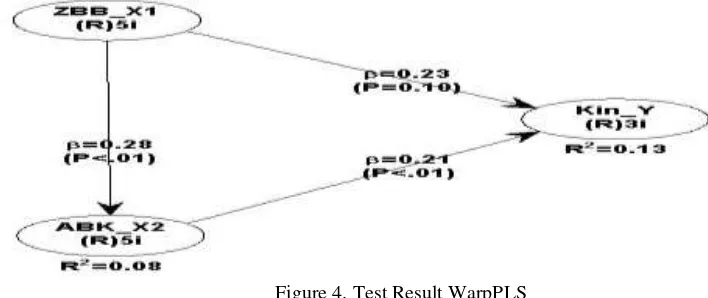
The first hypothesis states that the variable of ZBB (X1) and Performance-based budgeting (X3) partially affect the budget performance (Y) of the government task force units inside and outside of Medan city. In the partial statistical test with the critical t value (critical value) at df = (nk), where n: the number of samples and k: the number of independent variables including a constant. To test the individual partial regression of each independent variable, this can be seen in the following figure 4:
Figure 4. Test Result WarpPLS
As illustrated in Figure 4 of the statistical test, t is then obtained, as follows:
1. The variable zero-based budget with a beta value of 0.23 and the p-value with 0.10 probability level. It concludes p = 0.10>
α = 0.05, which means that we accept H0 and reject Ha indicating that the variable zero-based budget does not significantly affect the performance budgeting.
2. The variable performance-based budget 0.21 beta value and p-value with 0.01 probability level. It concludes p = 0.01 <α = 0.05, which means that we reject H0 and accept Ha that states that the variable performance-based budget significantly has positive effect on the performance budgeting.
From the description above, it can thus be composed of multiple regression equations derived from the path coefficient as follows:
Y = 0,226 X1 + 0,212 X2 + e
The multiple regression models explain as follows:
1. The variable zero-based budget does not affect the performance budgeting with the coefficient value of 0.226, meaning that each additional unit of the value of the variable score zero-based budget will raise the value of one unit of the performance budgeting scores by 2.26 units.
2. The variable performance-based budget affects the performance budgeting with the coefficient value of 0.212, meaning that each additional unit of the value of the variable scores under the performance-based budget will raise the value of one unit of the performance budgeting score of 2.12.
4.5. Result of Determinant Coefficient Test (R2)
The coefficient of determination is used to test the goodness-fit of the regression model that can be seen from the value of R Square. R square indicates the endogenous constructs. For a set of latent predictor variables on the criterion variable, we use the indicator Q-Squares or any other term called Stoner-Geisser coefficient (Ghozali, 2005). To know the effect of the variable Zero-based and performance-Zero-based budget on the performance of the budget the coefficient of determination can be consulted.
Table 9. Determinant Coefficient
As illustrated in Table 9, the variables included in the regression model have the ability to explain the budgeting performance by 12.6 percent, while the remaining 87.4 percent is explained by other factors not included in the regression model. Meanwhile, the Q-squared value of 0.127 means that the estimated models have shown a good predictive validity by 12.7%. This second hypothesis is related to whether there is a difference between the application of a zero-base budget with the performance-based budget on the task force units in municipal and district governments, then the difference is tested as follows:
Table 10. Paired Sample Correlation Test
N Correlation Sig. Pair 1 ZBB_X1 & ABK_X2 210 0.149 0.031 Source: Data Output SPSS, 2014.
The statistical results indicate that, there is a significant difference between zero-based with performance-based budget on the government task force units in the cities/districts. Thus, Ho is rejected and Ha accepted. These results are consistent with the results achieved in the the previous study. For a discussion of the third hypothesis, t test is as follows:
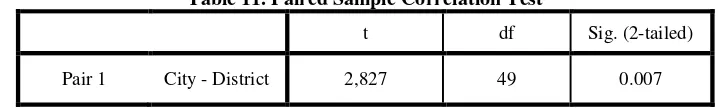
Table 11. Paired Sample Correlation Test
t df Sig. (2-tailed)
Pair 1 City - District 2,827 49 0.007
Source: Output Data SPSS, 2014.
Based on these tests, it shows that the budget management in the municipal and district governments has insignificant difference whereby the significance value is greater than the alpha value of 5% (0.007> 0.05). Thus, Ho is accepted and Ha rejected.
4.6. Discussion of Results
The hypothesis states that the variable of zero-based budget and the performance-based budget affecting the budgeting performance is acceptable. The performance-based budgeting known in the regional financial management since the issuance of Government Regulation No.105/2000 in Article 8 stated that the budget was drawn up by the performance approach. The implementation of the performance-based budgeting in government agencies in Indonesia was launched through the application of Law No. 17/2003 on regional finances which have been implemented in stages starting from 2005 fiscal year.
Mahmudi and Mardiasmo (2005) stated that the performance budget preparation and budget management system are essentially oriented to the achievement of outcome or performance. The performance reflects the efficiency and effectiveness of public services, which means that it is public interest-oriented. Furthermore, They (p.132) posited that the sense of efficiency is closely related to the concept of productivity. The efficiency measurement is done by using a comparison between the output produced to inputs used (cost of output). The process operations can be considered to be efficient if a particular product can be accomplished by low use of resources and funds, while the understanding on the effectiveness is essentially related to the achievement of objectives. Meanwhile, the effectiveness is the relationship between the output of the objectives to be achieved, and the operational activities are effective when its process has achieved the objectives.
The preparation of budget with limitation in resources must be able to serve the interest of society optimally. Thus, at first, the budgeting process should selectively accommodate the needs of the community that will be met within a certain period, in other words the numbers listed in the budget proportionally fulfill the needs of the community. The performance-based budget requires the creation of new
programs, activities (innovation) and strategies to deal with resource limitations.
Woelfel (1987, p.36) in Ikhsan, et. al. (2007, p.9) stated that performance budgeting is a budget structure that (1) focuses on the creation of activities or functions of a product or outcome where the resources are used; and (2) shows the budgeting process which seeks to link between organizational goals with the use of its resources. In this case, the principle of the budget focuses on increasing the efficiency by means of the classification and measurement of the activity fee (cost).
In government rule (PP No.105/2000), it explains that the budget with the performance approach is a budget system that promotes the achievement of the work or the output of the allocation of costs or the specified input. Based on this definition, any input specified in the budget should be measurable results rather than based on the amount of funds that have been spent as implemented in traditional budgeting systems (line-item budget and incremental) but based on performance benchmarks that have been set.
According to Government Decree No. 59/2007, the notion of performance-based budget is as follows:
1. A budget system that promotes the achievement of the work or the output of a cost allocation plan or the specified input.
2. Based on the objectives and performance targets. Budget is seen as a means to an end.
3. Assessment of performance is based on the implementation of value for money and effectiveness of the budget.
Bastian (2006, p.171) posited that the performance-based budgeting is a budgeting system that has an orientation to the outputs of the organization and is associated closely with the vision, mission and strategic plan of the organization. It is also used to allocate the resources to the program. Based
on Bastian’s explanation of performance-based budgeting, the components of the vision, mission and strategic plan make up an integral part of performance-based budgeting. Thus, it requires a public administration system that has been laid out with a good, consistent structure so that a budget can be achieved based on the performance measures that have been set. Through this performance measurement, the management can determine the success and failure of an organizational unit on the achievement of goals. Meanwhile, according to Abdullah (2014), in relation to a study on the regional government, both in terms of the local finance, political budget, public service and policy, government investment, development planning, social and cultural issues are often incorporated with the local government-associated variables.
4.7 Conclusion and Recommendation
This study finds several conclusions as follows:
1. The application of zero-based budgeting (ZBB) does not partially affect the performance of government departments in Medan city.
2. The implementation of performance-based budgeting partially affects the performance of government departments in Medan city.
3. There are differences between the ZBB and performance-based budgeting.
4. There are significant differences in managing the performance-based budgeting in the regional government of municipals and districts.
Meanwhile, the study comes up with several recommendations:
1. The differences between Zero Based Budget and the performance-based budgeting provide an opportunity the determination of different indicators for each activity of the budget implementation.
2. It requires the examination of the behavior on the implementation of performance-based budgeting towards work pressures.
3. The application of performance-based budgeting requires sufficient data input to carry out a program, only then a good performance of targeted budget can be (Accounting System of Public Sector). Salemba Empat. Jakarta.
Erwati, M. (2009). Pengaruh Partisipasi Penyusunan Anggaran Berbasis Kinerja terhadap SKPD Pemerintah Daerah dengan Komitmen Organisasi dan Gaya Kepemimpinan Sebagai Moderating di Kota Jambi. Jurnal Percikan, 102(1).
Flynn, M. (1997). Public Sector Management, Prentice Hall. Firmansyah, M. A. (2009). Faktor-Faktor yang
Mempengaruhi Perencanaan Anggaran berbasis Kinerja di Propinsi DKI Jakarta. Jurnal Online,
Universitas Indonesia.
Fisher, J. G., Laureen A. M., Sean A. P., & Geoffrey B. S. (2002). Using Budgets for Performance Evaluation: Effects of Resource Allocation and Horizontal Information Asymmetry on Budget Proposals, Budget Slack, and Performance. The Accounting Review. 77(4). pp. 847-865.
Freeman, R. J., & Craig D. S. (2003). Govermental and Nonprofit Accounting Theory and Practice. 7th Edition. Pearson Education, Inc.
Ghozali, I. (2005). Aplikasi Analisis Multivariate Dengan Program SPSS (Multivariate Application Analysis with SPSS Program). Semarang: Badan Penerbit UNDIP.
Hatry, H. (1999). Performance Measurement, The Urban Institute, Washington D.C.
Ikhsan, Arfan, and La Ane. (2007). The Effect of Budget Participation on Budget Gap by using Five Moderating Variables. National Symposium on Accounting X. Makasar: Hasanuddin University. Kock, N. (2013). Using WarpPLS in E-collaboration
Studies: What If I Have Only One Group and One Condition?. International Journal of e-collaboration, 9(3), 1-12.
Ulum, I. (2004). Akuntansi Sektor Publik (Accounting of Public Sector). UMM PRESS, Yogyakarta.
Mahmudi and Mardiasmo. (2005). Local Government Performance Measurement In The Era of Local Autonomy: The Case of Sleman Regency Yogyakarta, Jurnal Sosiosains, 17(1), pp. 117-133. Priyono, & Medi. (2003). Implementasi Model Pengukuran
Kinerja Satuan Kerja di Pemerintah Daerah Kabupaten Purworejo, Prosiding Seminar Nasional Pengukuran Kinerja Pemerintah Daerah, UAD Press, Yogyakarta.
Rahmanti, E. (2003). Implementasi Pengukuran Kinerja Model UAD Pada Dinas Kesehatan Kota Magelang, Prosiding Seminar Nasional Pengukuran Kinerja Pemerintah Daerah, UAD Press, Yogyakarta.
Riyanto, U., & Ratminto (2006). Implementasi Anggaran Berbasis Kinerja di Lingkungan Pemerintahan Kabupaten Sleman. Jurnal Sociosains. 19(1). Smith, P. (1996). Measuring Outcome in the Public Sector,
London: Taylor & Francis Publisher.