DATA COLLECTION METHOD FOR PEDESTRIAN MOVEMENT
VARIABLES
Kardi Teknomo1, Yasushi Takeyama2, Hajime Inamura3
1Doctoral student, 2Ass. Prof., 3Prof. Graduate School of Information Science, Tohoku University
Japan
ABSTRACT
The need of tools for design and evaluation of pedestrian areas, subways stations, entrance hall, shopping mall, escape routes, stadium etc lead to the necessity of a pedestrian model. One approach pedestrian model is Microscopic Pedestrian Simulation Model. To be able to develop and calibrate a microscopic pedestrian simulation model, a number of variables need to be considered. As the first step of model development, some data was collected using video and the coordinate of the head path through image processing were also taken. Several numbers of variables can be gathered to describe the behavior of pedestrian from a different point of view.
This paper describes how to obtain variables from video taking and simple image processing that can represent the movement of pedestrians and its variables.
Keywords: Microscopic pedestrian model, image processing.
DATA
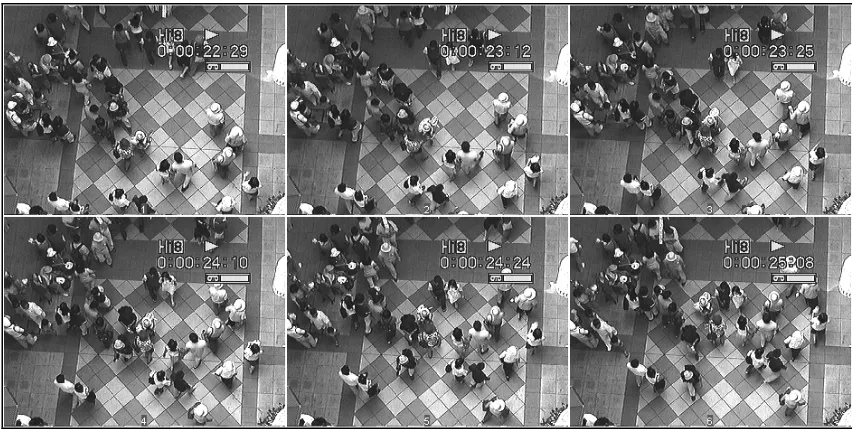
As a simple case study, video data was taken from Vlandome in Sendai city Center during Tanabata festival 7 August 1999 at 15:30 p.m. Vlandome is pedestrian-only road with shops along the road. The video was taken from a maintenance deck above the pedestrian way (about 10-15 meter above the road) using handycam video camera. Only 150 seconds data was taken for this case study. The total of number of observation is 3170 and 152
pedestrian.
DATA COLLECTION METHOD
Six steps data collection method is suggested:
1. Conversion from Video to File
2. Collection of head-path coordinates
3. Trimming Data into Pedestrian Trap only
4. Conversion Image Coordinate to the Real
World coordinates
5. Graphing Pedestrian Movement
6. Calculation of Pedestrian Movement
Variables
Note: Discussion is expected before May, 1st 2000. The
proper discussion will be published in “Dimensi Teknik Sipil” volume 2 number 2 September 2000.
Step 1. Conversion from Video to File
The video was converted to files using a freeware “NIH image” [1, 2] and its macro ‘make movie to disk’. This macro captures the film as a picture and saves every picture-frame into a frame-file. One second on a video film normally consist of a 30 frame picture. Due to the different speed between computer and the video camera speed, the maximum number of frame that can be gathered is two frames per second (about 0.5 second per frame). Higher number of frames can be gathered, but the pictures are not clear. A maximum of 159 frame-files can be saved at one running. All the frame-files that have been gathered can be put together into a single stack-file. For simplicity, 150 frame per stack file is used.
Special attention must be given for continuation of the film. The beginning of next stack file (i.e. frame number 151) was taken as much as possible the same time with the last frame on the previous stack (i.e. frame number 150).
Step 2. Collection of Head Path Coordinate
as the representative point. If other parts of the body are going to be used, it is difficult to be consistent for all pedestrians. The height of each pedestrian is assumed to be the same.
Table 1. Example Result from Image Processing: Image Database
NoObs PersonN o T Xi Yi
39 3 13 475 411
40 3 14 475 429
41 3 15 470 448
42 3 16 469 473
43 4 2 586 145
44 4 3 592 233
45 4 4 598 311
46 4 5 598 379
47 4 6 585 442
48 5 2 258 236
49 5 3 264 266
50 5 4 253 290
51 5 5 250 315
52 5 6 253 337
53 5 7 242 362
54 5 8 230 382
55 5 9 226 408
56 5 10 217 426
57 5 11 201 439
58 5 12 192 458
59 5 13 183 475
60 6 2 311 269
61 6 3 309 299
To be able to distinguish the movement of every pedestrian, each pedestrian is followed frame by frame from the time he/she shows up in the image until the head is out of the image. One
observation point is the position of a single pedestrian in one frame. The frame number when a pedestrian shows up is noted to ease the searching. After a pedestrian is out of image,
the next pedestrian is searched.
A simple macro is written for preparing the image software, taking the XY coordinates and the frame number and go to the searched image. However, since it is not posible to search the image of head and to distinguish when a pedestrian is going in or out of image, we have done all the data collection was done manually. A single person can collect about 40-60 pedestrian path per 8 hours working.
At the end of every stack and beginning of next stack-file, manual searching of each pedestrian in the image and their location need to be carefully done.
The result of the step 2, as shown in table 1, was called Image Database that contained five columns: Observation number (No Obs), Pedes-trian number (person No), T, Xi, Yi. Observation number is merely an ordered number from one to total number of observation. Every pedestrian that was observed in the image was numbered. This number is useful to distinguish the data of a pedestrian from the other. T represents the frame number. Because every two frame has interval of 0.5 seconds, T can be called as clock time. Xi and Yi are the coordinate location of the head of a pedestrian in a frame. Every row in the Image Database represents a single obser-vation.
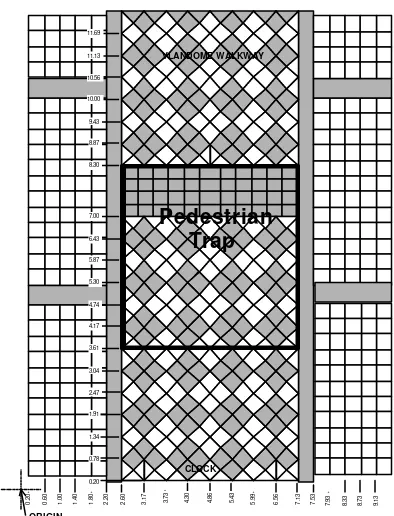
Step 3. Trimming Data into Pedestrian-Trap Only
Pedestrian Trap is an imaginary rectangular marked in the middle of walkway as boundary to count the pedestrian (see figure 2). The width is perpendicular of the pedestrian way while the length is parallel to the walkway.
CLOCK VLANDOME WALKWAY
0.60 1.00 1.40
0.20 1.80 2.20 2.60 3.17 3.73 4.30 4.86 5.43 5.99 6.56 7.13 7.53 7.93 8.33 8.73 9.13
0.78
Figure 2. Real World Coordinate and Pedestrian-Trap
Only the pedestrians who pass the trap are considered. Pedestrian trap is used to ease the measurement. It is easier to calculate the area and to get the coordinate of a rectangle than any other shape. The images were taken by angles from the pedestrian walkway, and cover non-rectangular area. Due to lens distortion, the smallest error will be in the middle of the image and higher error at the edge of the image. Pedestrian trap needs to be defined to reduce the lens distortion error and to ease the measurement.
The south west of the pedestrian trap will serve as origin point of the coordinate. The origin point can be put in any place. Coordinate X is larger to the right, while coordinate Y is larger to the north. In this case study, the boundary of pedestrian trap passes the four point of real world coordinate A(260, 361), B(713,361), C(260,830) and D(260,830).
Since the XY coordinate of the real world will contain errors of calibration, to reduce the error, the data trimming outside pedestrian trap was
done using Image Coordinate (Xi, Yi) instead of using real world coordinate (Xr, Yr). The trimming process was done as follow:
1. The image coordinates of four points (A’, B’,
C’, D’) that bound the real world rectangular were obtained from the image file.
2. Line equation of A’B’, B’D’, C’D’, A’D’ is
derived from straight-line equation.
3. Any row from the Image Database that
contain Yi below line A’ B’ or above line C’D’ or Xi on the left line A’C’ or on the right line B’D’ were trimmed out from the database.
Step 4. Conversion Image Coordinate to the Real World coordinates.
Several models has been considered based on [3] and simple but satisfying model to convert Image Coordinates (Xi,Yi) to real world coor-dinates (Xr,Yr) was found using linear regression:
Xr = a + b.Xi + c.Yi
Yr = d + e.Xi + f.Yi (1)
In our case study, the conversion model was obtained using 151 data:
Xr = 66.45 + 1.23 * Xi – 0.099 * Yi (R2=0.999)
(44.3) (349.1) (-28.9) (t)
and
Yr = 250.87 + 0.067 * Xi + 1.29 *Yi (R2=0.998)
(151.9) (17.5) (344.3) (t)
The t-statistic is given in the parentheses. The maximum error was +17 cm for Xr and –21 cm for Yr at the edge of the image.
Calibrated Database consists of Observation number, Pedestrian number, Clock Time, Xr, and Yr of the data in the pedestrian trap only. From 3170 observation, only 2076 observation was used as Calibrated Database.
Step 5. Graphing Pedestrian Movement
Head Path Movement
350
250 350 450 550 650
Xr (cm)
Yr (cm)
Figure 3. Head-Path Movement of Pedestrian
Figure 3 shows the head path of all pedestrians who move from clock time 10 second to 20 seconds in the pedestrian trap. Each line represents one person and a point in the plot represents the location of a pedestrian at the corresponding instant of a time (0.5 seconds interval). The length between two points in a path represents the walking speed of the pedestrian. It can be seen that their head movement is not in a straight line.
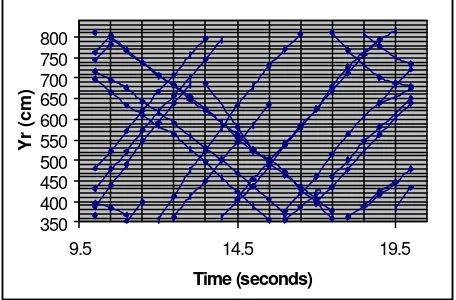
Abscissa-Ordinate Time Trajectory
Figure 4 and 5 shows the trajectory of time and ordinate-time separately. Abscissa-Time trajectory (Fig. 4) shows the movement of pedestrian in East-West direction while Ordinate-time trajectory (Fig. 5) exhibits the movement in North-South direction. Each line portrays the movement of a pedestrian in the direction that they represented. The slope of the line toward time axis denotes the projection velocity in their direction. In the Ordinate-Time trajectory, for instance, pedestrians who move from South to North will have positive slope, while pedestrians who move from North to South will have negative slope.
It is interesting that the paths in the Ordinate-Time trajectory make almost linear lines. If every line between two dot of head path in XY coordinate (figure 3) can be represented as a vector. It can be derived into X component and Y component and T component (as seen in Figure 4 and 5). Comparing the lines path Figure 3, 4 and 5, it can be deduced that for the same component of T, non-linear path of pedestrian movement is influenced mostly by the X component rather than it's Y component.
250
Figure 4. Trajectory of Abscissa-Time
350
Figure 5. Trajectory of Ordinate-Time
Step 6. Calculation of Pedestrian Move-ment Variables
A number of pedestrian movement variables can be obtained from the Calibrated Database. Since each row in the database represent a number of observation, and they are sorted by observation number, these variables can be determined for each person (i.e. the same person number).
Travel Distance and Speed
For each observation k, the travel distance can be calculated as:
interval, individual speed in m/s can be obtained from
Individual Speed = Travel Distance/(0.5 second *
100 m/cm) (4)
Time Mean Speed (TMS), the average individual speed, is equal to summation of all individual speed of a pedestrian, divided by number of observation of that person.
TMS = Individual Speed/Number of observation
per person (5)
When the counter k reached the end of observation of a pedestrian, accumulated travel distance can be calculated to represent the total walking distance of a pedestrian in the pedestrian trap. The average speed in the pedestrian trap, AS, can be calculated as follow:
AS = total walking distance/(100*(TimeIn
-Time-Out)) (6)
If the video started and ended with a number of pedestrian in the image, care should be given for the first and last group of pedestrian observed who started or ended the walk from the middle of the trap.
Density and Area Module
To obtain the density and Area Module, Calibrated Database was sorted by Clock Time and Data Number. By counting the number of pedestrian in the Pedestrian Trap at the same time (N), and divide the number with the area of pedestrian trap (A), density is obtained. Area Module is reciprocal of density.
Density = N / A (7)
Area Module = 1/ Density (8)
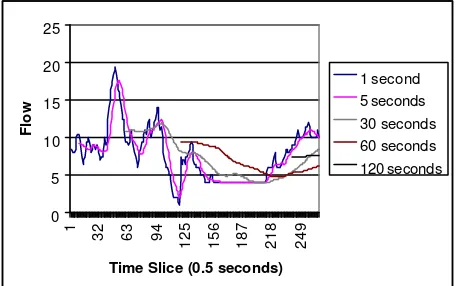
Flow
Using the same sorted database for calculating Density, Flow can be determined as the average number of person at a given interval as follow:
1. Determine the interval time of the flow,
count the time i=1 to t
2. Count the number of person for each time
clock Ni
3. Flow = ΣNi / t
An example of flow calculation from interval t = 1, second to t = 5 second is given in table 2.
Table 2. Flow Calculation
time clock number of person each time clock
1 9
Figure 6. Various of Time Intervals to Determine Flow
Figure 6 show the effect several of time intervals for determining the flow. The graph is a moving average flow according to the time interval specified. The larger time interval, the smoother the graph of Flow and the higher loss of the fluctuation data. Choice of time interval depends on the purpose of the study, for pedestrian model simulation, the smallest time interval is the best since it can explain the model well.
SUMMARY AND FURTHER
RESEARCH
The need for tools to design and evaluation pedestrian areas led to the necessity of Microscopic Pedestrian Simulation Model. Description on how to obtain variables that can represent the movement of pedestrian and its variables can be classify into six steps. The steps included conversion from video to file, collection of head-path coordinates, trimming data into pedestrian trap, conversion image coordinate to the real world coordinates, graphing pedestrian movement and calculation of pedestrian movement variables.
125 156 187 218 249
Time Slice (0.5 seconds)
Further researches on the relationship among those variables and choosing which factor that affect the pedestrian movement and its interaction need to be developed. If a variable can be obtained from other variables, it can reduce the data collection since we do not need to measure them all. Such relationship is also important to describe the behavior of pedestrian from different points of view.
REFERENCES
1. NIH Image version 1.61 Manual.
http://rsb.info.nih-gov/nih-image/download.html
2. Inside NIH Image.
http://rsb.info.nih-gov/nih-image/download.html
3. Tsai, R. Y, A versatile Camera Calibration
Technique for High-Accuracy 3D Machine Vision Metrology Using Off-the-Shelf TV
Cameras and Lenses, IEEE Journal of