PSYCHIATRY
REVIEW ARTICLE
published: 12 November 2012 doi: 10.3389/fpsyt.2012.00088
Systematic review of parameters of stimulation, clinical
trial design characteristics, and motor outcomes in
non-invasive brain stimulation in stroke
Bamidele O. Adeyemo
1,2, Marcel Simis
1,3†, Debora Duarte Macea
1,4†and Felipe Fregni
1,5*
1Laboratory of Neuromodulation, Spaulding Rehabilitation Hospital, Harvard Medical School, Boston, MA, USA
2Department of Physical Medicine and Rehabilitation, Spaulding Rehabilitation Hospital, Harvard Medical School, Boston, MA, USA 3Division of Neurology, Santa Casa de São Paulo Medical School, São Paulo, Brazil
4Hospital das Clínicas da Faculdade de Medicina, University of São Paulo, São Paulo, Brazil
5Department of Neurology, Beth Israel Deaconess Medical Center, Harvard Medical School, Boston, MA, USA
Edited by:
Andre R. Brunoni, Universidade de São Paulo, Brazil
Reviewed by:
Kátia K. Monte-Silva, Federal University of Pernambuco, Brazil Pedro Shiozawa, Santa Casa de Misericórdia de São Paulo, Brazil *Correspondence:
Felipe Fregni , Laboratory of Neuromodulation, Spaulding Rehabilitation Hospital, 125 Nashua Street #727, Boston, MA 02114, USA. e-mail: fregni.felipe@
mgh.harvard.edu;
http://neuromodulationlab.org/
†Marcel Simis and Debora Duarte
Macea have contributed equally to this work.
Introduction/Objectives:
Repetitive transcranial magnetic stimulation (rTMS) and
tran-scranial direct current stimulation are two powerful non-invasive neuromodulatory
thera-pies that have the potential to alter and evaluate the integrity of the corticospinal tract.
Moreover, recent evidence has shown that brain stimulation might be beneficial in stroke
recovery. Therefore, investigating and investing in innovative therapies that may improve
neurorehabilitative stroke recovery are next steps in research and development.
Partic-ipants/Materials and Methods:
This article presents an up-to-date systematic review
of the treatment effects of rTMS and tDCS on motor function. A literary search was
con-ducted, utilizing search terms “stroke” and “transcranial stimulation.” Items were excluded
if they failed to: (1) include stroke patients, (2) study motor outcomes, or (3) include
rTMS/tDCS as treatments. Other exclusions included: (1) reviews, editorials, and letters,
(2) animal or pediatric populations, (3) case reports or sample sizes
≤2 patients, and (4)
primary outcomes of dysphagia, dysarthria, neglect, or swallowing.
Results:
Investigation
of PubMed English Database prior to 01/01/2012 produced 695 applicable results.
Stud-ies were excluded based on the aforementioned criteria, resulting in 50 remaining studStud-ies.
They included 1314 participants (1282 stroke patients and 32 healthy subjects) evaluated by
motor function pre- and post-tDCS or rTMS. Heterogeneity among studies’ motor
assess-ments was high and could not be accounted for by individual comparison. Pooled effect
sizes for the impact of post-treatment improvement revealed consistently demonstrable
improvements after tDCS and rTMS therapeutic stimulation. Most studies provided limited
follow-up for long-term effects.
Conclusion:
It is apparent from the available studies that
non-invasive stimulation may enhance motor recovery and may lead to clinically
meaning-ful functional improvements in the stroke population. Only mild to no adverse events have
been reported. Though results have been positive results, the large heterogeneity across
articles precludes firm conclusions.
Keywords: transcranial direct current stimulation, repetitive transcranial magnetic stimulation, stroke, motor, transcranial magnetic stimulation, noninvasive brain stimulation
INTRODUCTION
Stroke is a leading cause of disability in the United States.
Accord-ing to the American Heart Association, over 795,000 people
expe-rience strokes annually in the USA, with 185,000 presenting as
recurrent strokes. Restitution of post-stroke motor function is
fre-quently incomplete, with the majority of stroke patients unable to
perform professional duties or activities of daily living by 6 months
after their stroke. This becomes a self-fulfilling cycle of disability,
as the decreased functional capacity predisposes toward
decon-ditioning (or decreased physical activity) resulting in worsening
cardiovascular disease and subsequent strokes (
Hankey et al., 2002
;
Ivey et al., 2006
).
The better understanding of plastic (or brain remodeling)
changes following stroke have contributed to the development
of novel targeted therapies that can modulate neuroplasticity,
especially non-invasive methods such as transcranial magnetic
stimulation (TMS) and transcranial direct current stimulation
(tDCS).
One important finding is the notion that plasticity is not always
adaptive. Therefore, therapies that block any potential
maladap-tive plasticity may be desirable. Specifically, several studies show
the influence of maladaptive plasticity in sustaining behavioral
deficits in stroke. For instance, neuroimaging analyses of stroke
subjects have noted critical increases in cortical excitability in the
intact primary motor cortex (M1) of the unaffected hemisphere
(
Hummel and Cohen, 2006
), and this increased cortical
excitabil-ity has been noted to correspond with movements of the paretic
arm in patients with motor impairment (
Calautti and Baron, 2003
;
Adeyemo et al. Systematic review noninvasive brain stimulation
Ward et al., 2003
). In addition, the level of cortical excitability of
the intact hemisphere directly correlates with the level of paresis in
the affected extremity (
Hummel and Cohen, 2006
). Furthermore,
post-stroke subjects exhibited changes in motor cortical
excitabil-ity and abnormal levels of inter-hemispheric inhibition from the
unaffected to the affected motor cortex (
Hummel and Cohen,
2006
). These observations have helped to develop the idea that
there is maladaptive inter-hemispheric competition after stroke,
which worsens hand paresis. Therefore, blocking or reducing
mal-adaptive plasticity with neuromodulation techniques may be a
desirable therapy as preliminary studies have shown. On the other
hand, facilitatory stimulation may be provided to the affected
hemisphere to enhance beneficial plasticity and improve motor
outcomes (
Hummel and Cohen, 2006
).
Non-invasive procedures such as TMS and tDCS are elegant
and powerful neuromodulatory techniques that create electric
cur-rents in the brain to change cortical excitability (
Hummel and
Cohen, 2006
). TMS is a technique that induces a short electric
pulse on the brain tissue via a varying magnetic field induced by the
TMS coil, while tDCS reversibly polarizes brain regions through
topical application of weak direct currents (
Hummel and Cohen,
2006
). Repetitive transcranial magnetic stimulation (rTMS) is a
technique that provides continuous electric pulses on the brain in
order to produce long-term changes in cortical excitability. Due to
the relative focal target ability, safety profile, relative low cost, and
positive preliminary results, these techniques have been extensively
tested for the treatment of stroke.
In fact, recent studies have demonstrated that cortical brain
stimulation achieved through invasive and non-invasive
tech-niques improves motor function in stroke subjects. Small phase II
trials have demonstrated that motor cortex stimulation with
non-invasive techniques, rTMS and tDCS, can enhance motor function
in stroke subjects significantly. The goal of this systematic review is
to discuss the parameters of stimulation, clinical trial design
char-acteristics, and evidence of effects from the available literature in
the field. We (this research team) therefore reviewed clinical
stud-ies of rTMS and tDCS for motor recovery in stroke published in
English from January 1st of 2002 to January 1st of 2012. We chose
the period of 10 years in order to consider the most recent
stud-ies. We present our findings in the light of the state of the science
and provide considerations and recommendations, with the aim
of providing guidance for future studies.
METHODS
LITERATURE REVIEW
The first step of our systematic review was to perform a literature
search utilizing the PubMed research database. Search strategy
was implemented on PubMed to achieve higher standardization
of results (
Wong et al., 2006
). In addition, we examined
refer-ence lists of the retrieved articles and consulted experts in the
field. We performed a literary search utilizing the search terms
“stroke” and “transcranial stimulation,” prior to (but not
includ-ing) 01/01/2012, which resulted in 695 articles. Individual search
terms were used instead of mesh terms in order to increase the
number of results retrieved. We added the search term “motor”
to our search, which produced 513 articles. We further
eluci-dated the results by performing two sub-search inclusions: (1) the
first added the key search terms “repetitive”; (2) while the other
added the search term “direct,” resulting in 142 articles and 74
articles, respectively. We also cross-reference checked by using the
terms “neurostimulation” and the acronyms “rTMS” and “tDCS”
in lieu of their spelled-out counterparts. We found a total of 201
articles related to the use of repetitive transcranial current
stim-ulation or tDCS in stroke patients to evaluate motor outcomes.
We subsequently checked each article according to our inclusion
criteria.
SELECTION CRITERIA
We included prospective studies that evaluated the effects of a
treatment with rTMS and tDCS on the motor rehabilitation of
patients with non-hyperacute strokes. We adopted the following
inclusion criteria: (1) articles written in English; (2) non-invasive
brain stimulation techniques (rTMS and tDCS) for the recovery
of motor impairments in patients with non-hyperacute stroke; (3)
use of scales to measure motor recovery; (4) studies published in
a book, journal, proceeding, or indexed abstraction; (5) studies
reporting the motor recovery scale before and after the treatment;
(6) studies published with the 10-year period; and (7) treatments
that included neuromodulation techniques as the main strategy
to treat motor impairments in stroke. Items were excluded if they
failed to (1) include stroke patients, (2) study motor outcomes, or
(3) include rTMS/tDCS as treatments. Other exclusions included
(1) reviews, editorials, or letters (2) animal or pediatric
popula-tions, (3) case reports or sample sizes
≤
2 patients, (4) primary
outcomes of dysphagia, dysarthria, neglect, or swallowing.
DATA EXTRACTION
The data were extracted by two authors (Bamidele O. Adeyemo
and Debora Duarte Macea), using a structured form, and checked
by another author (Marcel Simis). The following variables were
extracted: (1) mean and SD of motor scales before and after
treat-ment and at follow-up (when available) for the active and control
groups; (2) demographic, clinical, and treatment characteristics
(e.g., number of patients in the control and treatment groups, age,
gender, baseline characteristics, region of stroke, type of stroke,
post-injury duration, stroke severity, history of previous stroke,
baseline motor function, and strength/spasticity); (3)
interven-tion protocol type; (4) rTMS stimulainterven-tion parameters (TMS type,
target muscles, type of coil, frequency, intensity-%motor
thresh-old, number of stimuli per train, inter-train interval, and number
of trains); (5) tDCS stimulation parameters [intensity, duration,
location, electrode (info and size)]; (6) concomitant treatments
(therapy and medications); (7) methods of assessment; and (8)
evaluation model and design. When a study did not report the
SD for motor outcomes, we deduced them from other parameters,
contacted the authors, or made note as to their availability.
QUANTITATIVE ANALYSIS AND STATISTICAL ANALYSIS
Adeyemo et al. Systematic review noninvasive brain stimulation
as an appraisal of the effect size, which was calculated by
com-paring pre and post-treatment mean changes of the treatment
groups. Subsequently, we computed the pooled weighted effect
size (weighted by the inverse variance of each study), utilizing
random and fixed effect models. The random effect model lends
relatively more weight to smaller studies and wider confidence
intervals than the fixed effect model.
We also assessed publication bias utilizing the Begg-modified
funnel plot. This figure plotted the standardized mean difference
of each plot on a logarithmic scale against the respective standard
error per study. We also applied the Egger’s test to evaluate for
any significant asymmetry. The Egger test helps identify
publica-tion bias as follows: in scenarios where the effects from the smaller
studies differ from the effects reported in the larger studies, the
regression line will fail to run through the origin. This might
indi-cate publication bias where smaller studies with negative results
are not published (
Egger et al., 1997
).
RESULTS
Our study includes 10-year data prior to 01/01/2012 of
random-ized clinical trials, assessing 1314 subjects (1282 stroke patients
and 32 healthy subjects). The results of this systematic review
sug-gest that the use of non-invasive brain stimulation interventions
in patients with stroke are associated with improvements in motor
outcomes both individually and when compared to placebo
stim-ulation. The 50 studies showed a large variability in the type of
assessments that were used, the study population, the etiology and
characteristics of the stroke, and time of intervention.
STUDIES RETRIEVAL
Keyword searches on the PubMed database yielded 695 citations.
Using our study criteria, we narrowed the list to 201 citations.
Using our inclusion criteria, 50 articles met all our criteria and
were analyzed in our review. Keyword searches on the PubMed
database yielded 695 citations. Using our study criteria, we
nar-rowed the list to 201 citations. Using our inclusion criteria, 50
articles met all our inclusion criteria and were analyzed in our
review. References were excluded for (1) being non-English
(nar-rowing to 201 citations) (2) editorial/s, review/s, letters, animal,
pediatric, case reports, dysphagia, dysarthria, neglect, or
swallow-ing (narrowswallow-ing to 131 citations) (2) includswallow-ing the term repetitive
but not related to rTMS (117 citations remaining) (3) use pain
rather than motor outcomes (107 remaining citations) (4) employ
theta burst or Hebbian montage (101 remaining citations) (4)
not studying stroke subjects or having publication dates prior to
01/01/2012, totaling 50 meeting inclusion criteria.
DEMOGRAPHIC FINDINGS
Aggregation of participant data demonstrated a total of 1282
stroke patient participants (37% women) and the average per
study was 26.04 participants. The average age of the participants
was 58.46 (range of 18–95) years. (Note: the article,
Lomarev et al.
(2007)
was not included in the average because it did not provide
the necessary data to calculate average.) Demographic findings of
these studies are summarized in
Table 1
.
The number of studies seemed to be stable over this 10 year
period (with an average of 4.9 studies per year), though it appears
that there was an increase in the last 2 years (2010 and 2011) with a
peak of 13 studies. The methodological quality of the articles was
assessed utilizing the Oxford quality scoring system (Jadad scale).
Scores range from 0 to 3 and are listed in
Table 1
(
Jadad et al.,
1996
;
Olivo et al., 2008
).
The average of the stroke duration (time after stroke) of the
patients in the selected articles was 33.03 months. The individual
values are represented in
Table 1
. Most of the articles included
patients in the chronic stroke phase. There are six articles (
Hesse
et al., 2007, 2011
;
Dafotakis et al., 2008
;
Kim et al., 2010b
;
Sasaki
et al., 2011
;
Conforto et al., 2012
) that included subacute stroke
phase and four articles (
Liepert et al., 2007
;
Khedr et al., 2009,
2010
;
Chang et al., 2010
) that were conducted in acute phase of the
stroke. Other demographic characteristics are included in
Table 1
.
STROKE CHARACTERISTICS
We identified two articles that did not specify when the
stimula-tion was applied regarding the time course of the stroke (
Pomeroy
et al., 2007
;
Nowak et al., 2008
). Most of the studies administered
stimulation during the chronic phase, rather than acute or
suba-cute. One issue here is the definition of chronic stroke that is not
well defined, which is discussed further below. The selected studies
included ischemic stroke only (49.0%), both ischemic and
hemor-rhagic stroke, or did not specify the type of stroke (as summarized
in
Table 1
).
The predominant location of the stroke was cortical and
sub-cortical [28 (56.0%)]; followed by subsub-cortical only [15 (30%)],
cortical, subcortical, and brain stem [4 (8.2%)], subcortical and
brain stem [2 (4.1%)], and one article (2.9%) did not specify the
location. There were no articles reporting patients with bilateral
lesions.
Most of the studies included a heterogeneous population either
including the full spectrum of severity (mild to severe – 11 studies
(22.4%) or at least two of the three categories (mild to moderate or
moderate to severe). In four articles, it was not possible to classify
the severity (
Richards et al., 2006
;
Lomarev et al., 2007
;
Pomeroy
et al., 2007
;
Kakuda et al., 2011b
;
Chang et al., 2012
;
Stagg et al.,
2012
).
ADJUVANT THERAPIES
Different types of therapies associated with the neuromodulation
techniques as main intervention were used. The main therapies
were Constraint Induced Movement Therapy (CIMT), robotic,
and standard therapy (unspecified). They are listed in
Tables 3
and
4
.
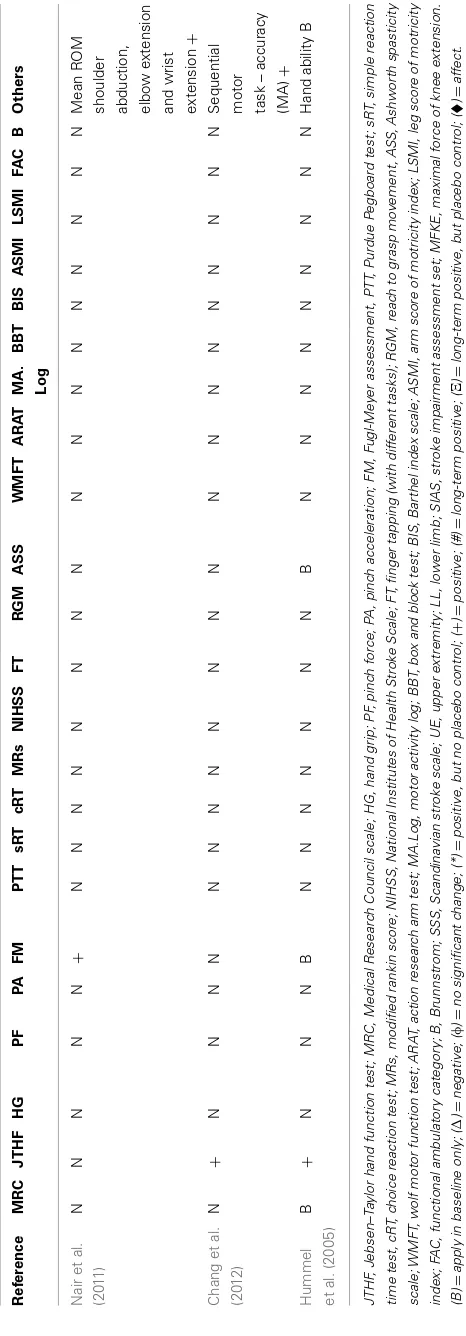
MOTOR OUTCOMES
Different study designs and assessments employed in the
eval-uation of post-stroke motor function were used. The outcomes
addressed the following: (1) motor function only; (2) safety and
motor function; (3) motor function and fMRI data; (4) motor
function and therapy; (5) motor function, fMRI, and therapy;
and (6) motor function and voluntary muscle contraction.
Specif-ically, we categorized all of the articles in
Table 2
according to
the motor assessment tool used. We also indicated which results
were reported to be statistically significant. The articles assessed
for motor strength, dexterity, range of motion, and disability. This
information is delineated in
Table 2
.
A
de
yemo
et
al.
S
ystematic
re
vie
w
nonin
vasiv
e
brain
stimulation
Table 1 | Baseline demographic characteristics of all selected peer-reviewed articles.
Reference Number of subjects
Age-mean Age-SD Cortical/ subcortical
Hemorrhagic versus ischemic
Stroke severity (mild/mod/severe)
Females (%)
Stroke duration (months)
Oxford quality scoring system
Werhahn et al. (2003)
General: 20 stroke; 10 healthy
61.5 13.6 5 Cortical; 14
subcortical (2 in pons); 1 corticosubcortical
Ischemic Mixed based MRC (1–4) 30% Healthy
40%
74.40 1
Takeuchi et al. (2005)
20 59 9.6 20 Subcortical Ischemic Mixed. Based FM (25–100) 25% 26.95 2
Mansur et al. (2005)
10 stroke; 6 healthy
53.3 X 3 Cortical and 7
subcortical
Ischemic Mixed, hemiparesis 1 subtle/4 mild/3 moderate/1 severe/1 not specified (2 least excluded)
70% X 1
Khedr et al. (2005)
52 52.85 rTMS group:
9.5; sham group: 8.4
Cortical 15; subcortical 26; corticosubcortical 11
Ischemic Moderate to severe based NIHSS 31% 7.20 0
Fregni et al. (2005)
6 53.7 16.60 Cortical 1; subcortical
3; corticosubcortical 2
NA Mild to moderate based on MRC (3.5–4.5) 67% 27.10 1
Fregni et al. (2006)
15 57.7 11.27 2 Cortical/13
subcortical
Ischemic Mild to moderate motor deficit 27% 44.05 2
Lotze et al. (2006)
7 Stroke; 7 healthy
63.7 8.6 Subcortical Ischemic Severely paretic or even hemiplegic at their
first day after stroke, four in their left hand and three in their right hand. Almost complete recovery of motor function
14% 33.90 0
Hummel and Cohen (2006)
11 57 16.00 Mostly subcortical ischemic Severe upper arm motor paresis (below
MRC grade 2). Some of them remained unable to complete the Jebsen–Taylor Test
55% 41.80 2
Richards et al. (2006)
19 60.12 15.1 Cortical, subcortical,
and brain stem
Ischemic and hemorrhagic
Mixed WMTF 19.17 (SD: 18.8) 8 81.60 3
Kim et al. (2006)
15 53.5 4.5 Cortical 5 and
subcortical 10
3
Hemorrhagic, 12 ischemic
Mild to moderate rankin (1–3) 13% 16.70 1
Liepert et al. (2007)
12 63 11 Subcortical 12(2 pons) NA Mild based MRC (4) 33% 0.24 1
Lomarev et al. (2007)
7 X X 2 Subcortical 5
corticosubcortical
I:6×H:1 Sufficient residual motor function in the
paretic arm to perform pinch test dynamometry (range 25.1–31.0 lb). Patients unable to extend at the
metacarpophalangeal joints at least 10–20˚ were also excluded from the study
29% X 0
(Continued)
F
rontiers
in
Psy
chiatry
|Neuropsy
chiatric
Imaging
and
Stimulation
No
vember
20
1
2
|V
olume
3
|Article
A
de
yemo
et
al.
S
ystematic
re
vie
w
nonin
vasiv
e
brain
stimulation
Table 1 | Continued
Reference Number of subjects
Age-mean Age-SD Cortical/
subcortical
Hemorrhagic versus ischemic
Stroke severity (mild/mod/severe)
Females (%)
Stroke duration (months)
Oxford quality scoring system
Malcolm et al. (2007)
19 67 6.8 NA/NA/mixed(11
MCA; 7 lacunar; 1 unlisted);
cortico+subcortical 1
Hemorrhagic; 18 ischemic
Mixed based WMFT 15.5±13.1 rTMS; 35.5±33.9 sham
42%, 8 45.60 2
Hesse et al. (2007)
10 63.3 X 8 Cortical; 2
subcortical
Ischemic Severe arm paresis 70% X 3
Boggio et al. (2007)
9 57.4 12.9 Subcortical NA Mild-moderate based on MRC (3.7–4.8) 22% 40.90 1
Pomeroy et al. (2007)
27 74.8 12.71 Cortical 8; subcortical
17; corticosubcortical 2
Ischemic Had upper limb weakness due to the stroke but able to produce at least a voluntary twitch of paretic biceps and/or triceps
67% 0.89 3
Nowak et al. (2008)
15 460,667 8.03 15 Subcortical Ischemic Mild based MRC (4–5) 27% 1.93 1
Takeuchi et al. (2008)
20 62.3 8.04 Subcortical Ischemic Mixed. based FM (33–91) 20% 29.90 2
Dafotakis et al. (2008)
12 45 9.00 Subcortical Ischemic Mild based MRC (4–5) 33% 1.88 0
Mally and Dinya (2008)
64 57.6 10.8 Cortical – large
hemispheric lesion
46 Ischemic, 18
hemorrhagic
Severe 42% 129.60 0
Yozbatiran et al. (2009)
12 67 12.00 Cortical 1; subcortical
11
Ischemic, or hemorrhagic but not subarachnoid
(1) Arm motor FM score 15–55 out of 66. (2) moderate–severe arm motor deficits
17% 4.10 0
Ameli et al. (2009)
29 56 13.00 Cortical 13; subcortical
16
Ischemic Mild-moderate 45% 5.50 0
Khedr et al. (2009)
36 57.9 11.00 Cortical 19 and
subcortical 17
Ischemic Mild to moderate 47% 0.57 1
Takeuchi et al. (2009)
30 59.3 12.4 Subcortical Ischemic Mixed based FM 27% 28.80 2
Kakuda et al. (2010b)
15 55 17 Subcortical 3 (1 pons);
corticosubcortical 2
Hemorrhagic 9×ischemic 6
Moderate to severe based FM (17–57) 33% 57.00 0
Grefkes et al. (2010)
11 46 9.3 Subcortical Ischemic Mild based MRC (4–5) 18% 1.91 1
(Continued)
www
.fr
ontiersin.or
g
No
vember
20
1
2
|V
olume
3
|Article
88
|
A
Table 1 | Continued Reference Number of
48 59.52 13.1 Cortical 13;
Subcortical 35
Ischemic Mixed based NIHSS 50% 0.22 2
Emara et al. (2010)
60 53.9 X Cortical 22;
Subcortical 38
Ischemic Mild to moderate hand weakness 33% 4.16 1
Lindenberg
Ischemic Severe based FM (20–56) 20%/30% (sham)
35.40 3
Chang et al. (2010)
28 56.6 12.2 Cortical 11; subcortical 17 (6 pons, 2 medial medullar)
Ischemic Mixed; mild to severe 39%; 11 0.45 2
Kim et al. (2010b)
18 57.8 X Cortical 5; subcortical
9; corticosubcortical 4
Ischemic Mixed based MRC (2–5) and FM (16–60) 5 0.85 3
Kakuda et al. (2010a)
5 66.8 X subcortical 1
Hemorrhagic, 4 ischemic
Mild to moderate rankin (1–3) 2 36.60 0
Koganemaru
Subcortical (1 pons) Ischemic 7; hemorrhage 2
Mixed based: Stroke Impairment Assessment Set (SIAS)
55%, 5 (both) 24.00 1
Kakuda et al. (2011b)
39 56.5 16.0 Not specified H:23 (59); I: 16 (41)
NA (FM 36 average) 23% 50.30 0
Kakuda et al. (2011d)
52 57 13 Cortical and
subcortical
Hemorrhagic 30×ischemic 22
Brunnstrom Stage 3–5 14 (27%) 52.40 0
Kakuda et al. (2012)
204 58.5 13.4 Cortical and
subcortical
hemorrhagic 107×ischemic 97
Brunnstrom Stage 3–5 73 (36%) 60.00 0
Sasaki et al.
Not mentioned 4 (23.5%) 37.90 1
Kakuda et al. (2011c)
11 61 13.7 Subcortical hemorrhage 7;
Ischemic 4
Brunnstrom Stage 3–5 5(45.4%) 69.90 0
A
Table 1 | Continued
Reference Number of
Not mentioned Lower extremity Fugl-Meyer 21–30 (maximum score 32)
4(44.4%) 130.80 0
Tanaka et al. (2011)
8 59.6 3.9 Subcortical Not mentioned Mixed based SIAS 4(50%) 21.10 1
Kakuda et al. (2011a)
5 61 56–66 Subcortical Hemorrhage 4;
ischemic 1
Brunnstrom Stage 3–5 2(40%) 64.00 1
Avenanti et al.
Mild severity based on inclusion criteria 47% 31.47 3
Bolognini et al. (2011)
14 46.71 14.08 Cortical 9;
corticosubcortical 5
Ischemic 12; hemorrhagic 2
Moderate to severe hemiparesis, per Fugl-Meyer (Stroke duration 35.21±26.45)
64% 35.21 2
Ischemic Mixed; mild to sever per NIHSS (range 1–11) and FM (50–123)
40% 0.92 3
Ischemic Severe per Upper extremity FM (7.8±3.8 anodal tDCS, 7.9±3.4 cathodal tDCS, 8.2±4.4 sham; Stroke duration in weeks 3.4±1.8 anodal tDCS, 3.8±1.4 cathodal tDCS, 3.8±1.5 sham)
39% 0.93 3
Mahmoudi et al. (2011)
10 60.8 14.1 Cortical 7, subcortical
3
Ischemic Mild to moderate deficit (based on patients’ ability to perform all items of
Jebsen–Taylor Test (JTT) 30% 8.30 1
Nair et al.
NA Moderate to severe upper extremity impairment [per upper extremity Fugl-Meyer of 30.1 (±10.4)]
36% 30.50 2
6 62.2 7.56 Subcortical Ischemic Mild (MRC4.8±0.03) 33% 44.30 1
The phrases ‘X’ and NA denote unavailable information.
A
de
yemo
et
al.
S
ystematic
re
vie
w
nonin
vasiv
e
brain
stimulation
Table 2 | Inventory of motor assessment tools and reported outcome in selected transcranial Stimulation articles.
Reference MRC JTHF HG PF PA FM PTT sRT cRT MRs NIHSS FT RGM ASS WMFT ARAT MA. Log
BBT BIS ASMI LSMI FAC B Others
Fregni et al. (2006)
B #+ N N N N #+ #+ #+ N N N N N N N N N N N N N N N
Takeuchi et al. (2005)
N N N φ + N N N N N N N N N N N N N N N N N N N
Mansur et al. (2005)
N N N N N N + + + N N φ N N N N N N N N N N N N
Werhahn et al. (2003)
B N N N N B N ∆ N N N N N N N N N N N N N N N
Nowak et al. (2008)
B N N N N N N N N B B + + N B N N N N N N N N N
Takeuchi et al. (2008)
N N N #+ #+ B N N N N N N N N N N N N N N N N N N
Dafotakis et al. (2008)
B N N + + N N N N B B N N N N B N N N N N N N N
Kakuda et al. (2010b)
N N N N N N N N N N N N * * N N N N N N N B N
Liepert et al. (2007)
B N φ N N N φ N N N N N N N N N N N N N N N N N
Grefkes et al. (2010)
B N N N N N N N N B B N N N N B N N N N N N N Written
instructions on a monitor visible through a mirror whether to move the left, right, or both hands in the upcoming task-block (+)
Lotze et al. (2006)
B N N N N N N N N N N ∆ N N N N N N N N N N N N
Lomarev et al. (2007)
N N N φ N N N N N N N N N N N N N N N N N N N N
Malcolm et al. (2007)
N N N N N N N N N N N N N N φ N φ φ N N N N N N
Khedr et al. (2005)
N N N N N N N N N N #+ N N N N N N N #+ N N N N SSS#+
F
rontiers
in
Psy
chiatry
|Neuropsy
chiatric
Imaging
and
Stimulation
No
vember
20
1
2
|V
olume
3
|Article
A
de
yemo
et
al.
S
ystematic
re
vie
w
nonin
vasiv
e
brain
stimulation
Table 2 | Continued
Reference MRC JTHF HG PF PA FM PTT sRT cRT MRs NIHSS FT RGM ASS WMFT ARAT MA.
Log
BBT BIS ASMI LSMI FAC B Others
Khedr et al. (2010)
N N *# N N N N N N # + N N N N N N N N N N N N Shoulder
abduction #; Dorsiflexion of toes Hip flexion#; Toe dorsiflexion# (only after 1 year fir 10 Hz) Yozbatiran
et al. (2009)
N N * N N Ξ * N N N N N N N N φ N N φ N N N N Active ranges of
motion at the affected side wrist and index finger metacar-pophalangeal joint. Ameli et al.
(2009)
B N N N N N N N N B B (+)
And hand tap-ping
+
N N N B N N N N N N N N
Hummel and Cohen (2006)
B N N + N B N + N N N N N B N N N N N N N N N N
Hesse et al. (2007)
* N N N N * N N N N N N N N N N N N N N N N N N
Fregni et al. (2005)
B + N N N N N N N N N N N B N N N N N N N N N N
Emara et al. (2010)
N N N N N N N N N #+ N + N N N N N N N N N N N Activity Index
(AI) scale#+ Boggio
et al. (2007)
B #+ N N N N N N N N N N N N N N N N N N N N N
Pomeroy et al. (2007)
N N N N N N N N N N N N N N N φ N N N N N N N Peak torque
about the elbow during isotonic concentric flex-ion/extension.
(Continued)
www
.fr
ontiersin.or
g
No
vember
20
1
2
|V
olume
3
|Article
88
|
A
de
yemo
et
al.
S
ystematic
re
vie
w
nonin
vasiv
e
brain
stimulation
Table 2 | Continued
Reference MRC JTHF HG PF PA FM PTT sRT cRT MRs NIHSS FT RGM ASS WMFT ARAT MA.
Log
BBT BIS ASMI LSMI FAC B Others
Lindenberg et al. (2010)
B N N N N #+UE N N N N N N N N #+ N N N N N N N N For fMRI,
performing repetitive elbow and wrist exten-sion/flexion movements Chang et al.
(2010)
N N #+ N N (1) UE+
(2) LL
N N N N N N N N N N N φ φ #+ φ φ φ N
Kim et al. (2010b)
B N N N N # N N N B B N N N N N N N φ N N N B N
Kakuda et al. (2011b)
N N N N N Ξ* N N N N N N N Ξ* * N N N N N N N N N
Kakuda et al. (2010a)
N N N N N Ξ* N N N N N N N N Ξ* N N N N N N N B Ten seconds
test X *
Koganemaru et al. (2010)
N N (A)+
(after 30 min); (B)Ξ*
(B)Ξ *
N N N N N N N N N (A)+;
(B)Ξ*
N N N N N N N N N (A) Active range
of movement
+(B) active
range of movement X *; passive range of movement X * Richards
et al. (2006)
N N N N N N N N N N N N N N φ N N N N N N N N Motor Activity
Log.3 Kim et al.
(2006)
N N N N N N N N N N N N N N N N N N N N N N N Finger motor
task. (1) Movement accuracy (MA)
+(2) movement
time (MT)+ Khedr et al.
(2009)
N N φ N N N #+ N N N #+ #+ N N N N N N #+ N N N N Keyboard
tapping#* Takeuchi
et al. (2009)
N N N #+ #+ N N N N N N N N N N N N N N N N N N N
Mally and Dinya (2008)
N N N N N Ξ* N N N N N N N N N N N N N N N N N Score of
spasticity at rest X *
F
rontiers
in
Psy
chiatry
|Neuropsy
chiatric
Imaging
and
Stimulation
No
vember
20
1
2
|V
olume
3
|Article
A
de
yemo
et
al.
S
ystematic
re
vie
w
nonin
vasiv
e
brain
stimulation
Table 2 | Continued
Reference MRC JTHF HG PF PA FM PTT sRT cRT MRs NIHSS FT RGM ASS WMFT ARAT MA.
Log
BBT BIS ASMI LSMI FAC B Others
Kakuda et al. (2011d)
N N N N N * N N N N N N N N * N N N N N N N B N
Kakuda et al. (2012)
N N N N N Ξ* N N N N N N N N Ξ* N N N N N N N B N
Sasaki et al. (2011)
N N + N N N N N N N B + N N N N N N N N N N B N
Stagg et al. (2012)
N N (1)Φ N N N N (2) (+) N N N N N N N N N N N N N N N (1) Response
times (+); (2)
choice response time condition (Φ).
Kakuda et al. (2011c)
N N N N N * N N N N N N N N * N N N N N N N B N
Madhavan et al. (2011)
N N N N N B N N N N N N N N N N N N N N N N N Tracking a
sinusoidal
waveform (+)
Tanaka et al. (2011)
N N Φ N N N N N N N N N N N N N N N N N N N N SIAS (B);
MFKE(+)
Kakuda et al. (2011a)
N N N N N *Ξ N N N N N N N * *Ξ N N N N N N N N N
Avenanti et al. (2012)
N +# =# PG#
+;
force +
N N N N N N N N N N N N N +# N N N N N NHPT+#
Bolognini et al. (2011)
N +# + N N + N N N N N N N N N N +# N N N N N N N
Conforto et al. (2012)
N +# N + N + N N N + B N N φ N N N N N N N N N N
Hesse et al. (2011)
+# N N N N +# N N N N N N N +# N N N +# +# N N N N N
Mahmoudi et al. (2011)
N + N N N N N N N N N N N N N N N N N N N N B
(Continued)
www
.fr
ontiersin.or
g
No
vember
20
1
2
|V
olume
3
|Article
88
|
Adeyemo et al. Systematic review noninvasive brain stimulation
ADVERSE EFFECTS OF NON-INVASIVE STIMULATION
There was a large heterogeneity in the reporting of safety including
different safety assessment tools and inclusion/exclusion criteria.
There were no significant major safety events in the selected
stud-ies. Neurocognitive assessments as an index for safety were
con-ducted in only a few of the studies (
Fregni et al., 2006
;
Emara et al.,
2010
). None of the selected articles investigated mood changes
following stimulation. Some of the articles have considered
psy-chiatric illness as exclusion criteria (see Table S1 in Supplementary
Material).
No major adverse effects have been reported. The side effects
reported were tingling, headache, dizziness, itching, and increase
in anxiety. In
Fregni et al. (2006)
, one patient in the sham rTMS
group reported an increase in the tiredness and another one noted
a mild headache (
Fregni et al., 2006
).
Yozbatiran et al. (2009)
showed a change in blood pressure of
7 mm Hg when assessing the effects of rTMS. We have noticed
a variability of adverse effects in the articles. For the articles
that did not specifically mention side effect, it should be noted
absence of report does not imply absence of effect. These results
are summarized in Table S1 in Supplementary Material.
Other measures of safety were used such as
electroencephalog-raphy (EEG), which was as an exclusion criteria or a safety
out-come. Studies using EEG as outcomes showed no changes in EEG
post stimulation (Table S1 in Supplementary Material). Although
rare, some subjects had dropped out of the studies because of
adverse events. In
Lomarev et al. (2007)
, one subject dropped out
for not being able to tolerate the rTMS train at 100%. In
Kim et al.
(2010b)
, two patients discontinued treatment with tDCS; one due
to headaches and the other due to dizziness. In
Stagg et al. (2012)
,
two patients withdrew from the study before completion: one due
to claustrophobia and the other due to unrelated medical reasons.
Both were noted to be unrelated to tDCS. These results are further
listed in Table S1 in Supplementary Material.
EFFECTS OF GENDER ON BRAIN STIMULATION AND STROKE
POPULATION
There was significant variability in number of male versus female
patients in the selected articles. Information of individual analysis
of motor effect per patient gender was unavailable for
compari-son. Therefore, aggregate analysis was conducted utilizing gender
percentages (
Table 1
) per motor effect size. The mean male:female
ratio was 63:37% of stroke patients in the selected articles. The
analysis failed to find significant correlation; however there was a
slightly positive trend for increased effect size as male percentage
increased (
y
=
1.0257
x
−
0.0117.
R
2=
0.0646) and a conversely
decreased correlation of effect size where the percentage of females
were higher (
y
= −
1.0257
x
+
1.014,
R
2=
0.0646).
STIMULATION PARAMETERS AND PROTOCOL
A
de
yemo
et
al.
S
ystematic
re
vie
w
nonin
vasiv
e
brain
stimulation
Table 3 | Parameters for TDCS application parameters, placement, electrode Attributes, and employed placebo method.
Reference Intensity (mA)
Duration (min)
Number sections
Location anode
Location cathode
Electrode (info and size)
Type of placebo
Concomitant therapy or motor tasks
Hummel and Cohen (2006)
1 20 1 Motor ipsilesional side Contralateral Supraorbital 25 cm2 30 s N/A
Hesse et al. (2007)
1.5 7 30 Motor ipsilesional side Contralateral Supraorbital 35 cm2 No sham Robot-assisted arm
training Fregni et al.
(2005)
1 20 1 Ipsilesional side Or
Supraorbital
Contralesional or supraorbital 35 cm2 30 s N/A
Boggio et al. (2007)
1 20 (1) 1 and (2) 5 (1) Ipsilesional side or
supraorbital; (2) Supraorbital
(1) Contralesional side or supraorbital (2) contralesional side
35 cm2 30 s N/A
Lindenberg et al. (2010)
1.5 30 5 Motor ipsilesional side Motor contralesional side 16.3 cm2 30 s Physical and occupational
therapy Kim et al.
(2010b)
2 20 10 Ipsilesional side Or
Supraorbital
Contralesional or Supraorbital 25 cm2 60 s Conventional, physical,
and occupational therapy Stagg et al.
(2012)
1 (1) 20 (2) 10 1 session (3 total
crossover)
Motor ipsilesional side or supraorbital
Motor contralesional side or supraorbital
35 cm2 10 s (vertex) N/A
Madhavan et al. (2011)
0.5 15 1 session (3 total
crossover)
Motor ipsilesional side or contralesional (Leg)
Contralateral Supraorbital 8 cm2(anode)
48 cm2(cathode)
10 s N/A
Tanaka et al. (2011)
2 10 1 session (2 total
crossover)
Motor ipsilesional side (Leg) Contralateral Supraorbital 35 cm2(anode)
50 cm2(cathode)
15 s N/A
Bolognini et al. (2011)
2 40 10 Ipsilesional side Contralesional side 35 cm2 30 s Constraint-induced
movement therapy Hesse et al.
(2011)
2 20 30 Group A: ipsilesional side;
Group B: contralesional side; sham: A or B set-up changing consecutively
Group A: contralateral orbit; Group B: contralateral supraorbit area; Sham: A or B set-up changing consecutively
35 cm2 0 mA Robot-assisted arm
training
Mahmoudi et al. (2011)
1 20 1 session (5 total
crossover)
Bilateral tDCS group: ipsilesional side; Anodal tDCS group: ipsilesional side; Cathodal tDCS group: contralateral supraorbital area; Extra-cephalic tDCS group: ipsilesional side; Sham tDCS group
Bilateral tDCS group: contralesional side; Anodal tDCS group: Contralateral supraorbital; Cathodal tDCS group: contralesional side; Extra-cephalic tDCS group: contralateral deltoid muscle; Sham tDCS group: Not listed
35 cm2 30 s N/A
Nair et al. (2011)
1 30 5 Contralateral supraorbital area Contralesional NA Stimulation intensity
turned off at unspecified interval
Occupational therapy
Hummel et al. (2005)
1 20 2 Ipsilesional Contralateral supraorbital 25 cm2 30 s N/A
www
.fr
ontiersin.or
g
No
vember
20
1
2
|V
olume
3
|Article
88
|
A
de
yemo
et
al.
S
ystematic
re
vie
w
nonin
vasiv
e
brain
stimulation
Table 4 | rTMS parameters, application location, duration of treatment, and placebo implementation.
Reference TMS type Frequency Intensity %
motor threshold
Number of stimuli per train
Type of placebo or active control
Concomitant Therapy or motor tasks
Fregni et al. (2006) Contralesional 1 Hz 100% 1200 Sham coil N/A
Takeuchi et al. (2005) Contralesional 1 Hz 90& 1500 90˚ N/A
Mansur et al. (2005) Contralesional 1 Hz 100% 600 Sham coil N/A
Werhahn et al. (2003) (1, 2, and 4) Contralesional and Ipsilesional (3) Ipsilesional
(1) Single (2) 1 Hz; (3) 1 Hz; (4) single
(1) 130%; (2) 150%; (3) 150%; (4) 130%
(1)x; (2) 5; (3) 1800 (4)x Vertex (control stimulation) N/A
Nowak et al. (2008) Contralesional 1 Hz 100% 10 Vertex (control stimulation) N/A
Takeuchi et al. (2008) Contralesional 1 Hz 90% 1500 90˚ N/A
Dafotakis et al. (2008) Contralesional 1 Hz 100% 600 Vertex (control stimulation) N/A
Kakuda et al. (2010b) Contralesional 1 Hz 90% 1200 No sham Intensive occupational therapy (OT)
Liepert et al. (2007) Contralesional 1 Hz 90% 1200 Sham coil N/A
Grefkes et al. (2010) Contralesional 1 Hz 100% 600 Vertex (control stimulation) N/A
Lotze et al. (2006) Contralesional 20 Hz 120% 3 90˚ N/A
Lomarev et al. (2007) Ipsilesional 20 and 25 Hz 110, 120, and 130% 10 and 20 90˚ N/A
Malcolm et al. (2007) Ipsilesional 20 Hz 90% 40 Attaching surface
electrodes underneath the magnetic coils and in contact with the scalp connected to the electromyography
Constraint-induced therapy
Khedr et al. (2005) Ipsilesional 3 Hz 120% 30 Coil angled away from the
head
Continued to receive their normal therapy
Khedr et al. (2010) Ipsilesional 3 and 10 Hz (1) 130%; (2) 100% Group (1) 14, Group (2) 20
Coil angled away from the head
combination with conventional therapy
Yozbatiran et al. (2009) Ipsilesional 20 Hz 90%; and 7 patients
60% device output
40 No sham N/A
Ameli et al. (2009) Ipsilesional 10 Hz 80% 50 Vertex (control stimulation) N/A
Emara et al. (2010) Contralesional and ipsilesional side
1 and 5 Hz 80–90% ipsilesional 110–120% contralesional
(1) 750 pulses; (2) 150 pulses
90˚ received standard physical therapy
Pomeroy et al. (2007) Ipsilesional 1 Hz 120% MT 40 Sham coil Voluntary muscle contraction (real
and placebo) They were asked to flex and extend the paretic elbow and to continue to repeat or to attempt this for 5 min
(Continued)
F
rontiers
in
Psy
chiatry
|Neuropsy
chiatric
Imaging
and
Stimulation
No
vember
20
1
2
|V
olume
3
|Article
A
de
yemo
et
al.
S
ystematic
re
vie
w
nonin
vasiv
e
brain
stimulation
Table 4 | Continued
Reference TMS type Frequency Intensity %
motor threshold
Number of stimuli per train
Type of placebo or active control
Concomitant Therapy or motor tasks
Chang et al. (2010) Ipsilesional 10 Hz 90% 1000 90˚ Motor practice consisted of 50 s of
reaching and grasping exercises, which were conducted after each rTMS. Plus conventional, physical, and occupational therapy
Kakuda et al. (2011b) Contralesional 1 Hz 90% 1200 90˚ Occupational therapy
Kakuda et al. (2010a) Contralesional 1 Hz 90% 1200 No sham Occupational therapy
Koganemaru et al. (2010) Ipsilesional 5 Hz; 100% of the active motor threshold
(1) 600; (3) 7200 (1) Sham coil; (3) no sham Exercises for the extensors of the wrist and fingers
Richards et al. (2006) Ipsilesional 20 Hz 90% 2000 Surface electrodes under
the magnet sham rTMS
Constraint-induced movement therapy
Kim et al. (2006) Ipsilesional 10 Hz 80% 20 90˚ N/A
Khedr et al. (2009) Contralesional and ipsilesional side
(1) 1 Hz; (2) 3 Hz (1) 100%; (2) 130% 900 pulses Coil angled away from the head
conventional therapy
Takeuchi et al. (2009) (1) Contralesional; (2) ipsilesional; (3) bilateral
(1) 1 Hz; (2) 10 Hz; (3) 1 and 10 Hz
90% (F1) 1000; (F2) 1000;
(F3) 2000
90˚ N/A
Mally and Dinya (2008) Contralesional and ipsilesional side
1 Hz (30% of 2.3 T) 100 No sham N/A
Kakuda et al. (2011d) Contralesional 1 Hz 90% 1200 No sham Intensive occupational therapy (OT)
Kakuda et al. (2012) Contralesional 1 Hz 90% 1200 No sham Intensive occupational therapy (OT)
Sasaki et al. (2011) Contralesional or ipsilesional side
(1) 1 Hz or (2) 10 Hz 90% 1800 or 1000 90˚ N/A
Kakuda et al. (2011c) Contralesional 6 Hz (priming per 10 min)+1 Hz per 20 min
90% 600+1200=1800 No sham Intensive occupational therapy (OT)
Kakuda et al. (2011a) Contralesional 1 Hz 90% 1200 No sham Intensive occupational therapy
(OT)+Levodopa
Avenanti et al. (2012) Contralesional 1 Hz 90% 1500 pulses (1 train) 90˚ physical therapy
Conforto et al. (2012) Contralesional 1 Hz 90% 1500 pulses (1 train) 90˚ Therapies to outpatient customary
rehabilitation,
Chang et al. (2012) Ipsilesional 10 Hz 80% 50 pulses×20
trains×10 daily sessions=10,000 total
90˚ N/A
*Values for each experiment group are separated by bracketed numbers. For example, if an experiment has three groups, the information per group is listed as (1), (2), and (3), respectively.
www
.fr
ontiersin.or
g
No
vember
20
1
2
|V
olume
3
|Article
88
|
Adeyemo et al. Systematic review noninvasive brain stimulation
that demonstrated motor improvement by inhibiting the
peri-lesional region. However, it is also important to note that there
was no placebo control included here. We have summarized the
different protocols in
Tables 3
and
4.
SHAM: UTILIZATION OF PLACEBO STIMULATION
All the tDCS studies used the same type of sham procedure,
which was a brief initial stimulation to produce a tingling
sensa-tion followed by decreasing the administrasensa-tion to zero. However,
they varied by the duration of initial stimulation, which was 30
or 60 s. The protocols were primarily based on three different
strategies: the use of (1) cathodal stimulation in the unaffected
hemisphere, (2) anodal in the affected hemisphere, (3) or both
anodal and cathodal stimulation applied simultaneously. These
three strategies are based on the inter-hemispheric interaction
the-ory described above. The different rTMS parameters, stimulation
strategy, and sham type are listed in the
Table 4.
Most of the rTMS studies had used sham stimulation or active
control stimulation (77.7%), but the techniques used were
dif-ferent; especially in the type of coils and cortical targets used
(Table 4). All utilized an rTMS coil but using different approaches:
(1) active coil placed on the vertex; (2) active coil, with an angle of
application of 90˚; (3) sham coil, which induces no magnetic field.
FAILURE OF IMPROVEMENT: MOTOR OUTCOMES COMPARED TO PLACEBO
A majority of the results was positive for increased
improve-ment compared to placebo, with the exception of three articles
(Lomarev et al., 2007;
Malcolm et al., 2007;
Pomeroy et al., 2007).
For the
Lomarev et al. (2007)
study, results were mixed with
some outcomes showing positive results (Lomarev et al., 2007).
An important distinction was that the
Lomarev et al. (2007)
study
was primarily implemented to assess safety, while the
Pomeroy
et al. (2007)
study was predominantly designed to test the
feasibil-ity of the new methodology (Lomarev et al., 2007;
Pomeroy et al.,
2007).
Although the article
Werhahn et al. (2003)
also showed that
rTMS induced no improvement or worsening, this study had the
main aim of inducing a “Transient, Virtual, Reversible Lesion”
to better understanding motor recovery (Werhahn et al., 2003).
Another study showing impairment in motor function was the
Lotze et al. (2006)
study that used rTMS as interference while
assessing fMRI data. These results may be secondary to the
employ-ment of TMS for inhibition rather than facilitation of motor
networks.
MOTOR EFFECTS SIZE
In our assessment of the magnitude of effect size, we found an
overall improvement in motor outcome (Figure 1). Most of the
studies used small sample sizes. The results from the fixed effects
model revealed a significant pooled effect size of 0.584 (95% CI,
0.440, 0.729;
Figures 1
and
2). The random effects model showed
similar results 0.590 (pooled effect size, 95% CI, 0.421, 0.760).
Using the Begg and the Egger test for the analyzed trials, we found
no evidence of publication bias and the distribution of studies was
symmetrical with non-significant
p-values (Figure 3). This
sug-gests that the results are not related to a publication bias. Of note,
there were no negative results with tDCS.
LONG-TERM FOLLOW-UP
There is a subset of the selected articles that performed long-term
follow-up. The time of follow-up varied from 30 min (Takeuchi
et al., 2005) to 1 year (Khedr et al., 2010).
Khedr et al. (2010)
showed a long-term effect lasting 1 year. It is noted in this article
that the rTMS was applied in the acute phase of stroke. In the
arti-cle
Yozbatiran et al. (2009), the Fugl-Meyer (FM) did not reveal
a difference immediately post-rTMS stimulation, but showed
dif-ference 1 week later. In the article
Kim et al. (2010b), FM did not
demonstrate a difference 1 day after cathode tDCS, but showed a
difference 6 months later.
DISCUSSION
This review of the transcranial stimulation articles includes data
from 50 articles, assessing 1314 (1282 stroke patients and 32
healthy) subjects. In summary, the data suggest the use of
non-invasive brain stimulation in stroke population is associated
with improvements of motor outcomes. There was significant
heterogeneity of patient population characteristics, intervention
parameters, and selected assessments.
STUDIES RETRIEVAL
Adeyemo et al. Systematic review noninvasive brain stimulation
FIGURE 1 | Forest plot of the subset of studies with amenable and data-available for systematized comparison, with the pooled effect size for studies of transcranial stimulation on motor.
EFFECTS OF AGE ON BRAIN STIMULATION AND STROKE
In regards to age, the average age of this systematic review was
58.46, which is a low average when compared to the general stroke
population. A comparison to the other reviews of stroke in the
lit-erature reveals a meta-analysis of therapy and stroke that reports
older patient averages to be 65.3–74.7 years for their respective
treatment groups (Craig et al., 2010). Investigation of the study
design of our selected articles demonstrates that this finding is
not attributed to the inclusion/exclusion criteria or adverse events
(Table S1 in Supplementary Material). Of note, a recent review
of non-invasive stimulation established an average patient age of
58.77 (Richards et al., 2008), a report similar our age finding.
Given that certain articles have discussed safety concerns with
extremities of age, we considered whether the average age was
related to safety concerns (Quintana, 2005). Since age did not
cor-relate with safety reports in these articles. A potential explanation
is an increased utilization of new treatments in the younger stroke
population (Luker et al., 2011). This trend is substantiated by a
recent review of stroke management, where age is evidenced to be
a significant determinant of type of post-stroke care (Luker et al.,
2011). Furthermore, according to the TMS guidelines, age does
not increase the risk of adverse events in the utilization of TMS.
We analyzed the relationship between effect-size of motor
out-comes after non-invasive stimulation with age. We noticed no
correlation (r
=
0.279,
p
=
0.0984) between age and effects size
when using a linear regression model. The Pearson coefficient was
very low and the
p-value was high, which conveys a poor
associa-tion and low significance. A comparison of effect sizes of patients
above and below the median age (55.9) also failed to reveal a
significant difference in age groups and motor outcomes (Mann–
Whitney
U
-test:
p-value 0.101694, two-tailed test.) Sub-analysis of
age by rTMS and tDCS articles also failed to show a significant
dif-ference (Mann–Whitney two-tailed
U
-tests: rTMS
p
=
0.1246498,
tDCS
p
=
1). We conclude that our analysis was unable to find a
difference or association in effect sizes of motor outcomes when
analyzed by age.
Future studies would be helpful in further exploring this
con-cept of age and motor outcomes in transcranial stimulation.
Liter-ature suggests that there exists an increased level of neuroplasticity
in younger population (Pinto et al., 2012). This may be an
impor-tant consideration in transcranial stimulation of stroke patients to
determine if younger patients would experience increased motor
improvements. Some data suggests that younger patients may
experience greater improvement based upon an increased
abil-ity of the contralateral hemisphere to compensate for the stroke
lesion (Ipek et al., 2011). Studies should explore whether the level
of cerebral atrophy in the setting of older age should be a
consid-eration for analyzing age-related motor effects (Nahas et al., 2004;
Adeyemo et al. Systematic review noninvasive brain stimulation
FIGURE 2 | Assessment of the fixed effects size estimates in linear form with effect size as Cohen’sd(standard mean difference) and employing error bars to represent the 95% confidence interval.
Decarli et al., 2012
). Further studies are needed to explore fully the
relationship between age and motor outcome after transcranial
stimulation in stroke patients.
EFFECTS OF GENDER ON BRAIN STIMULATION AND STROKE
POPULATION
The analysis failed to find significant correlation; however there
was a slightly positive trend for increased effect size as male
per-centage increased and a conversely decreased correlation of effect
size where the percentage of females were higher. In
compari-son with the literature, a study on chronic tinnitus with tDCS
demonstrated an opposite trend with females improving more
than males (
Frank et al., 2012
). Another study in tDCS on
behav-ior modification and reasoning also found an increased effect in
women (
Fumagalli et al., 2010
). Furthermore, a study of
tem-poral cortex tDCS on its effects on facial expression recognition
also noticed increased effects and modulation of the cortex with
females (
Boggio et al., 2008
).
Overall, the findings of this review did not provide sufficient
information to draw definitive conclusions on the effects of
gen-der. Results may be related to statistical sampling and analysis.
An explanation for why the results failed to find increased effects
with female-predominant articles is that the findings are masked
by the uniqueness of stroke epidemiology compared to the other
diseases studied in other articles. As described above, the average
patient age of this study was 57. According to the AHA, men tend to
have more strokes at an earlier age than women do (
Lloyd-Jones
et al., 2009
). Ergo, one would expect fewer females in our
arti-cles. This decreased number of females may be relatively too few
(in comparison to the male patients) to demonstrate a
preferen-tial improvement in motor outcome. This epidemiological trend
of more males than females is supported in this review’s high
male:female ratio of 63:37%. The variability in number of male
versus female patients in these articles may also be due to
vary-ing recruitment or level of desire/comfort with neuromodulation
treatment. Once again, it should also be emphasized that there are
no contraindications against non-invasive stimulation for either
gender (
Rossi et al., 2009
). Further studies should assist in
delin-eating this effects of stimulation in gender, as some articles report
there is a differential effect (
Knops et al., 2006
;
Boggio et al., 2008
;
Chaieb et al., 2008
). This information may prove paramount in
helping to individualize stimulation treatment.
THE IMPACT OF THE CHRONICITY OF STROKE ON THE RECOVERY OF
MOTOR FUNCTION
Adeyemo et al. Systematic review noninvasive brain stimulation
FIGURE 3 | Funnel plot representing publication bias assessment of the effect sizes (Cohen’sd) by accounting for their standard errors.The pooled effect size is represented by the horizontal solid line.
The 94% confidence interval expected for each is represented by the diagonal lines. (Of note, this graph assumes no heterogeneity between studies.)