August 2014 121 *Corresponding author:
E-mail: [email protected]; [email protected]
Methane Mitigation and Microbial Diversity of Silage Diets Containing
Calliandra
calothyrsus
in a Rumen
in Vitro
Fermentation System
R. Ridwana,b,*,#, I. Rusmanac,*,#, Y. Widyastutib, K. G. Wiryawand,#, B. Prasetyab, M. Sakamotoe, & M. Ohkumae
aStudy Program of Microbiology, Graduate School, Bogor Agricultural University bResearch Center for Biotechnology, Indonesian Institute of Sciences
Jln. Raya Bogor Km. 46 Cibinong 16911, Indonesia
cDepartment of Biology, Faculty of Mathematics and Natural Sciences, Bogor Agricultural University dDepartment of Animal Nutrition and Feed Technology, Faculty of Animal Sciences, Bogor Agricultural University
#Jln. Agatis, Kampus IPB Darmaga, Bogor 16680, Indonesia
eJapan Collection of Microorganisms RIKEN BioResource Center Tsukuba-Ibaraki, Japan
(Received 19-05-2014; Reviewed 23-06-2014; Accepted 29-07-2014)
ABSTRACT
This study was conducted to investigate the efects of silage based diets on methane (CH4) mitiga-tion and microbial diversity in a rumen in vitro fermentation. The experiment was arranged in a com-pletely randomized design with ive treatments and three replications. The dietary treatments consisted of varying levels of silage containing 50% Calliandra calothyrsus as follows K; 100% concentrate + pure tannic acid of 1 mg/mL, R1; 25% silage + 75% concentrate, R2; 50% silage + 50% concentrate, R3; 75% silage + 25% concentrate, and R4; 100% silage. The fermentation variables measured were total gas, CH4, in vitro organic mater digestibility (IVOMD), VFAs, pH, N-NH3, number of protozoa, and microbial diversity analysis. Increasing level of silages reduced total gas production, CH4 concentration, IVOMD, index of bacterial diversity, protozoal number, total methanogens and Methanobacteriales population. Diet with 25% to 50% silage decreased CH4 concentration, total gas production and IVOMD by 11.43%, 24.92%, and 18.73%, respectively. Ammonia N and VFAs (except butyrate and valerate) were signii -cantly reduced (P<0.01) by increasing level of silages in the ration. In conclusion, this study conirmed that 50% silage containing C. calothyrsus was eicient in mitigation of enteric CH4 production by reduc-ing total methanogens and Methanobacteriales number, but had negative efect on decreasreduc-ing bacterial diversity and organic mater digestibility.
Key words: Calliandra calotyhrsus, silage, rumen fermentation, methane, microbial diversity
ABSTRAK
Penelitian ini dilakukan untuk mengevaluasi pengaruh pakan silase yang mengandung 50%
Calliandra calothyrsus pada mitigasi metan (CH4) dan keragaman mikroba dalam fermentasi rumen secara in vitro. Penelitian ini menggunakan rancangan acak lengkap dengan 5 perlakuan dan 3 ulangan. Perlakuan terdiri atas K; 100% konsentrat + asam tanat murni (1 mg/ml), R1; 25% silase + 75% konsen -trat, R2; 50% silase + 50% konsen-trat, R3; 75% silase + 25% konsen-trat, dan R4; 100% silase. Variabel fer -mentasi yang diukur terdiri atas total gas, konsentrasi CH4, kecernaan in vitro bahan organik (IVOMD), VFAs, pH, N-NH3, jumlah protozoa, dan analisis keragaman mikroba rumen. Hasil penelitian menun -jukkan peningkatan level silase menurunkan produksi gas total, konsentrasi CH4, IVOMD, indeks keragaman bakteri, jumlah protozoa, populasi metanogen dan Methanobacterales. Penggunaan silase 25%-50% menurunkan CH4, gas total dan IVOMD secara beurutan sebesar 11,43%, 24,92%, dan 18,73%. Nitrogen ammonia dan VFAs (kecuali butirat and valerat) secara nyata (P<0,01) mengalami penurunan dengan meningkatnya level silase yang digunakan. Penelitian ini menegaskan bahwa penggunaan 50% pakan silase yang mengandung C. calothyrsus eisien dalam mitigasi enterik CH4 dengan menurunkan jumlah metanogen dan Methanobacteriales, tetapi masih memiliki pengaruh negatif terhadap penu-runan keragaman bakteri dan kecernaan bahan organik.
Kata kunci: Calliandra calothyrsus, silase, fermentasi rumen, metan, keragaman mikroba
INTRODUCTION
The most limiting factors in feeding catle with
forage are digestibility and nutrient quality. Protein
deiciency is the most important factor leading to low performance of ruminants fed low quality forages.
Calliandra calothyrsus preserved in silage is an alterna-tive method for improving crude protein (CP) contents of feeds for sustainable ruminant production. The CP supplies N-protein for microbial protein synthesis in the rumen. Manipulation of the rumen microbial ecosystem
for enhancing iber digestibility, reducing methane
(CH4) production and improving animal performance are high priority goals for ruminant nutrition (Lopez et al., 2010).
The C. calothyrsus contains high levels of condensed tannins. Condensed tannins are polymeric
proanthocy-anidins, composed of lavonoid units (Bhat et al., 1998).
Tannins have a capacity to form complexes with proteins
including proteolytic enzymes, thus reducing nutrient degradation (Kamra et al. 2012; Jayanegara & Sofyan, 2008). The reactive nature of tannins in feeds indicates that they could be used in nutritional strategies to re-duce CH4 emissions from ruminants in tropical regions (Tiemann et al., 2008; Jayanegara et al., 2011a).
However, CH4 is a potent greenhouse gas, which
contributes to global warming (Patra, 2014; Bodas et
al., 2012). Ruminants are considered as one of the high contributors to atmospheric pollution by enteric fermen-tation (Patra, 2014; Ji & Park, 2012). The CH4 is produced
normally in the rumen by methanogens, of which the
major substrates such as CO2 and H2 are supplied by
protozoa, fungi, and bacteria during fermentation of the feed. Enteric CH4 production in ruminant has been
intensively studied, and the beneicial efect of tan
-nin to reduce CH4 emission has also been reported by several authors (Tiemann et al., 2008; Jayanegara et al., 2009, 2011a, b, c, 2013; Patra & Saxena, 2010; Castro-Montoya et al., 2011). However, microbial interactions
with tannins and the mechanism of CH4 mitigation in
the rumen are still unclear. Molecular approaches based on 16S rDNA of terminal restriction fragment length polymorphisms (T-RFLP) has been applied to
investi-gate microbial diversity from diferent ecosystems (Liu
et al., 1997; Blackwood et al., 2007) and for quantifying members of microbial communities using quantitative real rime-PCR (qPCR) (Bustin et al., 2009). The objective
of this study was to evaluate the efectiveness of silages
diet containing C. calothyrsus on CH4 mitigation and mi-crobial diversity in a rumen in vitro fermentation using the Hohenheim Gas Test (HGT).
MATERIALS AND METHODS
Preparation of Silage
Silage was made from our previous work and was chosen with the best quality silage (under process of publication). Grass-legumes silages were made by
using wilted king grasses(Pennisetum purpureum hybrid)
and C. calothyrsus (Fabaceae; red lower) legumes with
combination of 50%:50% (w/w). Grasses and legumes
were chopped to the lengths of approximately 3-5 cm.
Ready available carbohydrate (10%) and inoculants of BTCC570 (2.5x10⁶ CFU/g material) were used as silage
additives. Silages were prepared by using plastic jar silos (600 g) with three replications and then incubated at
room temperature (30oC) for 30 d. After 30 d, the silage
was opened and before being used for fermentation, substrate was lyophilized by using a freeze dryer for
48 h, ground and then sieved through a 0.5 mm screen. For evaluation of silage quality, chemical compositions
analysis such as proximate, iber fraction, and tannin
contents (AOAC, 1997; Van Soest et al., 1991; Makkar, 2003) and microbiology analyses (Sakamoto et al., 2004)
were conducted.
In Vitro Rumen Fermentation
The rumen luid was obtained from three istulated ongole breed catles before the morning feeding. The use of the catle in this experiment was approved by the Animal Care and Use Commitee of Bogor Agricultural University (No.01-2013 IPB). All catles were given feed at 2% DM of body weight (230 kg) with composition of
grass (P. purpureum hybrid) and commercial concentrate,
60% : 40%. Rumen luid used as the source of inoculum was mixed, homogenized, iltered by using sterilized double cheesecloth and transferred to a glass lask,
constantly lushed with CO2 and kept warm in a water
bath at 39 oC.
The HGT uses the protocol of Lopez et al. (2010) based on the method of Menke et al. (1979) and
modi-ication method by Castro-Montoya et al. (2011). The
substrate was approximately 380 mg for each treatment
and incubated in 100 mL-capacity glass syringes. Thirty
milliliters of bufered medium consisted of double strength bufer and rumen luid (with the ratio of 2:1) was dispensed into glass syringes and incubated in
a water bath at 39 oC for 24 h. The gas production was
observed every 2 h for 12 h, and inally at 24 h (2, 4, 6, 8,
10, 12, and 24 h of incubation). The net gas production
was calculated by subtracting the values of the blank
from that of the test syringe. For CH4 concentration
analysis, the gas was collected by using 10 mL sterilized syringes in two parts of incubation times, at 12 h and 24 h and then it was directly placed into a 5 mL of vacuum
Venoject tube. The CH4 was analyzed from mixed gas of
each treatment by using GC-TCD (Shimadzu 8A). After
24 h incubation, the bufer medium was collected and
divided into sterilized corning tubes for chemical analy-sis of pH (Cyberscan pH310 Eutech), N-NH3 (Conway method), VFAs (GC-FID, Bruker Scion 436) and for microbial analysis of T-RFLP, qPCR, and protozoa num-bers (Ogimoto & Imai, 1981). The in vitro organic mater
digestibility (IVOMD) was calculated by following the
equations, IVOMD (mg/g): 148.8 + 8.893 gas production (mL) + 0.448 CP (g/kg DM) + 0.651 total ash (g/kg DM) (Menke & Steingass, 1988).
Microbial Diversity Analyses
August 2014 123 Composition
g/kg
Treatment
K R1 R2 R3 R4
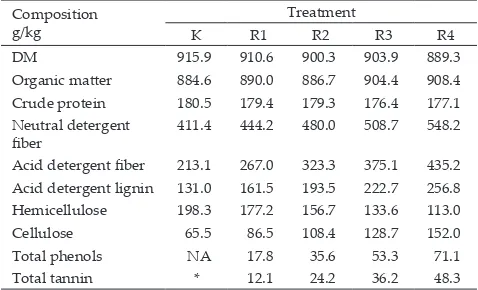
DM 915.9 910.6 900.3 903.9 889.3 Organic mater 884.6 890.0 886.7 904.4 908.4 Crude protein 180.5 179.4 179.3 176.4 177.1 Neutral detergent
iber 411.4 444.2 480.0 508.7 548.2 Acid detergent iber 213.1 267.0 323.3 375.1 435.2 Acid detergent lignin 131.0 161.5 193.5 222.7 256.8 Hemicellulose 198.3 177.2 156.7 133.6 113.0 Cellulose 65.5 86.5 108.4 128.7 152.0 Total phenols NA 17.8 35.6 53.3 71.1 Total tannin * 12.1 24.2 36.2 48.3
Note: *standard tannic acid, NA: Not available, K: 100% concentrate + pure tannic acid of 1 mg/mL, R1: 25% silage + 75% concentrate, R2: 50% silage + 50% concentrate, R3: 75% silage + 25% concentrate, R4: 100% silage.
Table 1. Chemical composition of dietary treatments
Kit (Blood or Culture Cell) based on Bufy Coat Protocol (Geneaid) with some modiications such as addition of Proteinase K (inal concentration of 2 mg/mL) and RNAse A (inal concentration of 10 mg/mL), and then
incubated at 60oC for 30 min. The DNA was pooled
from each treatment with a total of 5 DNA samples were
collected.
The DNA was ampliied by using primer
6FAM-27F (5’AGAGTTTGATCCTGGCTCAG3’) and 1492R (5’GGTTACCTTGTTACGACTT3’) for bacteria (Lane, 1991) and 6FAM-Met86F (5’GCTCAGTAACACGTGG3’) and Met1340R 5’CGGTGTGTGCAAGGAG3’) for metha-nogens (Wright et al., 2004). Ampliication of PCR reac
-tion was performed as described previously (Sakamoto
et al., 2004) in a total volume of 50 µL consisted of 5 µL of dissolved DNA (<1 µg), 0.5 µL of 1.25U Takara Ex Taq
(Takara shuzo), 5 µL of 10x Ex Taq bufer, 4 µL of dNTP
mixture (2.5 mmol/L), 10 pmol of each primer and up
to 50 µL of pure distilled water. The 16S rDNAs were ampliied by using a Biometra Thermocycler TGradient
with the following program for bacteria (Sakamoto et al.,
2004): 95oC for 3 min, followed by 30 cycles consisted of
95 oC for 30 s, 50 oC for 30 s and 72 oC for 1.5 min, with a
inal extension at 72oC for 10 min and for methanogens
(Danielsson et al., 2012): 94 oC for 5 min, followed by 30
cycles of 94 oC for 30 s, 57 oC for 30 s, and 68 oC for 1
min; with a inal extension at 68 oC for 7 min. Ampliied
DNAs were veriied by electrophoresis of aliquots PCR product (5 µL) in 1.5% agarose in 1x TAE bufer. The PCR products were puriied by using an Ultra Clean
PCR Clean Up Kit (Mo Bio Laboratories, Inc.,). The
puri-ied 16S rDNAs were stored at -20 oC until analysis.
T-RFLP was analyzed based on the method of
Sakamoto et al. (2004) and Danielsson et al. (2012) with
some modiications. The puriied PCR product (2 µL) was digested with four restriction enzymes consisted of
20 U of AluI, HhaI, MspI and RsaI (TaKaRa Shuzo) in a to-tal volume of 10 µL at 37 oC for 1 h. The restriction digest
product (2 µL) was mixed with 8µL of Hi-Di Formamide
(Applied Biosystems) and 1 µL of standard Gene ScanTM
1200 LIZ (Applied Biosystems). Each sample was dena
-tured at 95 oC for 2 min and then immediately placed
on ice. The length of T-RF was determined by using ABI
PRISM 3100 Genetic Analyzer (Applied Biosystems) in
GeneScan mode. T-RFs were estimated by using local
method peak scan version 2.0 (Applied Biosystems).
T-RFs with area peak of less than 2% of total area were ex
-cluded from the analysis. DNA fragments were resolved
to one base pair by manual alignment of the standard
peaks from diferent electropherograms. The prediction
of T-RFs was performed by using the microbial diver
-described previously (Sakamoto et al., 2004; Danielsson
et al., 2012; Bustin et al., 2009) with some modiications
by using the LightCycler3 system (Roche Diagnostic)
in accordance with the manufacturer’s instructions and the dsDNA-binding dye SYBR GreenI with four pairs of speciic primers (Denman & McSweeney, 2006;
Denman et al., 2007; Yu et al., 2005). The ampliication
was determined in a 20 µL inal volume consisted of 10
µL of SYBR® premix ExTaq™ containing TLi RNase H
plus (Takara), 0.4 µL of each speciic primer (forward & reverse) contained 10 pmol of the inal concentration, 7.2 µL of pure distilled water, and 2 µL of DNA sample
from each treatment. The total number of bacteria in
samples was determined by using Escherichia coli JM 109
cells as a standard. The total number of methanogens (including Methanobacteriales and Methanosarcinales)
in samples was determined by using Methanosarcina
barkeri JCM 10043T or Methanobrevibacter ruminantium
JCM 13430T cells as a standard. The DNA of
micro-bial standards was extracted by using Genomic DNA
Kit (Mo Bio Laboratories, Inc., Carlsbad, CA). A melting
curve was used to determine the speciicity of the PCR. Data were analyzed by using the LightCycler analysis software version 5.3 (Roche Diagnostic).
Experimental Design and Statistical Analysis
The experiment was a completely randomized design with ive treatments and three replications. The treatments consisted of diferent levels of silages
containing 50% (w/w) of C. calothyrsus namely K; 100%
concentrate + pure tannic acid of 1 mg/mL (Merck cat. no.1.00773), R1; 25% silage + 75% concentrate, R2; 50% silage + 50% concentrate, R3; 75% silage + 25% concen-trate, and R4; 100% silage. The fermentation parameters
measured were total gas, CH4, IVOMD, VFAs, pH,
N-NH3, numbers of protozoa, and microbial diversity.
Data were analyzed by using ANOVA with SPSS 16 for windows. Signiicant efects of each treatment were further analyzed by using the least signiicant diference
by Duncan Test (P<0.01), except microbial diversity data
were analyzed descriptively.
RESULTS AND DISCUSSION
124 August 2014
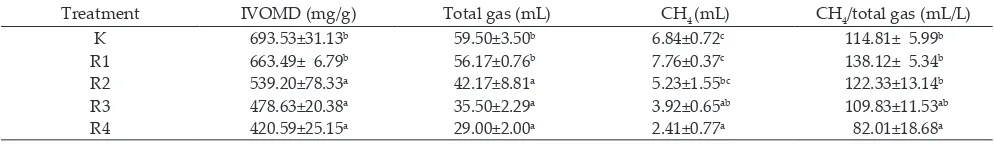
Treatment IVOMD (mg/g) Total gas (mL) CH4 (mL) CH4/total gas (mL/L)
K 693.53±31.13b 59.50±3.50b 6.84±0.72c 114.81± 5.99b
R1 663.49± 6.79b 56.17±0.76b 7.76±0.37c 138.12± 5.34b
R2 539.20±78.33a 42.17±8.81a 5.23±1.55bc 122.33±13.14b
R3 478.63±20.38a 35.50±2.29a 3.92±0.65ab 109.83±11.53ab
R4 420.59±25.15a 29.00±2.00a 2.41±0.77a 82.01±18.68a
Note: IVOMD: in vitro organic mater digestibility. K: 100% concentrate + pure tannic acid of 1 mg/ml, R1: 25% silage + 75% concentrate, R2: 50% silage
+ 50% concentrate, R3: 75% silage + 25% concentrate, and R4: 100% silage. Means in the same column with diferent superscript difer signiicantly (P<0.01).
Table 2. Organic mater digestibility and gas production increased NDF, ADF, cellulose, lignin and tannin and decreased EE and hemicellulose contents in the diet. The
paterns of gas production kinetics from all treatments
are shown in Figure 1. Several parameters of rumen fer
-mentation system can be used to determine the quality of ruminant feed such as gas production, IVOMD and CH4 concentration. Banik et al. (2013) identiied that CH4
production had a positive correlation with some fer
-mentation parameters such as gas pressure and acetate : propionate ratio.
The fermentation characteristics of gas production, IVOMD and CH4 concentration are shown in Table 2. Increasing levels of silage reduced gas production, IVOMD and CH4 concentration. The total gas
produc-tion of K and R1 were higher compared with R2, R3, and R4. Meanwhile, high total tannin contents in R2, R3, and
R4 tended to inhibit microbial activity in the rumen to
degrade the substrates that inally reduced total gas pro
-duction. The inhibition efects of tannin on in vitro gas
production has also been observed by several authors (Jayanegara et al., 2011a, b, c; Jayanegara & Sofyan, 2008; Wina et al., 2010). Methane concentration was inluenced
by the use of silage containing C. calothyrsus. The CH4 in
R4 was signiicantly lower (P<00.1) than K, R1, and R2
treatments. The use of silage up to 100% produced the
lowest concentration of CH4, but had negative efect on
IVOMD . In this study the reduction in methane was
26.8% greater than that reported by Jayanegara et al.
(2011a), who showed that C. calothyrsus powder contain
-ing 81g/kg total tannin produced 112 mL CH4/L total gas
in HGT. These observations are consistent with notion
that feed containing tannin can be used to reduce enteric
CH4 but may have negative efects on the OM digest
-ibility (Jayanegara et al., 2011a; Tiemann et al., 2008).
The IVOMD values of R2, R3, and R4 were lower than
K and R1. In this case, the increase in tannin contents in silages decreased rumen microbial activity. Kamra et al. (2012) described that tannins had mechanism to inhibit methanogenesis either directly or indirectly.
Rumen metabolite proiles consisting of pH, N-NH3
and VFAs are shown in Table 3. The pH values varied in all treatments and ranged between 6.36 and 6.71. These values are within the normal range for growth of cellulolytic bacteria. The pH value of R4 was higher
(P<0.01) than K, R1, and R2. The concentration of N-NH3
was the lowest in the K (P<0.01) compared with other treatments. The lowest level of ammonia production in the K treatment was related to the highest level of tannin.
Increased N-NH3 concentration indicates higher protein degradation by rumen microbes. The use of pure tannin
in K treatment showed that the protein were bound by
tannin and protected from rumen microbial degradation.
Rumen microbial activity afects the metabolites proile, mainly VFAs. The use of silages in the diets signiicantly increased the percentage of C2 volatile faty acids and decreased C3, but C4 and C5 faty acids were unchanged (Table 3). The percentage of C2 in R2, R3, and R4 were signiicantly higher (P<0.01) than K and R1 treatments.
Figure 1. Kinetics of gas production in HGT fermentation system. (■) K; 100% concentrate + pure tannic acid of 1 mg/ml, (●) R1; 25% silage + 75% concentrate, (▲) R2; 50% silage + 50% concentrate, (○) R3; 75% silage + 25% concentrate, and (□) R4; 100% si -lage.
451
0 10 20 30 40 50 60
0 2 4 6 8 10 12 24
Ga
s P
ro
du
ct
io
n
(m
l)
Incubation time (h)
452
453
(■) K
454
, (●) R1 , (▲) R2
455
○ , and (□) R4
456
457
458
459
Incubation time (h)
G
as
p
ro
d
uc
tio
n (m
L
August 2014 125 Treatment pH N-NH3
(mmol/L)
VFAs (% molar proportion)
C2:C3
C2 C3 C4 isoC4 C5 isoC5
K 6.36±0.08a 29.06±0.53a 60.48±0.47a 24.97±0.73b 11.30±0.19a 1.22±0.04a 0.70±0.03a 1.33±0.06a 2.42±0.09a R1 6.43±0.03ab 49.42±1.52c 60.61±0.96a 23.42±0.84ab 11.46±0.94a 1.60±0.06a 1.02±0.35b 1.89±0.37b 2.59±0.06ab R2 6.52±0.05bc 43.69±0.30bc 61.43±0.31bc 23.29±0.55ab 11.06±0.38a 1.39±0.03a 1.04±0.11b 1.80±0.13ab 2.64±0.06ab R3 6.60±0.03cd 42.31±4.31b 62.43±0.83bc 22.43±0.50a 10.82±0.33a 1.43±0.11a 1.07±0.05b 1.82±0.05ab 2.79±0.10b R4 6.71±0.04d 37.64±2.14b 62.99±0.79c 22.32±0.74a 10.41±0.22a 1.41±0.06a 1.06±0.10b 1.8±0.12ab 2.82±0.12b
Table 3. Proile of rumen fermentation
Note: C2: acetate, C3: propionate, C4: butyrate, C5: valerate. K: 100% concentrate + pure tannic acid of 1 mg/ml, R1: 25% silage + 75% concentrate, R2: 50% silage + 50% concentrate, R3: 75% silage + 25% concentrate, and R4: 100% silage. Means in the same column with diferent superscript difer signiicantly (P<0.01).
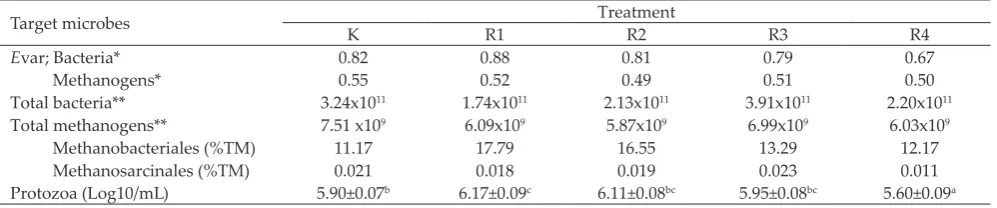
Target microbes Treatment
K R1 R2 R3 R4
Evar; Bacteria* 0.82 0.88 0.81 0.79 0.67
Methanogens* 0.55 0.52 0.49 0.51 0.50
Total bacteria** 3.24x10¹¹ 1.74x10¹¹ 2.13x10¹¹ 3.91x10¹¹ 2.20x10¹¹
Total methanogens** 7.51 x10⁹ 6.09x10⁹ 5.87x10⁹ 6.99x10⁹ 6.03x10⁹
Methanobacteriales (%TM) 11.17 17.79 16.55 13.29 12.17
Methanosarcinales (%TM) 0.021 0.018 0.019 0.023 0.011
Protozoa (Log10/mL) 5.90±0.07b 6.17±0.09c 6.11±0.08bc 5.95±0.08bc 5.60±0.09a
Note: *5% threshold standardized, **copy number of 16S rDNAs (qPCR), TM: total methanogens. K: 100% concentrate + pure tannic acid of 1 mg/ml, R1: 25% silage + 75% concentrate, R2: 50% silage + 50% concentrate, R3: 75% silage + 25% concentrate, and R4: 100% silage. Means in the same row with diferent superscript difer signiicantly (P<0.01).
Table 4. Diversity index and numbers of rumen microbes
R3 and R4 had lower C3 production compared to K treatment. High yield of acetate and low propionate
generally produced high concentration of CH4, but in
this result showed diferent paterns. This proile did not
directly afect the production of CH4 meaning that H2
was not optimally used by methanogens. These inding suggested that methanogenesis was inhibited by tannin
contained in silages C. calothyrsus. High concentration of polyphenolic in the feed can inhibit digestibility, absorption and reduce CH4 production and energy loss.
In this study, R1 to R2 with combination of 50 to 75%
and 25 to 50% (concentrate and silage) had adequate tannin to reduce enteric CH4, but still had negative efect on reducing IVOMD.
Microbial Diversity
Diversity index and microbial population are
shown in Table 4. The increasing level of silage in the
diets decreased the diversity index of bacteria and
protozoa populations. R4 showed the lowest Evar value
of bacteria compared to the other treatments, while R1 had the highest. These results implied that at lower concentrations of tannins the diversity was not afected, but at higher concentration of polyphenolic, there was
a consistent decrease. Inclusion of polyethyleneglicol
to neutralize the tannin efect may help resolve this is
-sue. Protozoa population of R4 was the lowest amongst
the treatments. The use of pure tannic acid did not
signiicantly afect protozoa number in R2 and R3.
The treatments might have closely similar function in reducing the numbers of protozoa. Ranilla et al. (2007)
described that the increase in the population of protozoa such Entodinium caudatum stimulated the production of
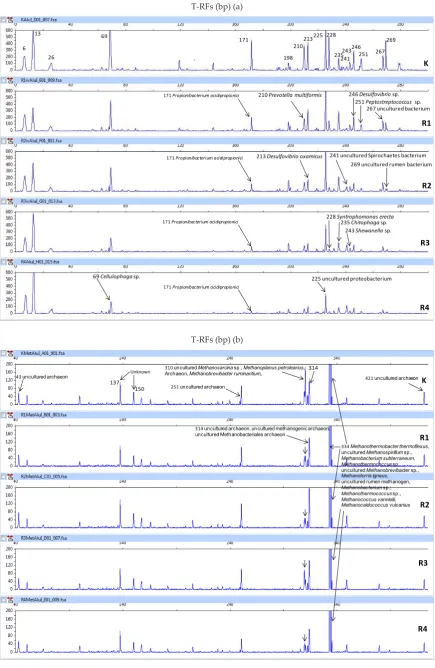
CH4. Figure 2a and b showed the patern of changes in
microbial community. The T-RFLP analysis indicated
the population of 17 T-RFs of bacterial phylotype where four uncultured bacteria were found (Figure 2a). The
increase in the level of silage had tendency to reduce the population of Propionibacterium acidipropionici, Prevotella multiformis, Desulfovibrio oxamicus, Syntrophomonas erecta, Desulfovibrio sp., Peptostreptococcus sp., Cellulophaga sp. and uncultured rumen bacteria. The decreased of these
bacteria had positive correlation with the VFA produc
-tion, especially C3. Desulfovibrio oxamicus, Cellulophaga
sp., uncultured proteobacterium, uncultured Spirochaetes
population and two T-RFs of 6 and 13 bp indicating they were tolerant to high level of tannin-containing silages
used in the fermentation system. McSweeney et al. (2001)
reported that proteolytic bacteria were present in rela
-tively high number and tolerant to highly tanniniferous diet.
Furthermore, the methanogenic community analysis
identiied 8 predominant T-RFs including 2 T-RFs identi
-ied as unknown fragment (137 and 150 bp) (Figure 2b). Nine methanogens and archaea were found culturable identity based on GenBank data base, while the other of
10 were unculturable. The culturable methanogens con
-sisted of Methanobrevibacter ruminantium, Methanoplanus
petrolearius, Methanothermobacter thermolexus,
Methano-bacterium subterraneum, Methanothermococcus sp.,
126 August 2014
T-RFs (bp) (a)
T-RFs (bp) (b)
Figure 2. T-RFLP 16S rDNAs proile after digested by AluI; (a) bacteria and (b) methanogens. K: 100% concentrate + pure tannic acid of 1 mg/ml, R1: 25% silage + 75% concentrate, R2: 50% silage + 50% concentrate, R3: 75% silage + 25% concentrate, and R4: 100% silage.
150 251 uncultured archaeon
310 uncultured Methanosarcinasp., Methanoplanus petrolearius, Archaeon, Methanobrevibacter ruminantium,
314 uncultured archaeon, uncultured methanogenic archaeon, uncultured Methanobacteriales archaeon
Figure 2. T-RFLP 16S rDNAs profile after digested by
Alu
I; (a) bacteria and (b) methanogens. K; 100%
August 2014 127 Methanobrevibacter ruminantium, Methanoplanus
petro-learius, uncultured Methanosarcina sp., and archaea.
Community of methanogens in 334 bp was consistently
dominant from all treatments (Figure 2b). This result had
close similarity with the results reported by Danielsson
et al. (2012). Addition of silages directly inhibited the
methanogenesis, while indirectly decreased the activity of bacteria and protozoa. The inhibitory efect of tannin on rumen methanogenesis is related to the direct efects
on methanogens, and indirectly through a depression of
protozoa associated with CH4 production and
cellulo-lytic bacteria on iber digestion (Kamra et al., 2012).
The qPCR analysis detected total methanogens and Methanobacterales population decreased consistently
with the increasing level of silage, except for total bac
-teria. The decrease in microbial diversity index is not
always followed by the reduction of population. This
fact is occurred on bacteria, but does not occur in metha-nogens (Brulc et al., 2011; Belanche et al., 2012). In this
ex-periment, the diversity of methanogens was consistently
stable, but the population declined (Table 4). These
re-sults were in agreement with Singh et al. (2012) who
reported that Methanobacteriales was a common popu
-lation in the rumen and positively correlated with CH4
production. This includes the type of hydrogenothrophic
methanogens which capable of using CO2 and H2 to
produce CH4. Methanobacteriales population reduced
consistently with the increasing level of silage, and then
decreased CH4 production (Table 2). Methanobrevibacter ruminantium was included as Methanobacteriales order
whose population decreased with the increasing levels of silage (Table 4). The activity was inhibited because of the reduced protozoa population which was associated with tannin content. Protozoa and methanogens were known to have high association in the rumen through production, IVOMD value, N-NH3 concentration, bacterial diversity index, and protozoal population. Methanobacteriales population has consistently
abun-dance and positively correlated with CH4 production.
Addition of 25% to 50% silage diets has been efective in
reducing enteric methane production but has negative
efect on decreasing bacterial diversity index and OM
digestibility.
ACKNOWLEDGEMENT
This research was supported by DIPA of the
Research Center for Biotechnology-LIPI. We thank to JCM RIKEN BioResource Center for supporting T-RFLP and qPCR analyses in Japan, Ministry of Research and Technology of Indonesia for a graduate scholarship
of Doctor Program in IPB and allowances of a short research in Japan, and to Dr. Chris McSweeney (CSIRO
Australia) for improving the manuscript.
REFERENCES
AOAC. 1997. Oficial Methods of Analysis. Association of
Oficial Analytical Chemists, Arlington, VA, USA.
Banik, B. K., Z. Durmic, W. Erskine, K. Ghamkhar, & C. Rev-ell. 2013. In vitro ruminal fermentation characteristics and
methane production difer in selected key pasture species in Australia. Crop & Pasture Science. 64:935–942. htp://
dx.doi.org/10.1071/CP13149
Belanche, A., G. de la Fuente, E. Pinloche, C. J. Newbold, &
J. Balcells. 2012. Efect of diet and absence of protozoa on
the rumen microbial community and on the representa-tiveness of bacterial fractions used in the determination of microbial protein synthesis. J. Anim. Sci. 90:3924–3936.
htp://dx.doi.org/10.2527/jas.2011-4802
Bhat, T. K., B. Singh, & O. P. Sharma. 1998. Microbial degra-dation of tannins–a current perspective. Biodegradegra-dation.
9:343–357. htp://dx.doi.org/10.1023/A:1008397506963 Blackwood, C. B., D. Hudleston, D. R. Zak, & J. S. Buyer.
2007. Interpreting ecological diversity indices applied to terminal restriction fragment length polymorphism data: insights from simulated microbial communities. Appl.
En-viron. Microbiol. 73:5276–5283. htp://dx.doi.org/10.1128/
AEM.00514-07
Bodas, R., N. Prieto, R. Garcia-Gonzalez, S. Andres, F. J. Giral -dez, & S. Lopez. 2012. Manipulation of rumen
fermenta-tion and methane producfermenta-tion with plant secondary me
-tabolites. Anim. Feed Sci. Technol. 176:78–93. htp://dx.doi. org/10.1016/j.anifeedsci.2012.07.010
Brulc, J. M., C. J. Yeoman, M. K. Wilson, M. E. B. Miller, P.
Jeraldo, S. Jindou, N. Goldenfeld, H. J. Flint, R. Lamed, I. Borovok, M. Vodovnik, K. E. Nelson, E. A. Bayer, & B.
A. White. 2011. Cellulosomics, a gene-centric approach to
investigating the intraspeciic diversity and adaptation of Ruminococcus lavefaciens within the rumen. PLoS ONE 6:e25329. htp://dx.doi.org/10.1371/journal.pone.0025329 Bustin, S. A., V. Benes, J. A. Garson, J. Hellemans, J. Hugget, M.
Kubista, R Mueller, T. Nolan, M. W. Pfai, G. L. Shipley, J. Vandesompele, & C. T. Witwer. 2009. The MIQE guide-lines: minimum information for publication of quantitative real-time PCR experiments. Clinical Chemistry. 55:611–
622. htp://dx.doi.org/10.1373/clinchem.2008.112797 Castro-Montoya, J. M., H. P. S. Makkar, & K. Becker. 2011.
Chemical composition of rumen microbial fraction and
fermentation parameters as afected by tannin and sapo -nins using an in vitro rumen fermentation. Can. J. Anim.
Sci. 91:433–448. htp://dx.doi.org/10.4141/cjas2010-028 Danielsson, R., A. Schnurer, V. Arthurson, & J. Bertilsson.
2012. Methanogenic population and CH4 production in
Swedish dairy cows fed diferent levels of forage. Appl. En
-viron. Microbiol. 78:6172-6179. htp://dx.doi.org/10.1128/
AEM.00675-12
Denman, S. E. & C. S. McSweeney. 2006. Development of a real-time PCR assay for monitoring anaerobic fungal and
cellulolytic bacterial populations within the rumen. FEMS Microbiol. Ecol. 58:572–582. htp://dx.doi.org/10.1111/ j.1574-6941.2006.00190.x
Denman, S. E., N. W. Tomkins, & C. S. McSweeney. 2007. Quan-titation and diversity analysis of ruminal methanogenic populations in response to the antimethanogenic compound bromochloromethane. FEMS Microbiol. Ecol. 62:313–322.
htp://dx.doi.org/10.1111/j.1574-6941.2007.00394.x
Jayanegara, A., E. Wina, C. R. Soliva, S. Marquardt, M. Kreu-zer, & F. Leiber. 2011a. Dependence of forage quality and methanogenic potential of tropical plants on their pheno-lic fractions as determined by principal component
Jayanegara, A., F. Leiber, & M. Kreuzer. 2011b.
Meta-analy-sis of the relationship between dietary tannin level and
methane formation in ruminants from in vivo and in vitro experiments. J. Anim. Physiol. Anim. Nutr. 96:365–375.
htp://dx.doi.org/10.1111/j.1439-0396.2011.01172.x
Jayanegara, A., S. Marquardt, M. Kreuzer, & F. Leiber. 2011c. Nutrient and energy content, in vitro ruminal fermenta-tion characteristics and methanogenic potential of alpine forage plant species during early summer. J. Sci. Food
Ag-ric. 91:1863–1870. htp://dx.doi.org/10.1002/jsfa.439
Jayanegara, A. & A. Sofyan. 2008. Penentuan aktiitas aktivitas
biologis tannin beberapa hijauan secara in vitro menggu -nakan ’Hoheinheim Gas Test’ dengan polietilen glikol seb-agai determinan. Med. Pet. 31:44–52.
Jayanegara, A., N. Togtokhbayar, H. P. S. Makkar, & K.
Becker. 2009. Tannins determined by various methods as predictors of methane production reduction potential of plants by an in vitro rumen fermentation system. Anim.
Feed Sci. Technol. 150:230–237. htp://dx.doi.org/10.1016/ j.anifeedsci.2008.10.011
Jayanegara, A., S. Marquardt, E. Wina, M. Kreuzer, & F. Leiber.
2013. In vitro indications for favourable non-additive
ef-fects on ruminal methane mitigation between high-pheno -lic and high-quality forages. British Journal of Nutrition.
109:615–622. htp://dx.doi.org/10.1017/S0007114512001742
Ji, E. S. & K. Park. 2012. Methane and nitrous oxide emissions from livestock agriculture in 16 local administrative dis-tricts of Korea. Asian-Aust. J. Anim. Sci. 25:1768–1774.
htp://dx.doi.org/10.5713/ajas.2012.12418
Kamra, D. N., M. Pawar, & B. Singh. 2012. Efect of plant sec -ondary metabolites on rumen methanogens and methane emissions by ruminants. In: A. K. Patra (Ed). Dietary Phy-tochemicals and Microbes. Spinger Sciences Business
Me-dia, Dordrecht. p.351–370.
htp://dx.doi.org/10.1007/978-94-007-3926-0_12
Lane, D. J. 1991. 16S/23S rRNA sequencing. In: E. Stackebrandt
& M. Goodfellow (eds). Nucleic Acid Techniques in Bacte -rial Systematics. Chichester: Wiley. pp.115–175.
Liu, W. T., T. L. Marsh, H. Cheng, & L. J. Forney. 1997. Char-acterization of microbial diversity by determining termi-nal restriction fragment length polymorphisms of genes encoding 16S rRNA. Appl. Environ. Microbiol.63:4516– 4522.
Lopez, S., H. P. S. Makkar, & C. R. Solivia. 2010. Screening plants and plant products for methane inhibitors. In: P. E.Vercoe, H. P. S. Makkar, & A. C. Schlink (Eds). In Vitro
Screening of Plant Resources for Extra-Nutritional Atri -butes in Ruminants: Nuclear and Related Methodologies. Spinger Science Business Media B.V. Dordrecht. p.191–232.
htp://dx.doi.org/10.1007/978-90-481-3297-3_10
Makkar, H. P. S. 2003. Quantiication of Tannins in Tree and Shrub Foliage: A Laboratory Manual. Kluwer Academic Publishers, Dordrecht, The Netherlands. htp://dx.doi.
org/10.1007/978-94-017-0273-7
McSweeney, C. S., B. Palmer, D. M. McNeill, & D. O. Krause. 2001. Microbial interactions with tannins: nutritional con -sequences for ruminants. Anim. Feed Sci. Technol. 91:83–
93. htp://dx.doi.org/10.1016/S0377-8401(01)00232-2 Menke, K. H. & H. Steingass. 1988. Estimation of the energetic
feed value obtained from chemical analysis and in vitro gas
production using rumen luid. Anim. Res. Dev. 28:7–55. Menke, K. H., L. Raab, A. Salewski, H. Steingass, D. Friz, &
W. Schneider. 1979. The estimation of the digestibility and
metabolizable energy content of ruminant feeding-stuf from the gas production when they are incubated with ru -men liquor in vitro. J. Agric. Sci. 93:217–222. htp://dx.doi. org/10.1017/S0021859600086305
Ogimoto, K. & S. Imai. 1981. Atlas of Rumen Microbiology. Ja-pan Sci. Soc. Press, Tokyo.
Patra, A. K. 2014. Trends and projected estimates of GHG emis
-sions from Indian livestock in comparisons with GHG emissions from world and developing countries. Asian-Aust. J. Anim. Sci. 27:592–599. htp://dx.doi.org/10.5713/ ajas.2013.13342
Patra, A. K. 2014. Trends and Projected Estimates of GHG Emis
-sions from Indian Livestock in Comparisons with GHG
Emissions from World and Developing Countries.
Asian-Aust. J. Anim. Sci. 27:592–599. htp://dx.doi.org/10.5713/ ajas.2013.13342
Ranilla, M. J., J. P. Jouany, & D. P. Morgavi. 2007. Methane production and substrate degradation by rumen micro-bial communities containing single protozoal species in
vitro. Leters in Appl. Microbiol. 45:675–680. htp://dx.doi. org/10.1111/j.1472-765X.2007.02251.x
Sakamoto, M., Y. Huang, M. Ohnishi, M. Umeda, I. Ishikawa,
& Y. Benno. 2004. Changes in oral microbial proiles after
periodontal treatment as determined by molecular
analy-sis of 16 rRNA genes. J. Med. Microbiol. 53:563–571. htp:// dx.doi.org/10.1099/jmm.0.45576-0
Shyu, C., T. Soule, S. J. Bent, J. A. Foster, & L. J. Forney. 2007.
MiCA: a web-based tool for the analysis of microbial com -munities based on terminal-restriction fragment length polymorphisms of 16S and 18S rRNA genes. Microb. Ecol.
53:562–570. htp://dx.doi.org/10.1007/s00248-006-9106-0
Singh, K. M., A. K. Tripathi, P. R. Pandya, S. Parnerkar, D.
N. Rank, R. K. Kothari, & C. G. Joshi. 2012.
Methano-gen diversity in the rumen of Indian surti bufalo ( Buba-lus bubalis), assessed by 16S rDNA analysis. Research in
Veterinary Science. 92:451–455. htp://dx.doi.org/10.1016/ j.rvsc.2011.03.022
Tiemann, T. T., C. E. Lascano, H. R. Wetstein, A. C Mayer, M. Kreuzer, & H. D. Hess. 2008. Efect of the tropical
tannin-rich shrub legumes Calliandra calothyrsus and Flemingia macrophylla on methane emission and nitrogen and
en-ergy balance in growing lambs. Animal. 2:790–799. htp://
dx.doi.org/10.1017/S1751731108001791
Van Soest, P. J., J. B. Robertson, & B. A. Lewis. 1991. Methods
for dietary iber, neutral detergent iber, and non-starch
polysaccharides in relation to animal nutrition. J. Dairy
Sci. 74:3583–3597.
htp://dx.doi.org/10.3168/jds.S0022-0302(91)78551-2
Wina, E., I. W. R. Susana, & B. Tangendjaja. 2010. Biological activity of tannins from Acacia mangium bark extracted
by diferent solvents. Med. Pet. 33: 103–107. htp://dx.doi.
org/10.5398/medpet.2010.33.2.103
Wright, A. D., A. J. Williams, B. Winder, C. T. Christophersen, S. L. Rodgers, & K. D. Smith. 2004. Molecular diversity of rumen methanogens from sheep in Western Australia.
Appl. Environ. Microbiol. 70:1263–1270. htp://dx.doi.
org/10.1128/AEM.70.3.1263-1270.2004
Yu, Y., C. Lee, J. Kim, & S. Hwang. 2005. Group-Speciic primer
and probe sets to detect methanogenic communities us-ing quantitative real-time polymerase chain reaction.
Biotechnol. and Bioengineering. 89:670–679. htp://dx.doi.