Vol. 4, No.2| December 2012| ISSN 2229-8932 Journal of Technical Education and Training (JTET) | 52
ANALYSIS AND MODELING OF EDUCATION PARTICIPATION
INDEX (EPI) IN INDONESIA FROM 2003-2008
1
Mustofa Usman,
2Hendarman,
3Jamal I.D. and
3Faiz A.M.Elfaki
1
Department of Mathematics, Faculty of Sciences,
Universitas Lampung, Indonesia
2
Head of the Central of Educational Research,
Ministry of Education Republic of Indonesia, Jakarta
3
Departments of Sciences,
Faculty of Engineering, IIUM, Malaysia
Abstract
The aims of the research is to reveal the characteristics of the Education Participation Index (EPI) in Indonesia based on the level of students’ age (7-12, 13-15, 16-18, and 19-24) which shows the participation index of the citizens at Elementary School, Junior High School, Senior High School and University. The data was taken from Central Bureau Statistics of Indonesia (BPS) from the year 2003 to 2008. The data is analyzed to see the difference between the level of ages at difference regions and difference years. And the data was analyzed by using analysis nested design. The second analysis is to find the EPI model for each regions and years. The modeling is used the multiple linear regression with dummy variable for the regions and years.
Vol. 4, No.2| December 2012| ISSN 2229-8932 Journal of Technical Education and Training (JTET) | 53
Introduction
In many countries, the statistics of Education Participation Index(EPI) are very important statistics for planning the education development in the countries, to plan the job market in the future, and to plan the budgeting the education for their people. The statistics of Education Participation Index is the ratio of the total number of citizens at the level of certain range of age with the total number of the pupils who are in formal education. There are several research studies which suggest that increased compulsory or voluntary participation in education has many benefits for individuals; such studies appear to show that ‘children who would otherwise leave school early are, in fact, better off if they stay, or that society benefits collectively because a higher level of educational attainment promotes good citizenship and economic development’ (Oreopoulos, 2006a). Falling participation in education, rising youth unemployment (Mark Corney, 2009). There are many researches shows that the access to postsecondary education is a central policy issue in modern societies. Increased participation in postsecondary education is an important social goal as it is a crucial determinant of the economic success of an individual as well as of society as a whole. Because of the positive benefits of postsecondary education, equitable access to postsecondary education for individuals from all backgrounds can ensure a higher level of social mobility (Rahman, A, Jerry Situ and Vicki Jimmo ,2005). Encouraging third level education participation has now become a key policy objective for most governments around the world; the participation of young people in higher education has increased significantly in the last twenty years in the majority of developed economies (OECD, 2009). The desire for a highly educated population stems from the belief that education can help economic growth by influencing worker productivity (Mankiw, Romer and Weil, 1992).
Participation means that students are formally enrolled in school. However, this crude description does not take into account the quality of participation a student may have – their ‘engagement’ – with school. A student may be enrolled, but not actively participate at all. This may be because they are not effectively participating because of truancy, or because of their school behavior and the disciplinary procedures associated with that. More commonly, as students in this study have demonstrated, it is because of poor teaching methods and lack of learning resources. Consultations with students discussed in this study revealed frequent reference to this qualitative dimension of participation as being very important to them and a factor strongly related to participation and transfer (Robert, C., and Arlianti, R., 2009). According to the participation statistics, the categories which count towards participation in education and training today are full-time education (FTE), work-based learning (WBL), and ‘other education and training’ (OET).(Mark Corney, 2009). But also, In the context of international goals and commitments, the number of out-of-school children is one of the most frequently cited education statistics. It is therefore crucial that, not only an appropriate definition and methodology are used, but that there is a good understanding of the results, their interpretation and limitations. It is important to clearly recognize that the final goal is not only to get children in school but to ensure schooling results in good learning outcomes.(UNESCO, 2005).
Education brings wide-ranging benefits to both individuals and societies. It is considered so important to individual development that the right to primary education is legally guaranteed in most countries of the world. Moreover, international human rights conventions also recognize the right to education. This right has been established by a succession of UN Conventions, from the Universal Declaration of Human Rights (1948) to the Convention on the Rights of the Child (1989), which acquired the status of international law in 1990. According to Article 28 of the Convention, governments have the responsibility of making primary education compulsory and available free to all. Education is also recognized as crucial to human development. Indeed the Education for All (EFA) movement and the Millennium Development Goals (MDG) have led to greater attention paid to educational participation and completion. (UNESCO, 2005).
Vol. 4, No.2| December 2012| ISSN 2229-8932 Journal of Technical Education and Training (JTET) | 54 Jimmo, 2005) to analyze Participation in Postsecondary Education: Evidence from the Survey of Labour and Income Dynamics.
In this paper we will try to analyze data of Education Participation Index in Indonesia from 2003 to 2008, the data was taken from Central Bureau Statistics of Indonesia (BPS). The data was classified based on the level of ages, regions, and years. To see the differences of the characteristics EPI based on the classifications above, the data will be analyzed by nested design approach, and to modeling the data will be analyzed by multiple regression with some variables are dummies variables.
Analysis and Modeling of the EPI
To analyze the data, we used analysis of nested design where the level of ages (7-12, 13-15, 16-18, and 19-24 year-old) are nested within the year (2003 to 2008). The regions are divided into six regions, namely: Sumatra(S)(Aceh, North Sumatra, South Sumatra, West Sumatra, Riau, Jambi, Bangka-Belitung Island, Bengkulu and Lampung), Java(J)( Jakarta, West Java, Banten, Mid Java, Yogyakarta, and East Java), Bali (B) (Bali, West Nusa Tenggara, East Nusa Tenggara), Kalimantan(K)(West Kalimantan, Mid Kalimantan, South Kalimantan, East Kalimantan), Sulawesi(SL)(North Sulawesi, Gorontalo, Mid Sulawesi, South Sulawesi, West Sulawesi, East West Sulawesi), Papua(P)(Maluku, North Maluku, Papua, West Papua). Also in this design assume that the Regions, Years, and level of ages are fixed effect. And the model similar to the model given in Mustofa, et al(2008) is as follow:
EPIijkm=μ+Ri+Yj+(RY)ij +Ak(j)+(RA)ik(j)+εm(ijk) (1)
Where EPIijkm is students’ participation index at ith-region, jth years, kth level of age and m sub region, µ is general mean, Ri is the effect of the-ith region, Yj is the effect of years at the jth year, (RY)ij is the interaction effect due to regions and Years, Ak(j) is the effect of level of ages nested in years, (RA)ik(j) is the interaction effect of regions and level of ages nested within the years, and εm(ijk) is the error. Based on this model, we can analyze the difference of EPI based on the Regions, Years, interaction Regions and Years, difference means of the level of ages and the interaction between level of ages and Regions nested in Years.
To modeling the EPI, we use multiple regressions with dummy variables for the Regions and Years. The model is developed based on the model which can be found in Gujarati(1970), Skvarcius and Cromer(1971) and Montgomery and Peck(1992). The model can be developed as follow:
Vol. 4, No.2| December 2012| ISSN 2229-8932 Journal of Technical Education and Training (JTET) | 55 lies in Papua if R1 = R2 = R3 = R4 = R5 = 0.
Y1 = 1, if the observation lies in the Year 2003, = 0, otherwise.
Y2 = 1, if the observation lies in the Year 2004, = 0, otherwise.
Y3 = 1, if the observation lies in the Year 2005, = 0, otherwise.
Y4 = 1, if the observation lies in the Year 2006, = 0, otherwise.
Y5 = 1, if the observation lies in the Year 2007, = 0, otherwise.
and
lies in Year 2008, if Y1= Y2 = Y3 =Y4 = Y5 = 0.
Analysis, Modeling and Discussion
From the analysis by nested design, we have that the model is very significant (p-value <0.0001) and the degree of determination is 97.12% ( R2 = 0.9712) this mean that 97.12% the variation of EPI can be explained by the model (Table 1).
Table 1. Anova table from nested design
_____________________________________________________________________________________ Sum of
Source DF Squares Mean Square F Value Pr > F
Model 143 782296.0126 5470.6015 144.16 <.0001
Error 612 23225.0568 37.9494
Corrected Total 755 805521.0694
______________________________________________________________________________________
R-Square = 0.9712
Table 2. Anova table from nested design to test the component of the model
______________________________________________________________________________________ Source DF SS Mean Square F Value Pr > F
REGION 5 2746.3849 549.2770 14.47 <.0001 YEARS 5 926.5160 185.3032 4.88 0.0002 REGION*YEARS 25 253.6967 10.1479 0.27 0.9999 AGE(YEARS) 18 776014.2822 43111.9046 1136.04 <.0001 AGE*REGION(YEARS) 90 2355.1329 26.1681 0.69 0.9854 ______________________________________________________________________________________
Vol. 4, No.2| December 2012| ISSN 2229-8932 Journal of Technical Education and Training (JTET) | 56 Table 3. Mean differences of EPI between Years, (Yi – Yj), i< j, i=2,3,4,5,6 and j=1,2,3,4,5.
Years Y2 Y3 Y4 Y5 Y6
Y1 Y2 Y3 Y4 Y5
1.75 2.03 2.14 3.15** 3.36** 0.28 0.39 1.40 1.61 0.11 1.12 1.33 1.01 1.22 0.21
** Significant at level 0.05.
Table 4. Mean differences of EPI between Regions
Regions SL B K S J
P SL
B K S
-3.55** - 2.22 -1.58 1.01 1.63 1.33 1.96 4.56** 5.18** 0.63 3.22** 3.85** 2.60** 3.22** 0.62
** Significant at level 0.05.
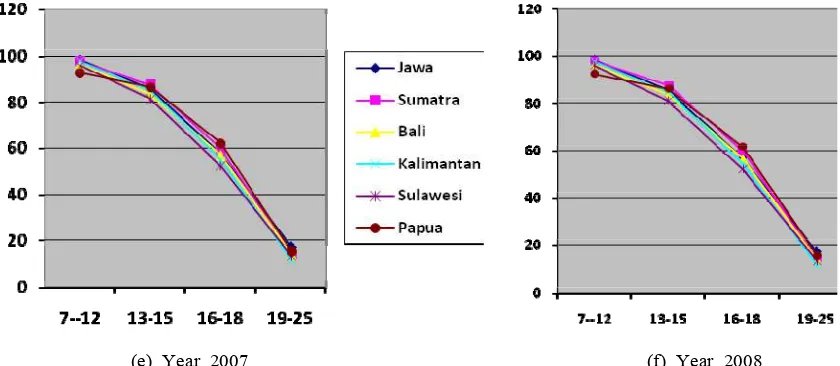
Vol. 4, No.2| December 2012| ISSN 2229-8932 Journal of Technical Education and Training (JTET) | 58 (a) Year 2003 (b) Year 2004
Vol. 4, No.2| December 2012| ISSN 2229-8932 Journal of Technical Education and Training (JTET) | 59 (e) Year 2007 (f) Year 2008
Figure 1. Graph of the EPI by Year, Region and level of age
From Table 5. The EPI at the level age 7-12 year-old, the EPI in all region and yeas are above 91%., with the lowest EPI is Papua and Maluku(P). The EPI and its standard deviation are 92.94% and 6.29% in 2003, 93.53% and 5.97% in 2004, 94.16% and 6.79% in 2005, 91.55% and 8.06% in 2006, 92.62% and 6.43% in 2007, and 92.72% and 6.47% in 2008. But in this regions the variation are quite high compared to the other regions, which shows that in this regions the EPI at the level of age 7-12 year-old, distributed not evenly. While in the other regions the variation are small, which shows that the EPI are distributed evenly. The EPI at the level age 13-15 year-old, the EPI are about the in the range 74% to 86% in 2003 and 2004, and about in the range 80% to 87% in 2005 to 2008. But they have the same characteristics, namely they have high standard deviation. This shows that at the level age 13-15 year old in all regions distributed not evenly. The EPI at the level age 16-18 year-old, the EPI in Sumatra in year 2003 and 2004 has highest EPI. The EPI in Papua and Maluku in 2005 to 2008 has the highest EPI. But they have the same characteristics, namely they have high standard deviation. This shows that at the level age 16-18 year old in all regions distributed not evenly, and Java has the highest standard deviation. The EPI at the level age 19-24 year-old, the EPI in Java from 2003 to 2008 has the highest EPI, about 17%, but has the highest standard deviation, which indicate that in Java is distributed not evenly, with the range of between 9% and 47% . Yogyakarta has the highest EPI at the level of age 19 to 24 year-old about 41% to 47% EPI. While in the other regions the EPI are relatively close in the range between 9% and 16% and its standard deviation also relatively small. This shows that at the level age 19-24, out of Java, in the other regions the EPI distributed evenly.
Table 6. Anova table for testing the model (2)
______________________________________________________________________________ Sum of
Source DF Squares Mean Square F Value Pr > F _____________________________________________________________________________________ Model 27 781384.61 28940.17 872.89 <.0001 Error 728 24136.45 33.15
Corrected Total 755 805521.06
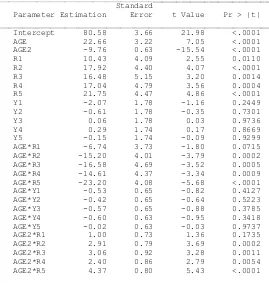
Vol. 4, No.2| December 2012| ISSN 2229-8932 Journal of Technical Education and Training (JTET) | 60 Table 7. Estimation and Testing the parameters in model 2.
__________________________________________________________ Standard
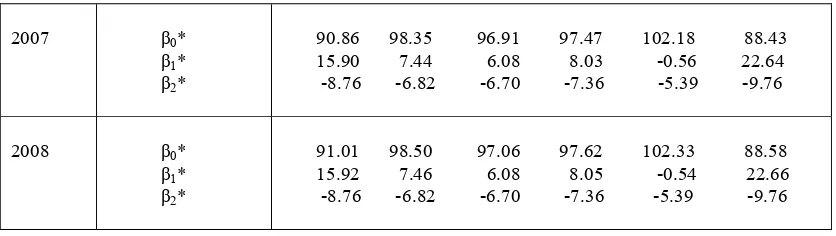
Vol. 4, No.2| December 2012| ISSN 2229-8932 Journal of Technical Education and Training (JTET) | 61 2007
β0* β1* β2*
90.86 98.35 96.91 97.47 102.18 88.43 15.90 7.44 6.08 8.03 -0.56 22.64 -8.76 -6.82 -6.70 -7.36 -5.39 -9.76
2008
β0* β1* β2*
91.01 98.50 97.06 97.62 102.33 88.58 15.92 7.46 6.08 8.05 -0.54 22.66 -8.76 -6.82 -6.70 -7.36 -5.39 -9.76
Table 6. shows the result of statistical test for model (2) and the result shows that the model (2) is very significant with p-value <0.0001 and its degree of determination R2=0.9700, means that 97% the variation of EPI can be explained by the model, or 97% EPI can be explained by the level of ages, regions and years.
Table 7, shows the result of parameters estimation and its standard error for the β’s parameters in the model(2). From the Table 7. The standard error for parameters related to regions has higher standard error compared to standard error related to Years. This shows that the EPI related to regions distributed not evenly. The EPI as a function of the level of ages for each region and years are given in Table 8. The model can be written as:
=β +β +β +ε
2
2 1
0 * k * k
* A A
EPI
(3) For example, for Java with R1=1 and =0 otherwise, and year 2004, Y2 = 1 and =0 otherwise. If we put all these values in to the model estimation of model (2), we get the model for Java in 2004 :
= + − +ε
2
76 8 50 15 40
89. . Ak . Ak
EPI
With the equivalent calculation for other regions and years to get the model (3) for each regions and years and the results are presented in Table 8.
References
deBroucker, P. (2005), Getting There and Staying There: Low-income Students and Post-secondary Education, www.cprn.org/, Canadian Policy Research Network (CPRN).
Gujarati,D.(1970). Use of Dummy Variables in Testing for Equality Between Sets of Coefficients in Linear regressions: A Generalization. The American Statistician, December, 1970.
Jean Drèze and Geeta, G.K. (1999). School Participation in Rural India, Institute for Economics and Statistics (University of Oxford).
Mankiw N., D. Romer and D. Weil, (1992). A Contribution to the Empirics of Economic Growth, Quarterly Journal of Economics, Vol. 107.
Mark Corney,(2009). Raising the Participation age, CfBT Education Trust, UK.
Vol. 4, No.2| December 2012| ISSN 2229-8932 Journal of Technical Education and Training (JTET) | 62 Montgomery,D.C. and Peck,E.A.(1992). Introduction to Linear Regression Analysis, (Second Ed.). New York: John Wiley and Sons, Inc.
OECD, (2009). Education Today, The OECD Perspective. OECD Publishing, Paris
Oreopoulos, P. (2006a). The compelling effects of compulsory schooling: evidence from Canada, Canadian Journal of Economics , 39, 1, 22-52.
Rahman, A, Jerry Situ and Vicki Jimmo (2005), Participation in Postsecondary Education: Evidence from the Survey of Labour and Income Dynamics, Published by authority of the Minister responsible for Statistics Canada © Minister of Industry, 2005
Robert, C., and Arlianti, R. (2009). Transition to and Participation in Junior Secondary School, Study Case in Indonesia, The United States Agency for International Development (USAID), Jakarta, Indonesia.
Skvarcius,R., and Cromer, F.(1971). A Note on the Use of Categorical Vectors in Testing for Equality of two Regression Equations. The American Statistician, June, 1971.
Shaienks,D., and Tomasz, G., and Justin , B. (2008), Postsecondary Education –Participation and Dropping out: Differences Across University,College and Other Types ofPostsecondary Institutions, Published by authority of the Minister responsible for Statistics Canada © Minister of Industry, 2008