Vol. 8 | No. 3 ISSN: 2089-6271 | e-ISSN: 2338-4565
This research examines the effect of board characteristics (comprising in different sized proportions: family commissioners, family directors, independent commissioners, ex-government officer commissioners, and board of commissioners size) to firm performance. Using fixed-effects data panel regression, this research investigates 293 firms listed on the Indonesian Stock Exchange during 2008-2012. Firm performance is proxied by market measure (Tobin’s Q) and accounting measure (ROA). The findings of this research suggest that the proportion of family commissioners and family directors have positive impact only to Tobin’s Q value, while the proportion of independent directors can increase both Tobin’s Q and ROA. On the other hand, this research finds that the proportion of ex-government officers in the board gives no impact to firm performance. This research also finds that the board size has U-shaped non-linear relationship with firm performance as proxied by Tobin’s Q and ROA.
© 2016 IRJBS, All rights reserved. Keywords:
board of commissioners size, ex-government officer commissioner, family commissioner,
family director,
independent commissioner
Corresponding author: [email protected]
Athalia Ariati Hidayat, Sidharta Utama
Universitas Indonesia, JakartaA R T I C L E I N F O A B S T R A C T
Board Characteristics and Firm Performance:
Evidence from Indonesia
INTRODUCTION
Corporate governance issue has been an interesting topic for the last decade especially for researchers. This weak corporate governance has been cited as one of the causes of East Asian financial crisis in 1997-1998 (Mitton, 2002). Weak law enforcement and weak protection for minority shareholders in Asian countries also stimulate how the agency problem increases during crisis. The managers or the majority shareholders who
monitoring function (board of commissioners) in dealing with the agency problems of the company (Lefort & Urzúa, 2008).
In Indonesia, it is common that family members serve as directors or commissioners. The absence of clear separation between ownership and management, may cause the company to run in accordance with the interest of the controlling shareholder, and not in the company’s real interest. In addition, the board of commissioners who are supposed to monitor, control, and advise, may not be able to act independently. A sizeable proportion of family members in the board of commissioners is proven to have a negative impact towards corporate transparency (Saiful, Phua, & Haron, 2012).
The extent of control from the controlling shareholder can be neutralized by the presence of an independent monitoring board (independent commissioner). Independent commissioners are expected to protect minority shareholders from wealth expropriation by majority shareholders. The interests of minority shareholders are best protected when they have “power” in facing the ones in control of the company, through independent commissioners (Anderson & Reeb, 2004). Prabowo and Simpson (2011) in their research in Indonesia found that the presence of independent commissioners has an insignificant relationship to the firm’s performance. On the other hand, independent commissioners have
positive impact to corporate transparency (Saiful et
al., 2012) and financial reporting quality (Rusmin,
2011). However, the definition of independent commissioner in the said researches simply follow the definition of ‘independent’ according to the Indonesian Stock Exchange regulations, that is an individual without any affiliation with management, other directors, controlling owners, and who does not serve as a commissioner in any other affiliated company (Prabowo & Simpson, 2011). Whereas, in fact many independent commissioners who satisfy that criteria, have been
employed or serving and holding positions in the company for many years thereby decreasing their level of independency.
In Indonesia, it is also common to find ex-government officers serving in the board of commissioners. With their experience in the government, an ex-government officer is considered reputable to serve as a commissioner of the company. Schaede (1995) stated that ‘the Old Boys’ or a nickname for ex-government officers who serve as the board of directors in Japan, are able to smoothen the information flow between government and business, impact the formulation of corporate strategies in accordance to government regulations, and impact the formulation of public policies so that they effectively represent firm’s and the private sector’s interest. Unfortunately, research that examines ex-government officers existance and their relationship towards the firm’s performance can barely be found in Indonesia.
Other board characteristics such as board size is also important as it relates to firm performance and prior research show varying results. Several studies in big public companies showed a negative relationship between board size and firm perfor-mance. This is true in US (Yermack, 1996), Europe (Bennedsen, Kongsted, & Nielsen, 2008; Eisen-berg, Sundgren, & Wells, 1998), and Asia (Mak & Kusnadi, 2005). Yet, studies on public companies in Indonesia showed that board size positively
impact corporate transparency (Saiful et al., 2012)
and the quality of earnings (Rusmin, 2011).
of commissioners size and firm performance in Indonesia, which has two-tier board system.
Literature Review and Hypothesis Development
The board of directors and board of commissioners are the central institution in the internal governance of the company (Lefort & Urzúa, 2008). In the context of one-tier board system, the board of directors consist of executive directors who are in charge of the operational running of the company and the non-executive directors who run the monitoring function and are not involved in the company operations. In Indonesia, based on UU No. 40 of 2007 about limited company, the executive director’s role is run by the board of directors, while the non-executive directors role/function is held by the board of commissioners (two-tier board system). The board of commissioners generally represent the shareholders of the company.
The board of commissioners have two main func-tions: (1) monitoring function, that can be related to agency theory; (2) providing resources func-tion, that can be related to resource dependence theory. According to the agency theory, the board of commissioners hold the responsibility to mo-nitor the management in the name of sharehol-ders to avoid conflict of interest between princi-pal and its agent (Hillman & Dalziel, 2003; Lefort & Urzúa, 2008). Whereas according to resource dependence theory, the board of commissioners’ role is to enhance the company’s reputation, build external relations, and provide advice and consul-tation to management (Zahra & Pearce II, 1989).
Most Indonesian companies have concentrated ownership and they are controlled by an individual or group of family members (Achmad, 2008; Husnan, 2001). According to the agency theory, controlling shareholders or their representatives join the company’s management with the intention to avoid agency costs that emerge from the different interests of owners and managers. Agency problems can be minimized if the principal
and agent are on the same side (Villalonga & Amit, 2006), that is in the hands of family members. While from the perspective of stewardship theory, a family director is considered to be able to monitor managers better and be a good asset protector, because the family’s wealth is related to company assets (Anderson & Reeb, 2003).
On the other hand, controlling shareholders’ presence in management will increase the gap between voting rights and cash flow rights making it possible for the controlling shareholders to expropriate minority shareholders’ wealth
(La Porta et al., 1999). The separation between
ownership and control can reduce firm value as another agency problem appears, that is between majority and minority shareholders (Claessens
et al., 2000; Lins, 2003). Hidayat and Loe (2011) found that the agency problem between majority and minority shareholders can trigger more critical problems for the company, as compared to the one caused by agency problems between owner and manager.
H1: The proportion of controlling shareholders in the management (board of directors) has negative impact on firm performance.
If the controlling shareholder does not have the opportunity to be involved in the company mana-gement, they will take control as the commissio-ners of the company to monitor the management’s work (Husnan, 2001). The presence of controlling shareholders or his family members in the board of commissioners has positive relationship with firm performance, because of their intention to preserve their family reputation, wealth, and long-term firm performance (Wang, 2006).
advantage of keeping the information within the
family (Saiful et al., 2012). Prabowo and Simpson
(2011) found that family members’ involvement in the board of commissioners has a negative effect to firm performance since family members are a group of people with the same interest and can deter the effectiveness of internal control system.
H2: The proportion of controlling shareholders in the board of commissioners has negative impact on firm performance.
To have a more independent view, the board of commissioners need an independent party that is not related to the controlling shareholder, that is the independent commissioner. According to the agency theory, an independent commissioner hold the responsibility to monitor insiders or the controlling shareholders, while according to the stewardship theory, an independent commissioner can provide valuable advice and counsel to the company (Anderson & Reeb, 2004).
Chugh et al., (2011) in the study in India stated that
the high proportion of independent commissioners indicated excessive board autonomy and can reduce firm profitability. Aligned with this finding, Koerniadi and Tourani-Rad (2012) in their study in New Zealand revealed an argument that this negative effect may be caused by the stewardship theory, which shows that managers and non-independent directors are the ones that are loyal to the company and are good stewards of firm assets. Literature review indicates the presence of independent commissioners can impact both positively and negatively to firm performace, so we suggest the following hyphotesis:
H3: The proportion of independent commissioners has impact to firm performance.
Ex-government officers who join the company’s board of commissioners are expected to help in smoothing out the information flow between government and business, impact how corporate
strategies are aligned with government regulations, and impact the formulation of public policies that can represent firms’ interest (Schaede, 1995). Though, the politically connected firm generally has lower accounting performance than a firm
without political connection (Boubakri et al., 2008;
Faccio, 2010). The involvement of ex-government officers in the board of commissioners can distract the company from profitability objectives to pursue
political goals (Boubakri et al., 2008), as external
investors view the politically connected board as having low professionalism because of their
irrelevant professional background (Fan et al.,
2007). Furthermore, a politically connected firm will devote less time and care managing quality disclosure due to the protection the politically connected firm enjoy, once the connection is
established (Chaney et al., 2011).
H4: The proportion of ex-government officer in the board of commissioners has negative impact to firm performance.
The monitoring and advisory role of the board of commissioners can explain how the board of commissioners’ size affect firm performance (Coles, Daniel, & Naveen, 2008). Regarding the monitoring role, smaller boards are more effective
at monitoring management (Coles et al., 2008).
This result aligns with prior studies that find board size has negative relationship with firm
performance (Bennedsen et al., 2008; Eisenberg
et al., 1998; Mak & Kusnadi, 2005; Ujunwa, 2012; Yermack, 1996). More complex coordination, communication, and decision making problems emerge with the increase in the number of board of commissioner members (Yermack, 1996).
On the other hand, from the advisory role perspective, larger boards offer better advice to
management (Coles et al., 2008). This argument
is supported by a study from Chugh et al. (2011)
results, we suggest there is a nonlinear relationship between the board of commissioners size and firm performance:
H5: Larger board size positively affects firm performance, but too large board size negatively affects firm performance.
METHODS
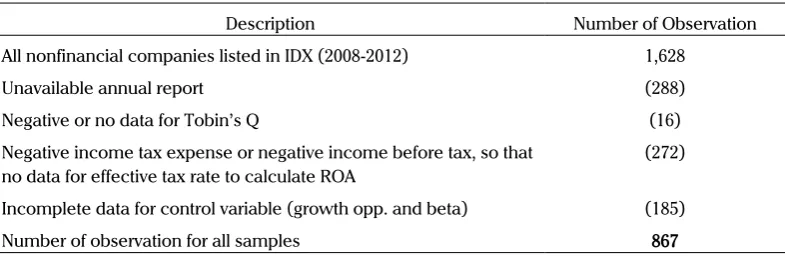
Data population on this research is all listed com-panies in the Indonesian Stock Exchange. We limit the sample to companies which have audited fi-nancial statements and annual reports for a 5 year research period (2008-2012) and have information on the board of commissioners and directors’ pro-file, excluding companies in the financial industry because the financial industry has different cha-racteristics (Darmadi, 2011) and the large possibi-lity that financial companies are regulated, limiting the board of commissioners and directors’ role (Yermack, 1996). Sampling method is judmental sampling, with elimination of incomplete data. Table 1 shows the description of the sample.
We used the board of commissioners and board of directors’ profiles, which include complete name, working experience and history, and the board size. Identification for independent variables’ data was done manually, by looking into the board of commissioners and board of directors’ profile in the annual report published by the company, while variable control data were obtained from S&P CapitalIQ.
Panel data regression was used to test the hyphotesis, because we combined cross-section data (companies) and time-series data (years). According to Hausman test, the most appropriate model to use is fixed-effects panel data regression.
Model 1
Qit = β0it + β1FAMBOCit + β2FAMBODit +
β3INDCOMit+ β4 EXGOVOFFit+β5 BSIZEit +
β6 BSIZE2it+ β7 SIZEit+ β8 DEBTit + β9 AGEit+
β10 GROWit + β11 RISKit+eit
Model 2
ROAit = β0it + β1FAMBOCit + β2FAMBODit +
β3INDCOMit+ β4 EXGOVOFFit+β5 BSIZEit +
β6 BSIZE2it+ β7 SIZEit+ β8 DEBTit +
β9 AGEit+ β10 GROWit + β11 RISKit+eit
Where:
Q = market value of equity divided by
book value of equity
ROA = net income added by after-tax
interest expense, divided by total equity plus interest-bearing debt FAMBOC = the proportion of controlling
shareholders and their family in the board of commissioners, divided by the total number of members in the board of commissioners
FAMBOD = the proportion of controlling shareholders and their family in the board of directors, divided by
Description Number of Observation
All nonfinancial companies listed in IDX (2008-2012) 1,628
Unavailable annual report (288)
Negative or no data for Tobin’s Q (16)
Negative income tax expense or negative income before tax, so that no data for effective tax rate to calculate ROA
(272)
Incomplete data for control variable (growth opp. and beta) (185)
Number of observation for all samples 867
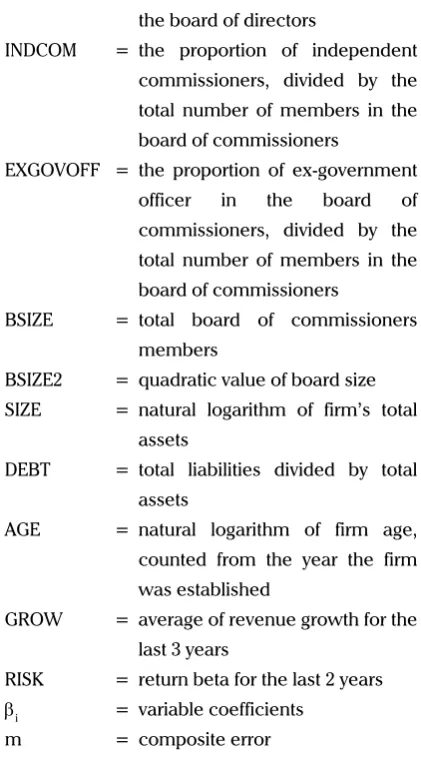
the total number of members in the board of directors
INDCOM = the proportion of independent commissioners, divided by the total number of members in the board of commissioners
EXGOVOFF = the proportion of ex-government officer in the board of commissioners, divided by the total number of members in the board of commissioners
BSIZE = total board of commissioners
members
BSIZE2 = quadratic value of board size
SIZE = natural logarithm of firm’s total
assets
DEBT = total liabilities divided by total
assets
AGE = natural logarithm of firm age,
counted from the year the firm was established
The proportion of controlling shareholders in the board of commissioners and board of directors is determined by the proportion of board members
that have family relationship (Saiful et al., 2012).
This research will be searching for common surnames in board members to identify family relationship (Tabalujan, 2002), except when there is strong evidence that someone is connected either vertically or horizontally to the family. The strong evidence referred to written statement of board profile in the annual report, prospectus, or news (printed and online).
The definition for independent commissioners in this research follow the formal requirement to be an independent commissioner as stated in Kep-339/BEJ/07-2001 section C.2 modified
in Kep-305/BEJ/07-2004, that is, an individual without any affiliation with management, other directors, controlling owners, and who does not serve as a commissioner in any other affiliated firm (INDCOM). The rules must be obeyed by all companies listed in Indonesia Stock Exchange and they have to state the fact in the company’s annual report. For sensitivity analysis, this research add the definition from Anggraini (2013), that an independent commissioner should serve a maximum of 9 years and is not a former employee or management of the company (INDCOM2). This research will also adjust independent commissioners who are former employees of the company in the same group (INDCOM3).
The proportion of ex-government officers in the board of commissioners can be counted by dividing the number of ex-government officers in the board of commissioners by the total number of members in the board of commissioners (EXGOVOFF). A board member can be categorized as a ex-government officer if he has served as a central government officer (minister, house of representative), local government officer (governor), in the military forces (national army), or as a government organization head. This follows the definition from previous researches
(Fan et al., 2007; Goldman et al., 2009; Lester et
al., 2008), adjusted to the condition in Indonesia.
In addition, this research will also see the effect of the proportion of current government officers only (GOVOFF) and the proportion of ex-government officers and current government officers combined (ALLGOVOFF), to firm performance.
Following prior research (Mak & Kusnadi, 2005;
Rusmin, 2011; Saiful et al., 2012; Yermack, 1996),
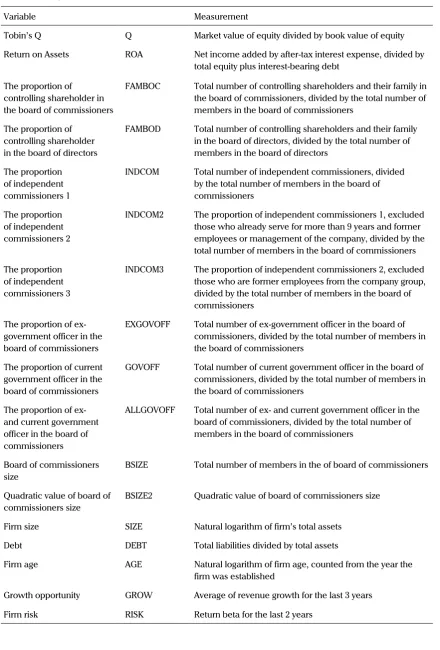
the board of commissioners size is determined from the total number of members in the board of commissioners. Table 2 show the description for all variables used in the research.
RESULTS AND DISCUSSION
Variable Measurement
Tobin’s Q Q Market value of equity divided by book value of equity
Return on Assets ROA Net income added by after-tax interest expense, divided by
total equity plus interest-bearing debt
The proportion of controlling shareholder in the board of commissioners
FAMBOC Total number of controlling shareholders and their family in
the board of commissioners, divided by the total number of members in the board of commissioners
The proportion of controlling shareholder in the board of directors
FAMBOD Total number of controlling shareholders and their family
in the board of directors, divided by the total number of members in the board of directors
The proportion of independent commissioners 1
INDCOM Total number of independent commissioners, divided
by the total number of members in the board of commissioners
The proportion of independent commissioners 2
INDCOM2 The proportion of independent commissioners 1, excluded
those who already serve for more than 9 years and former employees or management of the company, divided by the total number of members in the board of commissioners The proportion
of independent commissioners 3
INDCOM3 The proportion of independent commissioners 2, excluded
those who are former employees from the company group, divided by the total number of members in the board of commissioners
The proportion of ex-government officer in the board of commissioners
EXGOVOFF Total number of ex-government officer in the board of
commissioners, divided by the total number of members in the board of commissioners
The proportion of current government officer in the board of commissioners
GOVOFF Total number of current government officer in the board of
commissioners, divided by the total number of members in the board of commissioners
The proportion of ex- and current government officer in the board of commissioners
ALLGOVOFF Total number of ex- and current government officer in the
board of commissioners, divided by the total number of members in the board of commissioners
Board of commissioners size
BSIZE Total number of members in the of board of commissioners
Quadratic value of board of commissioners size
BSIZE2 Quadratic value of board of commissioners size
Firm size SIZE Natural logarithm of firm’s total assets
Debt DEBT Total liabilities divided by total assets
Firm age AGE Natural logarithm of firm age, counted from the year the
firm was established
Growth opportunity GROW Average of revenue growth for the last 3 years
Firm risk RISK Return beta for the last 2 years
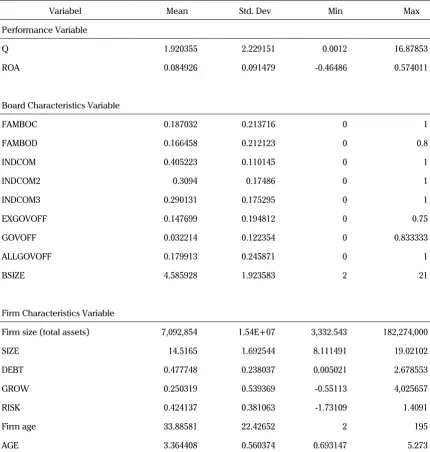
in the research. There are 867 observations in this study, from 293 firm samples.
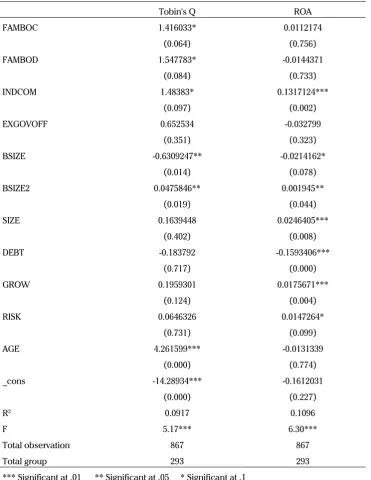
According to table 4, the proportion of family in the board of directors (FAMBOD) give positive impact to investor’s expectation to profitability and growth in the future. This is shown from the positive coefficient of Tobin’s Q, yet the proportion of family in the board of directors have no impact to ROA or company profitability for the period. This result agree with Anderson and Reeb (2003),
Barontini and Caprio (2006), and also Villalonga and Amit (2006) that found a family CEO give positive impact to Tobin’s Q.
This result can be associated with the agency theory and stewardship theory that happened in the company. Based on the agency theory, family in management can minimize conflict of interest between owner as the principal and management as the agent, because principal and agent are on the same side, that is with the family. While
Variabel Mean Std. Dev Min Max
Performance Variable
Q 1.920355 2.229151 0.0012 16.87853
ROA 0.084926 0.091479 -0.46486 0.574011
Board Characteristics Variable
FAMBOC 0.187032 0.213716 0 1
FAMBOD 0.166458 0.212123 0 0.8
INDCOM 0.405223 0.110145 0 1
INDCOM2 0.3094 0.17486 0 1
INDCOM3 0.290131 0.175295 0 1
EXGOVOFF 0.147699 0.194812 0 0.75
GOVOFF 0.032214 0.122354 0 0.833333
ALLGOVOFF 0.179913 0.245871 0 1
BSIZE 4.585928 1.923583 2 21
Firm Characteristics Variable
Firm size (total assets) 7,092,854 1.54E+07 3,332.543 182,274,000
SIZE 14.5165 1.692544 8.111491 19.02102
DEBT 0.477748 0.238037 0.005021 2.678553
GROW 0.250319 0.539369 -0.55113 4,025657
RISK 0.424137 0.381063 -1.73109 1.4091
Firm age 33.88581 22.42652 2 195
AGE 3.364408 0.560374 0.693147 5.273
according to the stewardship theory, family is considered to be loyal in serving and controlling the company, because the family’s wealth is connected to company’s assets. Family also has more information than nonfamily, so the family director is deemed to be able to make more effective decisions.
Not only that family director will give positive impact to firm value, but this research also suggests that the proportion of family in the board of commissioners (FAMBOC) will give positive effect to Tobin’s Q but no impact to ROA. Using the theory explained before, the presence of family in the board of commissioners can create alignment
Tobin's Q ROA
FAMBOC 1.416033* 0.0112174
(0.064) (0.756)
FAMBOD 1.547783* -0.0144371
(0.084) (0.733)
INDCOM 1.48383* 0.1317124***
(0.097) (0.002)
EXGOVOFF 0.652534 -0.032799
(0.351) (0.323)
BSIZE -0.6309247** -0.0214162*
(0.014) (0.078)
BSIZE2 0.0475846** 0.001945**
(0.019) (0.044)
SIZE 0.1639448 0.0246405***
(0.402) (0.008)
DEBT -0.183792 -0.1593406***
(0.717) (0.000)
GROW 0.1959301 0.0175671***
(0.124) (0.004)
RISK 0.0646326 0.0147264*
(0.731) (0.099)
AGE 4.261599*** -0.0131339
(0.000) (0.774)
_cons -14.28934*** -0.1612031
(0.000) (0.227)
R2 0.0917 0.1096
F 5.17*** 6.30***
Total observation 867 867
Total group 293 293
*** Significant at .01 ** Significant at .05 * Significant at .1
effect. The family commissioners are expected to be able to enhance the role in controlling directors, which is one of their main responsibilities. Wang (2006) stated that family have certain interests to the company due to their family reputation and long-term business continuity. Therefore, the family can be an effective guards for the company’s assets.
From table 4, it also can be seen that the proportion of independent commissioners (INDCOM) affect firm performance (Tobin’s Q and ROA) with the positive direction. This result is in line with
the result from Ameer et al. (2010), Ibrahim and
Samad (2011), and Khan and Awan (2012).
The positive effect of independent commissioners variable to firm performance Tobin’s Q and ROA can be explained through agency theory reasoning. Firstly, independent commissioners are considered as an independent party that has no vested interest in the company, so they can protect the interest of minority shareholders. Secondly, independent commissioners are also considered to be able to mitigate agency problems that happen because of the majority shareholders’ intention to expropriate minority shareholder’s wealth. Thirdly, trust from the investors and well-run corporate governance in the company will create good profitability for the company.
Some adjustments are made for the definition of independent commisioners. If the independent commissioners’ definition exclude those who have served the company for more than 9 years or have previously worked in the company (INDCOM2), the result is shown in table 5, presented with the regression result before adjustment.
After adjustment on the independent commissioner definition to INDCOM2, the result shows positive impact with a higher significance level to Tobin’s Q than to INDCOM. This result indicates that after serving for more than 9 years or having had previously served as an employee or management
of the company, independent commissioners fail to become an independent party. While to ROA, adjusted independent commissioners variable make insignificant results, which means that adjusted independent commissioners variable have no relationship with the firm’s accounting performance.
The next adjustment to the independent commissioner definition is excluding independent commissioners sample who have previously served as employees or management of the company in the same holding (INDCOM3). The result from regressing INDCOM3 variable to firm performance variable turns out to be insignificant. This outcome indicates that the independent commissioners sample who have previously served as employees or management of the company in the same holding are possibly the factor that previously positively influenced the regression result of INDCOM2.
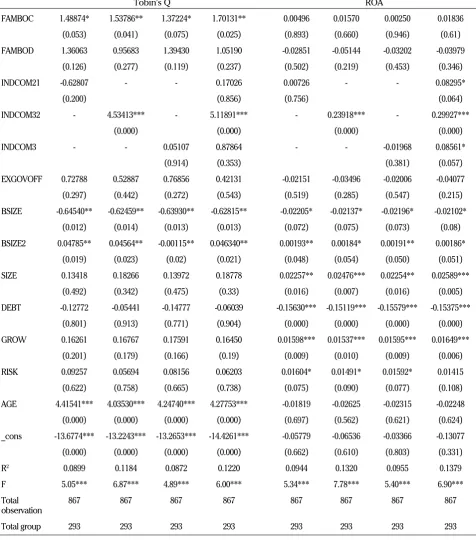
To confirm it, we regressed the proportion of independent commissioners who had served for more than 9 years and was employed in the company (INDCOM21) and the proportion of independent commissioners who were employees of the company in the same group (INDCOM32). The result is presented in table 6.
It turns out that INDCOM32 variable has the most significant positive effect to both Tobin’s Q and ROA. It is probably because previous employees from the same holding company are quite independent but at the same time possess enough knowledge about the company so that they can monitor directors better. This can be researched further in the future.
Tobin's Q ROA
FAMBOC 1.41603* 1.61370** 1.37224* 0.01122 0.014006 0.00250
(0.064) (0.036) (0.075) (0.756) (0.703) (0.946)
FAMBOD 1.54778* 1.45860* 1.39430 -0.01444 -0.02661 -0.03202
(0.084) (0.100) (0.119) (0.733) (0.531) (0.453)
INDCOM 1.48383* - - 0.13171*** -
-(0.097) (0.002)
INDCOM2 - 1.05698** - - 0.03183
-(0.029) (0.170)
INDCOM3 - - 0.05107 - - -0.01968
(0.914) (0.381)
EXGOVOFF 0.65253 0.61028 0.76856 -0.03280 -0.02697 -0.02006
(0.351) (0.382) (0.272) (0.323) (0.420) (0.547)
BSIZE -0.63092** -0.64418** -0.63930** -0.02142* -0.02228* -0.02196*
(0.014) (0.012) (0.013) (0.078) (0.069) (0.073)
BSIZE2 0.04758** 0.04826** -0.00115** 0.00194** 0.00196** 0.00191**
(0.019) (0.017) (0.02) (0.044) (0.044) (0.050)
SIZE 0.16394 0.14749 0.13972 0.02464*** 0.02273** 0.02254**
(0.402) (0.449) (0.475) (0.008) (0.015) (0.016)
DEBT -0.18379 -0.14071 -0.14777 -0.15934*** -0.15589*** -0.15579***
(0.717) (0.781) (0.771) (0.000) (0.000) (0.000)
GROW 0.19593 0.16732 0.17591 0.01757*** 0.01555*** 0.01595***
(0.124) (0.186) (0.166) (0.004) (0.010) (0.009)
RISK 0.06463 0.08896 0.08156 0.01473* 0.01641* 0.01592*
(0.731) (0.635) (0.665) (0.099) (0.067) (0.077)
AGE 4.26160*** 4.56604*** 4.24740*** -0.01313 -0.00588 -0.02315
(0.000) (0.000) (0.000) (0.774) (0.900) (0.621)
_cons -14.2893*** -14.7961*** -13.2653*** -0.16120 -0.11188 -0.03366
(0.000) (0.000) (0.000) (0.227) (0.408) (0.803)
R2 0.0917 0.0949 0.0872 0.1096 0.0973 0.0955
F 5.17*** 5.37*** 4.89*** 6.30*** 5.51*** 5.40***
Total observation
867 867 867 867 867 867
Total group 293 293 293 293 293 293
*** Significant at .01 ** Significant at .05 * Significant at .1
Tobin's Q ROA
FAMBOC 1.48874* 1.53786** 1.37224* 1.70131** 0.00496 0.01570 0.00250 0.01836
(0.053) (0.041) (0.075) (0.025) (0.893) (0.660) (0.946) (0.61)
FAMBOD 1.36063 0.95683 1.39430 1.05190 -0.02851 -0.05144 -0.03202 -0.03979
(0.126) (0.277) (0.119) (0.237) (0.502) (0.219) (0.453) (0.346)
INDCOM21 -0.62807 - - 0.17026 0.00726 - - 0.08295*
(0.200) (0.856) (0.756) (0.064)
INDCOM32 - 4.53413*** - 5.11891*** - 0.23918*** - 0.29927***
(0.000) (0.000) (0.000) (0.000)
INDCOM3 - - 0.05107 0.87864 - - -0.01968 0.08561*
(0.914) (0.353) (0.381) (0.057)
EXGOVOFF 0.72788 0.52887 0.76856 0.42131 -0.02151 -0.03496 -0.02006 -0.04077
(0.297) (0.442) (0.272) (0.543) (0.519) (0.285) (0.547) (0.215)
BSIZE -0.64540** -0.62459** -0.63930** -0.62815** -0.02205* -0.02137* -0.02196* -0.02102*
(0.012) (0.014) (0.013) (0.013) (0.072) (0.075) (0.073) (0.08)
BSIZE2 0.04785** 0.04564** -0.00115** 0.046340** 0.00193** 0.00184* 0.00191** 0.00186*
(0.019) (0.023) (0.02) (0.021) (0.048) (0.054) (0.050) (0.051)
SIZE 0.13418 0.18266 0.13972 0.18778 0.02257** 0.02476*** 0.02254** 0.02589***
(0.492) (0.342) (0.475) (0.33) (0.016) (0.007) (0.016) (0.005)
DEBT -0.12772 -0.05441 -0.14777 -0.06039 -0.15630*** -0.15119*** -0.15579*** -0.15375***
(0.801) (0.913) (0.771) (0.904) (0.000) (0.000) (0.000) (0.000)
GROW 0.16261 0.16767 0.17591 0.16450 0.01598*** 0.01537*** 0.01595*** 0.01649***
(0.201) (0.179) (0.166) (0.19) (0.009) (0.010) (0.009) (0.006)
RISK 0.09257 0.05694 0.08156 0.06203 0.01604* 0.01491* 0.01592* 0.01415
(0.622) (0.758) (0.665) (0.738) (0.075) (0.090) (0.077) (0.108)
AGE 4.41541*** 4.03530*** 4.24740*** 4.27753*** -0.01819 -0.02625 -0.02315 -0.02248
(0.000) (0.000) (0.000) (0.000) (0.697) (0.562) (0.621) (0.624)
_cons -13.6774*** -13.2243*** -13.2653*** -14.4261*** -0.05779 -0.06536 -0.03366 -0.13077
(0.000) (0.000) (0.000) (0.000) (0.662) (0.610) (0.803) (0.331)
R2 0.0899 0.1184 0.0872 0.1220 0.0944 0.1320 0.0955 0.1379
F 5.05*** 6.87*** 4.89*** 6.00*** 5.34*** 7.78*** 5.40*** 6.90***
Total
observation 867 867 867 867 867 867 867 867
Total group 293 293 293 293 293 293 293 293
*** Significant at .01 ** Significant at .05 * Significant at .1
board of commissioners has no impact to firm performance.
The possible reason behind the lacked relationship between the proportion of ex-government officers in the board of commissioners and firm performance is because a balanced positive and negative effect that offset each other. The positive effect is ex-government officer who serves in the board of commissioners can be a good mediator between the company as the business runner and government as the regulator and policy maker. This positive effect can balance the negative effect that comes from the existence of government officer, that the experience of ex-government officer is less relevant with the need for professional people in the company.
The other possibility is because an ex-government officer has indirect effect to firm performance.
According to Fan et al. (2007) and Fisman (2001),
a politically connected firm has lower stock return. Besides, a politically connected firm has higher debt level (Faccio, 2010; Khwaja & Mian, 2005) and lower earnings and financial reporting quality
(Chaney et al., 2011) compared to companies
without political connections.
This research defines the government officer as a person who served as an officer in the central government (Ministry, House of Representatives), regional government (governor), military (Indonesia national army), and state-owned organization or company. This is a broad definition so it maybe possible that one state-owned organization may have a different effect with compared to another organization, resulting in an inconclusive result. Other than that, there are some difficulties in identifying a current or ex-government officer due to the lack of information given in the board of commissioners’ profile in the company annual report. This makes the process of identifying and analyzing the effect of ex-government officers to the firm’s performance difficult to be maximized.
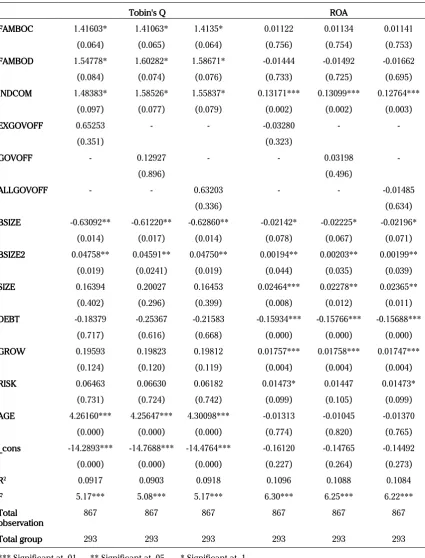
This research also want to know whether the existence of current government officers (GOVOFF) or both current and ex-government officers in the board of commissioners (ALLGOVOFF) has any impact to firm performance.
From table 7, it can be seen the regression result for the proportion of current government officers in the board of commissioners (GOVOFF) and the proportion of both current and ex-government officers in the board of commissioners (ALLGOVOFF) are not giving significant result to Tobin’s Q and ROA. It means that variables related to government officer (current or ex-) have no effect to firm performance.
As we can see from table 4, the regression result for the board size variable (BSIZE and BSIZE2) and firm performance gives significant result, to both Tobin’s Q and ROA. Thus we can conclude that board size has a quadratic relationship with the firm’s market and accounting performance.
Regression result from variable BSIZE and BSIZE2 to Tobin’s Q have -0.6309 and 0.0476 coefficients consecutively, while to ROA, coefficients of variable BSIZE and BSIZE2 are -0.0214 and 0,0019 consecutively. The negative coefficient of BSIZE and positive coefficient of BSIZE2 show that BSIZE has quadratic relationship with the performance variable, Tobin’s Q and ROA. The minimum point of the quadratic curve is 6.63 for Tobin’s Q result and 5.5 for ROA result. This result means that the larger the size of the board, the firm performance decreases until a minimum point, before it bounces back and increases again after the minimum point is reached.
The result does not completely agree with the proposed hypothesis in the earlier section. The
proposed hypothesis was that larger board size
positively affects firm performance, but too large board size negatively affects firm performance.
Tobin's Q ROA
FAMBOC 1.41603* 1.41063* 1.4135* 0.01122 0.01134 0.01141
(0.064) (0.065) (0.064) (0.756) (0.754) (0.753)
FAMBOD 1.54778* 1.60282* 1.58671* -0.01444 -0.01492 -0.01662
(0.084) (0.074) (0.076) (0.733) (0.725) (0.695)
INDCOM 1.48383* 1.58526* 1.55837* 0.13171*** 0.13099*** 0.12764***
(0.097) (0.077) (0.079) (0.002) (0.002) (0.003)
EXGOVOFF 0.65253 - - -0.03280 -
-(0.351) (0.323)
GOVOFF - 0.12927 - - 0.03198
-(0.896) (0.496)
ALLGOVOFF - - 0.63203 - - -0.01485
(0.336) (0.634)
BSIZE -0.63092** -0.61220** -0.62860** -0.02142* -0.02225* -0.02196*
(0.014) (0.017) (0.014) (0.078) (0.067) (0.071)
BSIZE2 0.04758** 0.04591** 0.04750** 0.00194** 0.00203** 0.00199**
(0.019) (0.0241) (0.019) (0.044) (0.035) (0.039)
SIZE 0.16394 0.20027 0.16453 0.02464*** 0.02278** 0.02365**
(0.402) (0.296) (0.399) (0.008) (0.012) (0.011)
DEBT -0.18379 -0.25367 -0.21583 -0.15934*** -0.15766*** -0.15688***
(0.717) (0.616) (0.668) (0.000) (0.000) (0.000)
GROW 0.19593 0.19823 0.19812 0.01757*** 0.01758*** 0.01747***
(0.124) (0.120) (0.119) (0.004) (0.004) (0.004)
RISK 0.06463 0.06630 0.06182 0.01473* 0.01447 0.01473*
(0.731) (0.724) (0.742) (0.099) (0.105) (0.099)
AGE 4.26160*** 4.25647*** 4.30098*** -0.01313 -0.01045 -0.01370
(0.000) (0.000) (0.000) (0.774) (0.820) (0.765)
_cons -14.2893*** -14.7688*** -14.4764*** -0.16120 -0.14765 -0.14492
(0.000) (0.000) (0.000) (0.227) (0.264) (0.273)
R2 0.0917 0.0903 0.0918 0.1096 0.1088 0.1084
F 5.17*** 5.08*** 5.17*** 6.30*** 6.25*** 6.22***
Total
observation 867 867 867 867 867 867 Total group 293 293 293 293 293 293 *** Significant at .01 ** Significant at .05 * Significant at .1
performance is nonlinear. But, the direction of the curve is the on the contrary, that is when the size of the board gets larger, firm performance decreases until a minimum point, before it increases again
into a U-shaped curve. This result follows Coles et
al. (2008) that showed Tobin’s Q and board size
has a U-shaped relationship. According to Coles
et al. (2008), firm performance will be maximized when the size of the board is either very large or very small, due to differences of consultation needs between simple and complex firms. Complex firms in the research are defined according to their diversification level, firm size, and debt levels.
From the description analysis in the earlier section, we can see that the board of commissioners in Indonesia have an average of 4.5 members, with the smallest and largest board size is 2 and 21 respectively. Then, looking back to the data used in this research, it can be seen that firms with a board of commissioners’ size above 9 are big scale businesses with total assets of 46.56 billion on average, such as PT Astra International, Tbk., PT Indofood Sukses Makmur, Tbk., PT Indosat, Tbk., and PT Vale Indonesia, Tbk. On the other hand, firms with board of commissioners’ size around 2 or 3 (338 firms) are small scale businesses with total assets 1,56 billion on the average.
By looking at these conditions, we can conclude
that our research is in line with Coles et al. (2008)
although we define complexity in terms of firm size only. The increasing number of the board of commissioner members will positively affect performance in complex firms while in simple firms, the increasing number of the board of commissioner members will negatively affect firm performance. High-complexity firms definitely need larger board size to sufficiently fulfill the consultation function to management, and vice versa.
MANAGERIAL IMPLICATIONS
As stated in Lefort and Urzua (2008), both board of directors and board of commissioners play
important role as internal governance of the company. This study emphasized that company should understand the impact of its board composition to the firm performance, whether there should be controlling shareholder and his relatives in order to mitigate agency problem, whether there should be independent parties who do not have previous relationship with the company to provide independent advices in nobody’s interest, or whether there should be members from former or current government officer to ease connection with the government. The size of the board can also affect firm performance.
By balancing the proportion of insiders (controlling shareholder and his family) and outsiders (independent commissioners) in the board of commissioners, their positive contribution will be enhanced and both parties will not be able to abuse their power. The proportion of government officer in the board of commissioner is found to have no impact to firm performance, thereby the company should pay more attention to individual competence rather than only to his title. Furthermore, firm complexity such as firm size, diversification level, and debt level, should be taken into consideration when the company want to determine its board size.
CONCLUSION
impact on the performance of accounting firms (ROA).
Significant positive correlation was also found in the proportion of independent commissioners to the value of Tobin’s Q and ROA, with higher levels of significance in ROA. The independent commissioner is deemed to protect the interests of the minority shareholders from expropriation of wealth that may be done by the majority shareholders. Furthermore, we found that independent commissioners who have served for less than 9 years and was not a former employee of the company, have a positive association with a higher level of significance to the Tobin’s Q. These results indicate that after serving for more than 9 years or were once the company’s employees, independent commissioners can no longer be considered as independent parties. Yet, independent commissioners who were former employees in a business group and, have highly significant positive result to Tobin’s Q and ROA. This means that they can be considered a fairly independent party yet they have enough knowledge about the company so they are able to supervise competently.
The proportion of ex-government officials in the board of commissioners is found to have no significant relationship with firm performance Tobin’s Q and ROA. We suspect the negative effect of the ex-official commissioner who lacked professional experience is neutralized by the positive effect arising from ability to provide access to the regulator.
The result of the study to test the effect of the board of commissioner size on firm performance indicates that the size of the board has a quadratic relationship (U-shaped curve) with Tobin’s Q and ROA. When the board size is small, the performance of the company will decrease until it reaches a minimum point, then the performance
of the company scaled back increasing in line with the board after the minimum point. The minimum value of board size is 6.63 on Tobin’s Q and 5.5 on ROA. This finding may be due to the different needs of consultation between companies with high and low complexity. Performance of the company will increase with increasing number of board members in companies with high complexity, while the company’s performance will decrease with increasing number of board members in companies with low complexity.
This study has several limitations. First, there are limitations in identifying the family members of the controlling shareholder who sit on the board of directors and board of commissioners. By using the last name similarity approach, there is a possibility of family members who do not use the same last name but they are family members of the controlling shareholder, or there are possibly two people with the same last name but they have no family relation. Second, there are also limitations in identifying ex-and current government officials because we rely on the information contained in the profile of the board of commissioners in the company’s annual report only. Third, the limited number of samples due to the limited availability of company published annual reports, because we need to use the information regarding the board of commissioner profile in the annual report.
R E F E R E N C E S
Achmad, T. (2008). Concentrated Family Ownership Structures Weakening Corporate Governance: A Developing Country Story The Case of Indonesian Companies. MAKSI, 8.
Ameer, R., Ramli, F., & Zakaria, H. (2010). A new perspective on board composition and firm performance in an emerging market. Corporate Governance, 10(5), 647–661.
Anderson, R. C., & Reeb, D. M. (2003). Founding-family ownership and firm performance: Evidence from the S&P 500. The Journal of Finance, 58(3), 1301–1328.
Anderson, R. C., & Reeb, D. M. (2004). Board composition: Balancing family influence in S&P 500 firms. Administrative Science Quarterly, 49(2), 209–237.
Anggraini, S. (2013). Pengaruh Efektivitas Peran Komite Audit, Proporsi Komisaris Independen, dan Kualitas Audit terhadap Kualitas Akrual. Tesis Magister Akuntansi Universitas Indonesia
Barontini, R., & Caprio, L. (2006). The effect of family control on firm value and performance: evidence from continental Europe. European Financial Management, 12(5), 689–723.
Bennedsen, M., Kongsted, H. C., & Nielsen, K. M. (2008). The causal effect of board size in the performance of small and medium-sized firms. Journal of Banking & Finance, 32(6), 1098–1109. doi:10.1016/j.jbankfin.2007.09.016
Boubakri, N., Cosset, J.C., & Saffar, W. (2008). Political connections of newly privatized firms. Journal of Corporate Finance,
14(5), 654–673.
Chaney, P. K., Faccio, M., & Parsley, D. (2011). The quality of accounting information in politically connected firms. Journal of Accounting and Economics, 51(1), 58–76.
Chugh, L. C., Meador, J. W., & Kumar, A. S. (2011). Corporate governance and firm performance: evidence from India. Journal of Finance and Accountancy, 7, 1–10.
Claessens, S., Djankov, S., & Lang, L. H. (2000). The separation of ownership and control in East Asian Corporations. Journal of Financial Economics, 58(1-2), 81–112.
Coles, J. L., Daniel, N. D., & Naveen, L. (2008). Boards: Does one size fit all? Journal of Financial Economics, 87(2), 329–356. Darmadi, S. (2011). Board Size and Firm Value: New Evidence from a Two-tier Boardsystem. Paper presented at the 8th
International Annual Symposium on Management, 19March, Surabaya, Indonesia.
Eisenberg, T., Sundgren, S., & Wells, M. T. (1998). Larger board size and decreasing firm value in small firms. Journal of Financial Economics, 48(1), 35–54.
Faccio, M. (2010). Differences between Politically Connected and Nonconnected Firms: A Cross-Country Analysis. Financial Management, 39(3), 905–928.
Fan, J. P., Wong, T. J., & Zhang, T. (2007). Politically connected CEOs, corporate governance, and Post-IPO performance of China’s newly partially privatized firms. Journal of Financial Economics, 84(2), 330–357.
Fisman, R. (2001). Estimating the value of political connections. The American Economic Review, 91(4), 1095–1102
Goldman, E., Rocholl, J., & So, J. (2009). Do politically connected boards affect firm value? Review of Financial Studies, 22(6), 2331–2360.
Hidayat, A. H., & Loe, E.L. (2011). Kinerja Perusahaan Keluarga di Bawah Kepemimpinan Generasi Penerus. Skripsi S1 Bisnis Prasetiya Mulya.
Hillman, A. J., & Dalziel, T. (2003). Boards of Directors and Firm Performance: Integrating Agency and Resource Dependence Perspectives. The Academy of Management Review, 383–396.
Husnan, S. (2001). Corporate Governance and Finance in East Asia. A Study of Indonesia, Republic of Korea, Malaysia, Philiphine, and Thailand.
Ibrahim, H., & Samad, F. A. (2011). Corporate Governance Mechanisms and Performance of Public-Listed Family-Ownership in Malaysia. International Journal of Economics and Finance, 3(1), p105.
Johnson, S., Boone, P., Breach, A., & Friedman, E. (2000). Corporate governance in the Asian financial crisis. Journal of Financial Economics, 58(1), 141–186.
Keputusan Direksi PT Bursa Efek Jakarta Nomor: Kep-305/BEJ/07-2004 Tentang Peraturan Nomor I-A Tentang Pencatatan Saham dan Efek Bersifat Ekuitas Selain Saham yang Diterbitkan oleh Perusahaan Tercatat
Khan, A., & Awan, S. H. (2012). Effect of Board Composition on Firm’s Performance: A Case of Pakistani Listed Companies.
Interdisciplinary Journal of Contemporary Research In Business, 3(10), 853–863.
Khwaja, A. I., & Mian, A. (2005). Do lenders favor politically connected firms? Rent provision in an emerging financial market.
The Quarterly Journal of Economics, 120(4), 1371–1411.
La Porta, R., Lopez-de-Silanes, F., & Shleifer, A. (1999). Corporate ownership around the world. Journal of Finance, 54(2), 471–517.
Lefort, F., & Urzúa, F. (2008). Board independence, firm performance and ownership concentration: Evidence from Chile.
Strategic Management in Latin America, 61(6), 615–622. doi:10.1016/j.jbusres.2007.06.036
Lemmon, M. L., & Lins, K. V. (2003). Ownership structure, corporate governance, and firm value: Evidence from the East Asian financial crisis. The Journal of Finance, 58(4), 1445–1468.
Lester, R. H., Hillman, A., Zardkoohi, A., & Cannella, A. A. (2008). Former government officials as outside directors: The role of human and social capital. Academy of Management Journal, 51(5), 999–1013.
Lins, K. V. (2003). Equity ownership and firm value in emerging markets. Journal of Financial and Quantitative Analysis, 38(1), 159–184.
Mak, Y. T., & Kusnadi, Y. (2005). Size really matters: Further evidence on the negative relationship between board size and firm value. Pacific-Basin Finance Journal, 13(3), 301–318.
Mitton, T. (2002). A cross-firm analysis of the impact of corporate governance on the East Asian financial crisis. Journal of Financial Economics, 64(2), 215–241.
Prabowo, M., & Simpson, J. (2011). Independent directors and firm performance in family controlled firms: evidence from Indonesia. Asian-Pacific Economic Literature, 25(1), 121–132.
Rusmin. (2011). Internal Governance Monitoring and Earnings Quality. Jurnal Bisnis Dan Akuntansi, 13(3), 145–162.
Saiful, Phua, L. K., & Haron, H. (2012). Corporate Governance and Corporate Transparency of Indonesian Listed Companies.
The Indonesian Journal of Accounting Research, 15(3), 201–222.
Schaede, U. (1995). The“ Old Boy” network and government-business relationships in Japan. Journal of Japanese Studies,
21(2), 293–317.
Tabalujan, B. (2002). Family capitalism and corporate governance of family-controlled listed companies in Indonesia.
University of New South Wales Law Journal, 25(2).
Ujunwa, A. (2012). Board characteristics and the financial performance of Nigerian quoted firms. Corporate Governance,
12(5), 656–674.
Villalonga, B., & Amit, R. (2006). How do family ownership, control and management affect firm value? Journal of Financial Economics, 80(2), 385–417.
Wang, D. (2006). Founding Family Ownership and Earnings Quality. Journal of Accounting Research, 44(3), 619–656. Yermack, D. (1996). Higher market valuation of companies with a small board of directors. Journal of Financial Economics,
40(2), 185–211.