http://dx.doi.org/10.17503/Agrivita-2012-34-3-p225-232
IMPROVING STORAGE ROOT PROTEIN CONTENT IN SWEET POTATO
THROUGH OPEN-MATING POLLINATION
Sri Umi Lestari*), Ricky Indri Hapsari and Sutoyo Faculty of Agriculture, Tribhuwana Tunggadewi University Jl. Telaga Warna Blok C Tlogomas Malang 65144 East Java Indonesia *) Corresponding author Phone: +62-341-565500 E-mail: [email protected]
Received: November 2, 2011/ Accepted: October 9, 2012
ABSTRACT
A field experiment was conducted at the Research Station of Brawijaya University from April to August 2009. An augmented randomized complete block design with seven blocks was utilized, seven parental clones as standard treatments and seven half-sib families as augmented treatments. Each block consisted of seven parental clones plus one randomly assigned family of half-sibs. In addition,the first block contained 29 accessions, the 2nd block had 120, the 3rd block had 194, the 4th block had 45, the 5th block had 28, the 6th block had 186, and the 7th block had 108. Ten cuttings of each parental was planted in each block, along with a single plant of each accession. There were five improved clones identified with high protein content and high yield, ranging from 6.00-8.21% dwb and 1.95 to 2.73 kg/plant, respectively. Broad-sense heritability and genetic advance of storage root weight, storage root number, percentage dry matter and protein content were high, whereas vegetative biomass and harvest index were low. The results showed that storage root weight, storage root number, percentage dry matter and protein content could be used as the basis for a crop improvement program in sweet potato.
Keywords: broad-sense heritability, expected genetic advance, improved clones, high yied, protein content, sweet potato
INTRODUCTION
Sweet potatoes (Ipomoea batatas) are usually known as a highly efficient crop producing carbohydrates (Kozai et al., 1999), but generally have very low protein content (Bradbury, 1989),
on average less than 2.5% on a dry weight basis (dwb) for the storage root (Basuki et al., 2002). Improvement of the quality traits, such as protein content, can be doing if the traits showed variabilty (Peterson et al., 1998). Lestari and Basuki (2007)stated that a wide range of protein content in a sweet potato population could be obtained by means of biparental crosses between five high yielding clones (D67, 73-6/2, Boko, JP-23, and JP-33) and two introductory clones (Beniazuma and BIS-214). This population had a protein content from 0 – 15.42% dwb.
Open-mating pollination of seven clones (D67, 73-6/2, Boko, JP-23, JP-33, Beniazuma and BIS-214) generated 1870 seeds, producing a number of accessions for a base population of sweet potato (Lestari et al., 2009). However, this population has not been evaluated for its agronomic and genetic performance. New accessions with high yield (≥ 0.75 kg/plant) and high protein content (≥ 7% dwb) will be selected from this population. Food materials having 10-15% protein energy (PE) ratio can be used as sources of protein (Bradbury, 1989). To reach a PE ratio value of 10%, a sweet potato clone has to contain at least 3% protein. However, AVRDC recommended improving the protein content to greater than 7% (AVRDC, 1982). For genetic performance, the genetic variability, coefficient of genetic variation, heritability and genetic advance of the population should evaluate. According to Fisher et al. (1989), the selection response of the traits depends on genetic variability and heritability. Likewise, a coefficient of genetic variation and genetic advance are also needed by breeders for selection of new genotypes and crop improvement programs (Murthy et al., 2010).
than just using heritability value in estimating the effects of a selection. High genetic advance coupled with high heritability estimates offers the most suitable conditions for selection (Larik et al., 1989). Heritability and genetic advance on yield potential and quality are prerequisites for effective crop improvement (Waqar-Ul-Haq et al., 2008). This study reports the performance of improved clones and the genetic variation, heritability, and genetic advance in sweet potato populations resulting from an open-mating pollination.
MATERIALS AND METHODS
Testing Materials
Seven hundred and ten sweet potato accessions from an open-mating pollination of seven parental clones were evaluated. This accessions were classified in seven half-sib families according to their female parent: D67-OP (29 accessions), 73-6/2-D67-OP (120 accessions), Boko-OP (194 accessions), JP-23-OP (45 accessions), JP-33-OP (28 accessions), Benia-zuma-OP (186 accessions), and BIS-214-OP (108 accessions). Five female parent clones (D67, 73-6/2, Boko, JP-23, and JP-33) among the seven parental clones had a high yield (0.70-1.14 kg/plant) and two other clones (Beniazuma and BIS-214) had a protein content ranging between 4.90 - 6.00% dwb.
Experimental Design
This experiment was conducted at the Research Station of Brawijaya University, Malang, Indonesia, from April to August (in the dry season) in 2009. A field experiment arranged in an Augmented Randomized Complete Block Design with seven blocks. All accessions (710 geno-types), comprising seven half-sib populations, were used as test cultivars with the seven female parents as standard cultivars. The test cultivars were planted as single plants distributed to each of seven blocks at random according to their half-sib family. Therefore, each block was comprised of all parental clones and a half-sib family. Ten cuttings of each parental clone were planted in each block, along
with a single plant of each accession at a spacing of 75 cm in the row and 100 cm between rows. The number of rows in each block was not same, but was dependent on the number of accessions in each half-sib population. The first block from D67-OP contained 29 accessions, the 2nd block from 73-6/2-OP had 120, the 3rd block from Boko-OP had 194, the 4th block from JP-23-OP had 45, the 5th block from JP-33-OP had 28, the 6th block from Beniazuma-OP had 186, and the 7th block from BIS-214-OP had 108. Several traits such as fresh weight of storage roots, storage root number, % dry matter, protein content, biomass fresh weight and harvest index were measured from all parental clones and a single plant of each accession. Harvest index was measured as the ratio between storage root dry weight and total fresh weight, reported as the percent dry weight.
Data Analysis
The analysis of standard cultivars carried out to estimate the influence of environmental factors (2E), whereas the test cultivars used to estimate the phenotypic variance (2P). The analysis of variance based on a technique proposed by Sharma (2006) (Table 1). If there was a significant difference among the tested cultivars, selected genotypes (YV) were compared against the average of the standard cultivars (YC) by the value of Least Significant Increase (LSI). If YV > (YC+ LSI), a significance at level = 0.05 or at = 0.01 was evident (Petersen, 1994), and the selected genotypes were the improved clones.
where: tα = t value from Student’s t Distribution.
Table 1. Analysis of variance based on the augmented randomized complete block design (Sharma, 2006)
Source of variation df Mean
Square Computed F
Block (b – 1) M1 M1/M6
Entries (c + v – 1) M2 M2/M6
C (standard cultivar) (c – 1) M3 M3/M6
V (tested cultivar) (v – 1) M4 M4/M6
C x V 1 M5 M5/M6
Error (b – 1)(c – 1) M6
Total N - 1
CV ; CV 2g = ; = mean of a trait measurement
The following steps, the phenotype variance (2P) calculated using the procedure of Ram et al. (1997) :
Calculating the effect of the jth block = (bj), (bj) = (Y.jYijχij)
C 1
where:
C = No. of standard cultivars (= 7)
.j
Y = Block total over standard cultivars (C) and tested cultivars (V)
ij
Y = Means of standard cultivars ij
χ = Total of values of tested cultivars in jth block
Adjusted value for a tested cultivar = Phenotypic value (xi)
xi = xi - bj where:
xi = Observed value (unadjusted) bj = Block effect
Phenotypic variance (2P),
2
P
χ
(
χ
)
/v
1
v
1
2i 2
i
Genotypic variance (2g) =
Broad-sense heritability (H2) = 2g/ 2
P; Expected Genetic Advance (G) = i P H
2
Where i = 1.40 for a 20% selection differential. The values of H2 and G were jointly used to determine the observed traits can be used as the basis for selection in the sweet potato breeding program.
RESULTS AND DISCUSSION
Half-sib Population Distribution
The distribution within seven half-sib families of sweet potato showed a wide diversity of storage root protein content and root yield (Figure 1). The wide diversity of the traits was also indicated by the coefficients of genetic variation of 27.51% and 58.40% (Table 2) and genetic variance of 0.37 + 0.21 and 0.19 + 0.12 (Table 4), respectively.
Figure 1. Half-sib population produced through open-mating pollination among seven clones
Table 2. ANOVA of the protein content and fresh storage root weight/plant in half-sib populations
Source of variation df
Mean Square of Storage root protein content
(% dwb)
Fresh storage root weight (kg/plant)
Block 6 10.12** 8.93**
Entries 716 1.71** 0.57**
C (standard cultivars) 6 19.55** 0.34**
V (tested cultivars) 709 1.21** 0.57**
C x V 1 248.64** 0.45**
Error 36 0.04 0.01
Total
CV = 20.03
CV 2g= 27.51
= 2.05
CV = 11.47
CV 2g= 58.40
= 0.89 Remarks: **) significant differences at α = 1% level
The Augmented Randomized Complete Block Design used in a trial provided a high accuracy as indicated by relatively low coefficients of experimental variation (CV) for both traits, ranging from 11% to 20% (Table 2). Thus, the use of the Augmented Randomized Complete Block Design considered sufficient for an experiment as a preliminary evalution, with a number of seeds that are usually not sufficient for an experimental design with replication. Federer and Agavarao (Petersen, 1994) further
described that the Augmented Randomized Complete Block Design was developed by Federer (1961). Using sugarcane, Federer (1961) proposed the application of the Augmented Design as a solution to address the need to limit the number of genotypes used in testing in a field. The Augmented Design is the expansion of the use of the Randomized Block Design using standard cultivars grown in all the blocks. New cultivars planted in each block with no replication. Statistical analysis of the standard cultivars then
0,00 1,00 2,00 3,00 4,00 5,00 6,00 7,00 8,00 9,00
0,00 1,00 2,00 3,00 4,00
S
to
ra
g
e
ro
o
t pr
o
te
in
con
te
nt
(
%
dwb)
Fresh storage root weight (kg/plant)
Half-sib population were produced from the
open-pollination crosses
BA-OP
Boko-OP
73-6/2 OP
BIS-OP
D67-OP
JP-23 OP
used to correct the performance of new cultivars for a valid comparison.
Performance of Improved Clones
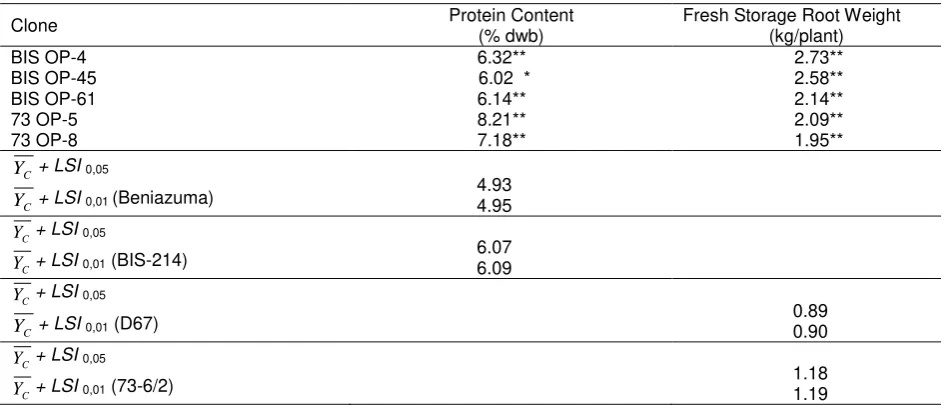
The protein content and fresh storage root yield of sweet potato showed highly significant difference among the tested cultivars (Table 2). Performance of some accessions was very encouraging because they showed high protein content and high-yield. Yield of the accessions varied from 0 to 3.15 kg/plant and protein content varied from 0 to 8.21% dwb (Fig.1). Some of the accessions (D67 and 73-6/2) were compared reasonably well with the high yield check cultivars, which averaged 0.85 and 1.14 kg storage root yield/plant, respectively, whereas check cultivars with high protein content, Beniazuma and BIS-214, ranging from 4.86 to 6.00% dwb. Of the entries, 44.37 % yielded higher than 1.1 kg/plant but only 0.70 % had a protein content higher than 6% dwb. There were only five clones with both high protein content and high yield. These clones were BIS OP-4, BIS OP-45, BIS OP-61, 73-6/2 OP-5 and 73-6/2 OP-8, and the all generated from female BIS-214 and 73-6/2 plants.
When the female parent clones carrying the protein content traits (Beniazuma and BIS-214) and having high yield potential (D67 and
73-6/2) compared with the improved clones, the five selected clones showed highly significant difference from their female parent (Table 3). This was demonstrated by the mean of the traits that were larger than the means of the standard cultivars (
Y
V >Y
C + LSI). As these values derived from the data of this single plant experiment, further testing with greater replication trials are still required.The storage root protein content of the improved clones ranged from 6% to 8% dwb (Table 3), encouraging for efforts to improve sweet potato varieties having high protein content for Indonesia. Currently, the average protein content of sweet potato varieties in Indonesia is less than 2.5% dwb (Basuki et al., 2002), while the improved clones had a 3-fold greater protein content. Further research needed to evaluate the stability of the protein content of the improved clones when planted in several locations and seasons.
Furthermore, phenotypic values can be verified by how much genetic variance existed for the traits concerned. The genetic analysis of the observed traits are presented in Table 4. There was wide genetic diversity for all traits except biomass fresh weight and harvest index.
Table 3. Protein content and fresh storage root weight of five improved clones
Clone Protein Content (% dwb) Fresh Storage Root Weight (kg/plant)
BIS OP-4 6.32** 2.73**
BIS OP-45 6.02 * 2.58**
BIS OP-61 6.14** 2.14**
73 OP-5 8.21** 2.09**
73 OP-8 7.18** 1.95**
C
Y + LSI0,05
C
Y + LSI0,01 (Beniazuma)
4.93 4.95
C
Y + LSI0,05
C
Y + LSI0,01 (BIS-214)
6.07 6.09
C
Y + LSI0,05
C
Y + LSI0,01 (D67)
0.89 0.90
C
Y + LSI0,05
C
Y + LSI0,01 (73-6/2)
1.18 1.19
Estimation of Genetic Variance Components There is a need to know whether genetic variations of a trait significantly different and its variation were wide or narrow. There was a large genetic variability for all traits except biomass fresh weight and harvest index, with greater than one or two standard errors
(
g)
(Table 4). Pinaria et al. (1995) stated that if
2g>
g
r
2g> 2
g, genetic variability is large, but if 2g
≤
g, there is narrow geneticdiversity.
From open-mating pollination with high yielding parent clones and high protein clones generated a wide genetic variation of both traits. Thus, to create extensive genetic variation in protein content and high yield through open-mating pollination can involve parental clones Beniazuma and BIS-214 because they are introductory clones. As indicated by Li (1982),
crossing with introductory clones provided extensive genetic variation for generating new clones.
Estimates of Heritability and Genetic Advance Estimation of genetic parameters for key traits is necessary in order to improve the traits, included heritability and expected genetic advance. Estimates of heritability provide infor-mation about how much of a character transmitted to subsequent generations. Information on herita-bility and genetic advance can give guidelines for breeders in predicting the behavior of key characters in offspring and estimate how much they respond to selection. The availability of the estimated value of heritability, together with the genetic advance for each trait, is a prerequisite for effective crop improvement (Waqar-Ul-Haq et al., 2008).
Table 4. Genetic variance (+ standard errors) of fresh storage root weight, storage root number, % dry weight, protein content, biomass fresh weight, and harvest index
Remarks: (2g) = genotypic variance (=2P– M6);
g = standar errors of genotypic variance, ns = not significant; *= genetic variance significant at 5% level >1 standard error; ** = genetic variance significant at 1% level > 2 standard error
Table 5. Estimated broad-sense heritability (expected genetic advance (G) and mean of traits measurement in sweet potato
Traits Criteria CV
2 g
(%)
G* Criteria
Fresh storage root weight/plant 0.93 high 58.40 0.59 (106.57%) 0.55 high
Number of storage roots/plant 0.87 high 59.21 1.26 (47.55%) 2.64 high
% Dry matter of storage roots 0.58 high 88.56 5.16 (17.35%) 29.73 high
Storage root protein content (% dwb) 0.90 high 27.51 0.81 (16.59%) 4.86 high
Biomass fresh weight/plant 0.00 low 0.00 0.00 (0.00%) 1.04 low
Harvest index 0.00 low 0.00 0.00 (0.00%) 44.40 low
Remarks: H2 = Broad-sense heritability; CV 2g = Coefficient of genetic variation; G = expected genetic advance
*G in unit parameter of each observation and the percent stated in (...); = mean of a trait measurement
Observed trait 2
g + g 2g + 2 g Criteria
Fresh storage root weight (kg/plant) 0.19 + 0.12 0.19 + 0.24 Wide (*)
Storage root number (root number/plant) 0.93 + 0.39 0.93 + 0.78 Wide (**)
% Dry weight 23.32 + 2.34 23.32 + 4.68 Wide (**)
Protein content (% dwb) 0.37 + 0.21 0.37 + 0.42 Wide (*)
Biomass fresh weight (kg/plant) 0.00 + 0.16 0.00 + 0.32 Narrow (Ns)
Broad-sense heritability and expected genetic advance of each trait presented in Table 5. Heritability values describe the genetic variance proportion of the phenotype variance of each trait. Heritability values for the fresh storage root weight, storage root number, percentage dry matters, and protein content were high, greater than 50%. According to McWhirter (1979), the value of heritability can be classified into high heritability (H2 > 50 %), medium heritability (20 % <H2 <50 %), and low heritability (H2 < 20%). Estimates of heritability are used as a tool to describe the reliability of a phenotype, and could help plant breeders make selections of a particular trait when that trait has a large heritability (Unche et al., genetic advance is rather high, and if it is > 10 %, genetic advance is higher. Thus, based on heritability and G, genetic advance should be considered high for storage root fresh weight, storage root number, percentage dry matter and protein content. High genetic advance coupled with high heritability estimates offer the most suitable conditions for selection (Larik et al., 1989). Therefore, the availability of good information on heritability and genetic advance in observed traits is a prerequisite for effective crop improvement (Waqar-Ul-Haq et al., 2008).
CONCLUSIONS
Five improved clones (BIS 4, BIS OP-45, BIS OP-61, 73-6/2 OP-5 and 73-6/2 OP-8) selected from half-sib populations which were generated through open-mating pollination in preliminary trials, had high protein content (6.00-8.21% dwb) and high yield (1.95-2.73 kg/plant). The fresh storage root weight, storage root number, percentage dry matter, and protein content could used as the basis for a crop improvement program in sweet potato.
ACKNOWLEDGMENTS
We thank to the Directorate General of Higher Education, the Ministry of National Education of The Republic Indonesia for financial support through the competitive research grants in 2009 and 2010.
REFERENCES
AVRDC.1982. Progress report for 1981. Shan-hua, Tainan, Taiwan, Republic of China. pp. 84
Basuki, N., Harijono, Damanhuri, S.S. Antarlina, and Y.Widodo. 2002. Nutrient identification in sweet potato germplasm to support agro-industry (In Indonesian). Jurnal Ilmu-ilmu Hayati (Life Sciences) 14 (1): 94-105.
Bradbury, J.H. 1989. Chemical composition of cooked and uncooked sweet potato and its significance for human nutrition. In Sweet potato research and development for small farmers. Ed. by K.T. Mackay, M.K. Palomar, and R.T. Sanico. SEAMEO - SEARCA, Laguna, The Philippines. p.183-195.
Federer, W.T.1961. Augmented designs with one-way elimination of heterogeneity. Bio-metrics 17: 447-473.
Fehr, W.R. 1987. Principles of cultivar develop-ment, theory and technique. Macmillan Publishing Co. New York.
Fisher, R.A., L. O’brien and K.J. Quail. 1989. Early generation selection in Wheat II Grain quality. Aust.J.Agric.Res. 40(6): 1133-1142.
Johnson,H.W.,H.F.Robinson and R.E. Comstock. 1955. Genotypic and phenotypic corre-lation in soybean and their implications in selection. Agron.J. 47: 477-483.
Larik, A.S., H.M.I. Hafiz and A.M. Khushk. 1989. Estimation of genetic parameters in wheat populations derived from inter-cultivaral hybridization. Pakphyton.1: 51-56.
Lestari, S.U., R.I. Hapsari, and Sutoyo. 2009. Evaluation and selection of open-mating pollination in protein rich of sweetpotato (In Indonesian). Research Report on Competitive Grant for First Year. Uni-versity Tribhuwana Tunggadewi. Malang. Lestari, S.U. dan N. Basuki. 2007. Breeding of
sweet potato clones for high protein yield (In Indonesian). Buana Sains. 7(1): 61-70.
Li, I. 1982. Breeding for increased protein content in sweetpotatoes. Ed. by R.L. Villareal and T.D. Griggs. Proceeding of the first international symposium. AVRDC. McWhirter, K.S. 1979. Breeding of cross-pollinated crops. In: G.M. Halloran, R. Knight, K.S. McWhirter, D.H.B. Sparrow, (Eds.). Plant Breeding. Australian Vice-Chancellors Committee Brisbane. pp. 255 Murthy, B.C.K., H.P. Puttaraju and S. Hittalmani. 2010. Genetic variability and correlation studies in selected mulberry (Morus spp.) germplasm accessions. Electronic Journal of Plant Breeding, 1(3): 351-355.
Peterson, C.J., R.A. Graybosch, D.R. Shelton and P.S. Banziger. 1998. Baking quality of hard winter wheat: response of cultivars to environment in the great plains. Euphytica. 100: 157-162.
Pinaria, S., A. Baihaki, R. Setiamihardja and A.A. Daradjad. 1995. Genetic variability for biomass carachters in 53 soybean genotypes (In Indonesian). Zuriat 6(2): 88-92.
Ram, B., B.S. Chaudary, and D.K. Yadav. 1997. General and specific selection indices for single stool stages of selection in sugarcane. Euphytica 95: 39-44. Sharma, J.R. 2006. Statistical and biometrical
techniques in plant breeding. Reprint. New Age International Ltd. Publishers, New Delhi.
Unche P.B, M.B,.Misal, S.B. Borgaonkar, G.V. Godhawale, B.D.Chavan, and D.R. Sawant. 2008. Genetic variability studies in sweet sorghum (Sorghum bicolor L. Moench). Int. J. Plant Sci. 3(1): 16-18. Waqar-Ul-Haq, M.F.Malik, M. Rashid, M. Munir