*Corresponding author:
E-mail: [email protected]
Accredited by DGHE No: 66b/DIKTI/Kep/2011
Media Peternakan, August 2015, 38(2):104-109 DOI: 10.5398/medpet.2015.38.2.104 Available online at http://medpet.journal.ipb.ac.id/
Identification of a Single Nucleotide Polymorphism at
Hinf-1
Enzyme Restriction
Site of
Pit-1
Gene on Indonesian Bali Cattle Population
Jakaria* & R. R. Noor
Department of Animal Production and Technology, Faculty of Animal Science, Bogor Agricultural University Jalan Agatis, Kampus IPB Darmaga Bogor 16680, Indonesia
(Received 06-05-2014; Reviewed 02-06-2014; Accepted 22-05-2015)
ABSTRACT
This study aimed to determine the Pit-1|Hinf-1 gene polymorphism in Bali cattle (Bos javani-cus) as Indonesian native cattle and besides Madura, Pesisir, Aceh, and Katingan cattle breeds as a
comparison. DNA samples were extracted from 488 blood samples consisting of Bali (245 heads), Madura (68 heads), Aceh (25 heads), Pesisir (100 heads) and Katingan (50 heads) cattle. The diversity of the Pit-1|Hinf-1 gene wasere analyzed using PCR-RFLP. Whereas the nucleotide base mutations
were identified by sequencing. Genotyping data were analyzed by calculating the allele frequency, observed heterozygosity (Ho) and expected heterozygosity (He) values as well as Hardry-Weinberg equilibrium test using POPGENE 1.31 program. Whereas, Tthe sequence data were analyzed by us -ing MEGA6 program. The Pit-1|Hinf-1 gene fragment analysis showed that Bali, Madura, Pesisir,
Aceh, and Katingan cattle had high BB genotype, resulting in B allele frequency of 0.982, 0.963, 0.925, 0.960, and 0.960, respectively. Ho and He values were 0.074-0.130 and 0.036-0.139, respectively. Hardy-Weinberg equilibrium test did not significant for all breed populations, except for Aceh cattle population (P<0.05). Mutation from guanine (G) to adenine (A) was found in Pit-1 gene fragment.
Therefore, Pit-1|Hinf-1 gene fragment had low genetic diversity in Bali cattle and other breeds
population.
Key words: Bali cattle, Pit-1|Hinf-1 gene, polymorphism
ABSTRAK
Penelitian ini bertujuan untuk mengevaluasi keragaman gen Pit-1|Hinf-1 pada sapi bali (Bos javanicus) sebagai sapi asli Indonesia, selain itu digunakan sapi Madura, Pesisir, Aceh, dan Katingan
sebagai pembanding. Total sampel darah yang digunakan adalah dari 488 ekor, terdiri atas sapi Bali 245 ekor, sapi Madura 68 ekor, sapi Aceh 25 ekor, sapi Pesisir 100 ekor, dan sapi Katingan 50 ekor diekstraksi DNAnya. Keragaman gen Pit-1|Hinf-1 dianalisis menggunakan teknik PCR-RFLP,
sedangkan perubahan basa nukleotida diidentifikasi dengan teknik sekuensing. Data genotiping dianalisis dengan menghitung frekuensi gen, nilai heterosigositas dan uji kesimbangan Hardy-Weinberg menggunakan program POPGENE 1.31, sedangkan data sekuens dianalisis dengan program MEGA6. Hasil analisis fragmen gen Pit-1|Hinf-1 menunjukkan bahwa sapi Bali, Madura,
Pesisir, Aceh, dan Katingan memiliki genotipe BB yang tinggi, sehingga menghasilkan alel B dengan frekuensi masing-masing 0,982, 0,963, 0.925, 0,960, dan 0,960. Nilai dugaan heterosigositas obser -vasi (Ho) dan hetersigositas harapan (He) adalah 0,074-0,130 dan 0,035-0,129. Hasil uji keseimbangan Hardy-Weinberg tidak berbeda, kecuali pada populasi sapi Aceh (P<0,05). Ditemukan perubahan basa dari guanin (G) menjadi adenin (A) pada situs pemotong enzim Hinf-1 di gen Pit-1. Dengan
demikian, gen Pit-1|Hinf-1 memiliki keragaman genetik yang rendah pada populasi sapi Bali dan
sapi lokal lainnya.
Kata kunci: sapi Bali, gen Pit-1|Hinf-1, polimorfisme
controlling genes expression directly related to growth and milk production. Accordingly, it is plausible that this gene is promising to be used as a candidate of marker-assisted selection (MAS) (Bastos et al., 2006).
Pit-1 gene has been identified and extensively studied in cattle, including Bos taurus (Dybus et al., 2003), Bos INTRODUCTION
indicus/Zebu (Beauchemin et al., 2006; Curi et al., 2006; Mukesh et al., 2008) and Bos primigeneus podolicus (Salvaggi et al., 2011; Sevaggi & Dario, 2011). Besides, the study of this gene was also intensively conducted in native cattle breeds in some countries, including Iranian cattle (Javanmard et al., 2005), Southern Anatolian red cattle (Oztabak et al., 2008), Hanwoo cattle (Han et al., 2010; Seong et al., 2011), Turkey cattle (Ozdemir, 2012), Qinchuan cattle (Zhang et al., 2009) and Piemontese cattle (Ribeca et al., 2014). Even more, Pit-1 gene was also identified in non-cattle species, including chicken (Nie et al., 2008), sheep (Bastos et al., 2006) and buffalo (Javanmard et al., 2005; Misrianti et al., 2010).
Cellularly, Pit-1 gene has been known as a specific
transcription factor controlling expression of growth hormone (GH) and prolactin (PRL) genes in pituitary
anterior. Besides, Pit-1 gene is responsively involved in
protein and hormone syntheses as well as differentiation
and proliferation of pituitary cells (Zhang et al., 2009).
In genomic DNA of cattle, Pit-1 resides in 1q21-q22 region of chromosome 1 (Woolard et al., 1994) which
is flanked by two microsatellites DNA of TGLA57 and RM95 yielding a total of 129 amino acids consisting of 6
exons distantly spaced by 5 introns (Moody et al., 1995).
Restriction fragment length polymorphism (RFLP) provided first evidence of high polymorphism in this
gene at Hinf-1 restriction sites, located at 5 and exon 6 (Woolard et al., 1994). The polymorphism, so-called
Pit-1|Hinf-1 polymorphism, is indicated by base substi-tution at the restriction site, in which G is changed to A (Seong et al., 2011). Yet, the change has no effect on the
primary structure of transcripted polypeptide (silent mutation).
It is interesting that in beef cattle, Pit-1|Hinf-1 poly-morphism significantly affects growth rate of Podolica cattle (Salvagi et al., 2011), Hanwoo cattle (Seong et al., 2011) and Nanyang cattle (Kai et al., 2006). These evidences promoted Pit-1|Hinf-1 polymorphism as a promising gene marker for MAS. However, some re-ports revealed that there was no correlation between the polymorphism and growth performance as well as their carcass traits of beef cattle (Dybus et al., 2003; Rogerio et al., 2006; Thomas et al., 2007; Gill et al., 2010). Despite abundant works, the importance of Pit-1|Hinf-1 poly-morphism was mainly deciphered based on studies on European cattle (Bos taurus) and zebu cattle (Bos indicus). To our knowledge, study on Pit-1|Hinf-1 polymorphism on Indonesian cattle is so far limited to Bali cattle, a domesticated of Banteng (Bos javanicus) (Martojo, 2003) and some other Indonesian beef cattle (DGLS, 2003). Yet, comprehensive studies on the status of Pit-1|Hinf-1 polymorphism on Indonesian cattle remain crucial factors on determining the efficiency of this gene as a marker. This work aims to observe diversity and pattern of Pit-1|Hinf-1 polymorphism in Bali cattle, as a model of Indonesian native breed cattle, and compared with other Indonesian crossing cattle breeds through PCR-RFLP methods clarified by DNA sequencing.
MATERIALS AND METHODS
Cattle Population, Sampling and Genomic DNA Extraction
To obtain diversity and distribution patters of
Pit-1|Hinf-1 polymorphism, 488 cattle were used in this work consisting of 5 cattle breeds of Bali cattle (Bos javanicus) as a model of Indonesian native beef cattle and Indonesian crossed-beef cattle (Madura, Pesisir, Aceh and Katingan beef cattles) (Table 1). The cattle in this study are from different regions, including Bali island (Bali cattle), Sapudi island (Madura cattle), Sumatera island (Aceh and Pesisir cattle) and Kalimantan island (Ketingan cattle).
For genomic DNA extraction, blood samples were drawn randomly from the jugular vein by
veterinar-ians and collected in EDTA containing-9 mL sterilized
Venoject glass tubes. Genomic DNA was extracted by using Genomic DNA mini kit (blood and culture cells) (Geneaid, Taiwan) based on the protocol provided by
manufacturer. Briefly, the extraction procedures con
-sisted of five steps starting from sample preparation
followed by cell lyses and DNA binding. Further steps are washing followed by DNA elution. Concentration and quality of the total genomic DNA were determined by using UV-Vis spectrophotometer. This genomic DNA
was further used as a template for PCR amplification.
PCR Ampification, Genotyping, and Sequencing
The DNA fragment of Intron 5 and exon 6 from
Pit-1 gene was amplified under polymerase chain reac
-tion (PCR) with two flanking primers as following: 5’- AAA CCA TCA TCT CCC TTC TT-3’ and 5’-AAT GTA CAA TGT GCC TTC TGA G-3’ for forward and reverse primers, respectively. The expected amplified fragment size was about 451 bp (Wollard et al., 1994) (Figure 1). For PCR, 25 μL of reaction cocktail was prepared
consisting of genomic DNA as a template, 10X buffer,
10 mM dNTP, 50 mM MgCl2, 30 pmol of forward and reverse primers, and 2.5 U of Taq polymerase (Promega
PCR Core System USA). For the reaction, thermo cycler
was set up with the following parameters: denaturation at 94 oC for 60 s, annealing at 60 oC for 45 s followed by
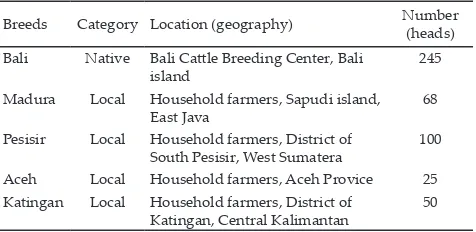
Table 1. The list of Indonesian beef cattle classified based on category, location (geography) and number of samples used in this experiment
Breeds Category Location (geography) Number (heads) Bali Native Bali Cattle Breeding Center, Bali
island
245
Madura Local Household farmers, Sapudi island, East Java
68
Pesisir Local Household farmers, District of South Pesisir, West Sumatera
100
Aceh Local Household farmers, Aceh Provice 25 Katingan Local Household farmers, District of
Katingan, Central Kalimantan
extension step at 72 oC for 1 min. The reaction was per-formed for 35 cycles.
For RFLP analysis, digestion reaction using Hinf-I
restriction enzyme (G↓ANTC) was prepared. The reac-tion cocktail consists of 5.0 μL endonuclease free H2O,
2.5 μL PCR product, 2.5 μL Hinf-I buffer, and 0.5 μL
(5 U) Hinf-I restriction enzyme. The reaction was per -formed at 37 oC for 16 h or overnight. Digestion product was observed by 2% (w/v) agarose electrophoresis in TBE with 85 V and 200 mA for voltage and current, re-spectively, for 45 min. For this purpose, agarose gel was
prepared with 1X TBE buffer, in which 1 g of agarose was diluted in 50 mL of 1X TBE buffer. Following the electrophoresis, the band on agarose gel was visualized
under UV-trans illuminator for genotyping.
Sequencing analysis of intron 5 and exon 6 frag-ment of Pit-1 gene was performed on the sample
showing homozygote (AA, BB) and heterozygote (AB)
genotypes using both forward and reverse primers. Accordingly, 19 samples were sent to a sequencing com-pany 1st BASE, Selangor, Malaysia, for sequencing.
Statistical Analysis
Allele frequency, observed heterozygosity (Ho) and expected heterozygosity (He) values, as well as
Hardy-Weinberg equilibrium test were calculated by using POPGENE 1.31 software (Yeh et al., 2000). Sequencing result of intron 5 and exon 6 fragment of Pit-1 gene was
further analyzed by using MEGA6 program (Tamura et al., 2013).
RESULTS AND DISCUSSION
Amplifcation of Pit-1|Hinf-1 gene fragment from genomic DNA of Bali, Madura, South Pesisir, Aceh
and Katingan cattle, performed at 60 oC in its anneal-ing temperature, is shown in Figure 2. Genotyping analysis revealed three types of genotypes, AA, AB, and
BB were observed in all cattle. Specifically, BB and AB
genotypes were found in Bali, Madura, Katingan and
Aceh cattle, meanwhile AA genotype was found only in Pesisir cattle from West Sumatera (Figure 3). The success on gene amplification is certainly affected by annealing temperature, template DNA quality and PCR
compounds (Viljoen et al., 2005). In this experiment, the fragment was obtained under annealing temperature of 60 oC which is slightly higher than that of reported by Woollard et al. (1994), which is 54 oC.
It is interesting that genotyping result revealed that
AA genotype was only found in one Pesisir cattle. AA
genotype was observed as a single band at about 451 bp in 2% agarose gel. Meanwhile, BB genotype was
repre-sented by two bands with 244 and 204 bp in their sizes,
respectively. Three bands were observed for AB
geno-type for heterozygote cattle, in which the three bands
(451, 244, and 207 bp) were accumulation of unmutated (wild type) and mutated bands. The fragmentation, in meanwhile two- and three bands were observed for BB and AB genotypes, respectively.
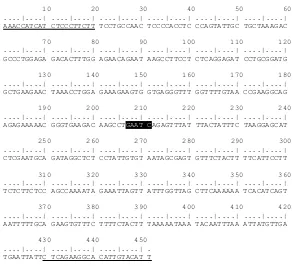
Figure 1. Primary sequence of Pit-1 gene from Bos taurus (GenBank accession number: EF090615). In this sequence, restriction site of Hinf-1 is highlighted in black background (5’-G|ANTC-3’). The underlined sequences indicated the annealing position of forward and revers primers used in this experiment.
26
10 20 30 40 50 60 27
....|....| ....|....| ....|....| ....|....| ....|....| ....|....| 28
AAACCATCAT CTCCCTTCTT TCCTGCCAAC TCCCCACCTC CCAGTATTGC TGCTAAAGAC 29
GCCCTGGAGA GACACTTTGG AGAACAGAAT AAGCCTTCCT CTCAGGAGAT CCTGCGGATG 33
GCTGAAGAAC TAAACCTGGA GAAAGAAGTG GTGAGGGTTT GGTTTTGTAA CCGAAGGCAG 37
AGAGAAAAAC GGGTGAAGAC AAGCCTGAAT CAGAGTTTAT TTACTATTTC TAAGGAGCAT 41
CTCGAATGCA GATAGGCTCT CCTATTGTGT AATAGCGAGT GTTTCTACTT TTCATTCCTT 45
TCTCTTCTCC AGCCAAAATA GAAATTAGTT ATTTGGTTAG CTTCAAAAAA TCACATCAGT 49
Figure 3. Digestion pattern of Pit-1|Hinf-1 gene fragment by Hinf-1 observed in 2% agarose gel. The lane M corresponds to DNA lad-der (marker). Lane 1 is designated as AA genotype, while line 2 and 3 are AB geotype. Lane 4, 5 and 6 are classified as BB genotype.
Figure 2. Amplification product of Pit-1|Hinf-1 gene fragment observed in 2% agarose gel. The lane M corresponds to DNA ladder (marker), while lane 1-10 represent sample number in this experiment.
Genotyping analysis on Bali, Madura, Pesisir, Aceh
and Katingan cattle revealed that allele frequency of Pit-1|Hinf-1 gene fragment was high for B allele, while for A ales was considerably low frequency (Table 2). Table 2 displayed the frequency for B allele was found to be
higher compared to that of A allele for all cattle. In ad
-dition, there was no significant difference on the allele frequency among the cattle used in this experiment, in
which the frequency for Balli, Madura, Pesisir, Aceh and Katingan were 0.982; 0.963; 0.925; 0.960; and 0.950,
respectively. This result indicated that B allele is fixed in all cattle used in this experiment (Table 2). Similar result was observed in Zebu cattle (Bos indicus) (Beauchemin et al., 2006; Mukesh et al., 2008) (Table 3). Contradictive
result was observed on European beef cattle Bos taurus
in which the B allele frequency is decreasing as found in
Angus (0.55) and Hereford (0.790) cattle (Moody et al.,
1995) as well as Limousine cattle (0.730) (Dybus et al.,
2003). Similar evidence of decreasing of B allele frequen-cy was also observed in Bos primigenius cattle, including
Podolica cattle (0.700) (Selvaggi et al., 2011; Selvaggi & Dario, 2011). Interestingly, as reported by Curi et al.
(2006), B allele was found to be low in Zebu cattle (Bos indicus) including Nellore (0.103) and Chanchim (0.117)
cattle originated from Brazil (Table 3). Besides, B allele
was also found to be low in Brangus (0.181) (Thomas et al., 2007), Hanwoo (0.089) (Han et al., 2010) and cross breed of half-Angus and half-Simmental cross breed (0.000) (Curi et al., 2006). The existence of B allele or
BB genotype has significant correlation to carcass qual
-ity specifically in term of back fat thickness, in Hanwoo cattle (Han et al., 2010), and intramuscular fat in Brangus bulls (Thomas et al., 2007). In Qinchuan cattle, AB geno -type was shown to be higher than BB geno-type for body
Table 2. Genotype number and allele frequency of Pit-1|Hinf-1 gene fragment in Indonesian beef cattle
Breeds n Genotype number Allele frequency
AA AB BB A B
Bali 245 0 9 236 0.018 0.982
Madura 68 0 5 63 0.037 0.963
Pesisir 100 1 13 86 0.075 0.925
Aceh 25 0 2 23 0.040 0.960
Katingan 50 0 5 45 0.050 0.950
Note: n= sample number (heads).
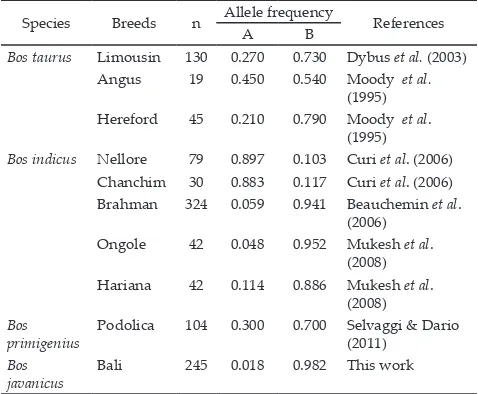
Table 3. Allele frequency distribution of Pit-1|Hinf-1 gene frag-ment in Bos taurus, Bos indicus, Bos primigenius, and Bos javanicus
Species Breeds n Allele frequency References
A B
Bos taurus Limousin 130 0.270 0.730 Dybus et al. (2003)
Angus 19 0.450 0.540 Moody et al. (1995) Hereford 45 0.210 0.790 Moody et al.
(1995)
Bos indicus Nellore 79 0.897 0.103 Curi et al. (2006)
Chanchim 30 0.883 0.117 Curi et al. (2006) Brahman 324 0.059 0.941 Beauchemin et al.
(2006) Ongole 42 0.048 0.952 Mukesh et al.
(2008) Hariana 42 0.114 0.886 Mukesh et al.
(2008) Bos
primigenius
Podolica 104 0.300 0.700 Selvaggi & Dario (2011)
Bos javanicus
Bali 245 0.018 0.982 This work
Note: n= sample number (heads). 65
66 67 68 69 70 71
M 1 2 3 4 5 6 7 8 9 10
72 73
451 bp 500 bp
400 bp
81 82 83 84 85 86 87 88 89 90
1
2
3
Genotype AA AB AB BB BB BB
allele
244 bp 451 bp
207 bp 500 bp
400 bp
weight and shoulder height (Zhang et al., 2009). Yet,
AA genotype was not analyzed due to limited number
of samples (Zhang et al., 2009). In addition, there was
no correlation between polymorphism in Pit-1|Hinf-1
gene fragment and production traits in Limousine cattle
(Dybus et al., 2003).
Observed and expected heterozygocity (Ho and
He, respectively) values indicated that diversities of
Indonesian native cattle (Bali cattle) and Indonesian cross-breed cattle (Madura, Pesisir, Aceh, and Katingan)
were remarkably low. The values were 0.0370-0.130 and 0.036-0.139 for Ho and He, respectively (Table 4). Table 4 also showed that Ho and He values among the
cattle breeds in this experiment were statistically similar.
This indicated gene frequency in each population is in equilibrium state as supported by Hardy-Weinberg
test in this experiment (P>0.05). Yet, Aceh cattle is an
exception in which the gene frequency in this popula-tion was considerably not in equilibrium state based on the test (P<0.05). Altogether, in general, population of
Indonesian cattle breeds is in dynamic equilibrium, but not for Aceh cattle population. This discrepancy might
be due to limited sample number in this experiment.
As Allendrof & Luikart (2007) stated, population size is
one of constraint in Hardy-Weinberg equilibrium status.
Other constraints are random matting, the absence of
mutation, the absence of selection as well as the absence of migration. Hardy-Weinberg equilibrium status was also found in population of Zebu (Mukesh et al., 2008),
red Anatolian (Oztabak et al., 2008), Qinchuan (Zhang et al., 2009), Hanwoo (Han et al., 2010) and Holstein Turkey
(Ozdemer, 2012) cattle.
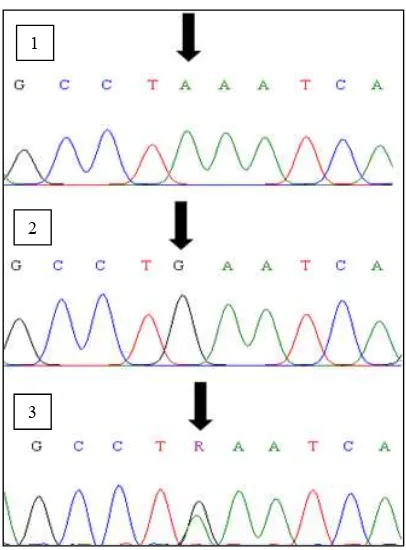
Sequences analysis on A and B allele diversity
found in Bali, Madura, Pesisir, Aceh and Katingan cattle
revealed that G base was changed to A base at the re-striction site of Hinf-I (5-GANTC-3) located in the intron 5 exon 6 fragment of Pit-1 gene (Figure 4). The same mutation (GàA) was also found, and classified as silent mutation, in exon 6 of Pit-1 gene (Seong et al., 2011)
which was speculated to have no direct effect on pheno -type variation (Curi et al., 2006). However, the relation between Pit-1|Hinf-1 polymorphism and carcass
qual-ity are significant for Hanwoo cattle (Seong et al., 2011; Han et al., 2010) as well as the relationship between the polymorphism and intramuscular fat, in Brangus bulls (Thomas et al., 2007) or production traits, in Qinchuan
cattle (Zhang et al., 2009).
Altogether, this result provides evidence for the use of Pit-1|Hinf-1 fragment in intron 5 and exon 6 as
marker candidate for cattle growth (Zhang et al., 2009; Selvaggi et al., 2011) and carcass quality (Thomas et al.,
2007; Han et al., 2010; Ribeca et al., 2014). Yet, the use of
this allele, as well as other desired alleles in Bali cattle specifically and other local breed cattle in Indonesia
remain to be formulated to obtain appropriate breeding strategy to maintain and improve the allele frequency or equilibrium in the population.
CONCLUSION
B allele of Bali cattle and other local breed cattles
had been found to be low in its diversity. This allele was
almost fixed in all cattles and had similar distribution pattern on Pit-1|Hinf-1 gene fragment on intron 5 and exon 6. Polymorphism in this fragment was indicated by the change of G base to A base.
ACKNOWLEDGEMENT
This work is supported by DIPA IPB under the grant No. 22/13.24.4/SPK-PF/2012 (Fundamental
Research Scheme). Authors would like to thank Head of Bali Cattle Breeding Center (BPTU), Province of Bali, for
his support on sample collection for this work. Authors also thank Mr. Eryk Andreas for his technical assistance throughout this work.
1
2
3
Table 4. Heterozygocity values and PIC of Pit-1|Hinf-1 gene fragment in Indonesian beef cattle
Breeds n Values H-W test
Ho He
Bali 245 0.037 0.036 (0.07) ns
Madura 68 0.074 0.071 (0.08) ns
Pesisir 100 0.130 0.139 (0.71) ns
Aceh 25 0.080 0.077 (0.02) *
Katingan 50 0.100 0.095 (0.11) ns
Note: n= sample number (heads); H-W= Hardy-Weinberg; * = signifi-cantly different (P<0.05); ns= insignifisignifi-cantly different (P>0.05).
REFERENCES
Allendrorf, F. W. & G. Luikart. 2007. Conservation and The Genetics of Population. Blackweel Publising USA.
Bastos, E. I. Santos, I. Parmentier, J. L. Castrillo, A. Cravador, H. Guides-Pinto, & R. Revaville. 2006. Ovies aries Pou1f1 gene: cloning, characterization and polimorphism analy-sis. Genetica 126:303-314. http://dx.doi.org/10.1007/s10709-005-0034-6
Beauchemin, V. R., M. G. Thomas, D. E. Franke, & G. A. Sil-ver. 2006. Evaluation of DNA polymorphisms involving growth hormone relative to growth and carcass character-istics in Brahman steers. Genet. Mol. Res. 5:438-447.
Curi, R. A., D. A. Palmieri, L. Suguisawa, H. N. de Oliveira, A. C. Silveira, & C. R. Lopes. 2006. Growth and carcass traits associated with GH1/AluI and POU1F1/HinfI gene polymorphisms in Zebu and crossbred cattle. Genet. Mol. Biol. 29: 56-61. http://dx.doi.org/10.1590/S1415-47572006000100012
Directorate Generale of Livestock Services (DGLS). 2003. National Report on Animal Genetic Resources Indonesia. Directorate General of Livestock Services, Directorate of Livestock Breeding. Indonesia.
Dybus, A., M. Kmiec, Z. Sobek, W. Pietrzyk, & B. Wisniews-ki. 2003. Associations between polymorphisms of growth hormone releasing hormone (GHRH) and pituitary tran-scription factor 1 (PIT1) genes and production traits of Limousine cattle. Arch. Tierz. Dummerstorf 46:527-534.
Gill, J. L., S. C. Bishop, C. McCorquodale, J. L. Williams, & P. Wiener. 2010. Associations between single nucleotide polymorphisms in multiple candidate genes and carcass and meat quality traits in a commercial Angus-cross popu-lation. Meat Sci. 86:985–993. http://dx.doi.org/10.1016/j. meatsci.2010.08.005
Han, S. H., I. C. Cho, M. S. Ko, H. Y. Jeong, H. S. Oh, & S. S. Lee. 2010. Effects of POU1F1 and GH1 genotypes on car-cass traits in Hanwoo cattle. Genes & Genomics 32: 105-109. http://dx.doi.org/10.1007/s13258-009-0708-z
Javanmard, A, N. Asadazadeh, M. H. Banabazi, & J. Tavako-lian. 2005. The allele and genotype frequencies of bovine pituitary specific transcription factor and leptin genes in Iranian cattle and buffalo populations using PCR-RFLP. Iranian J Biotechnol. 3: 104-108.
Martojo, H. 2003. “Indigenous Bali Cattle: The Best Suited Cat-tle Breed for Sustainable Small Farm in Indonesia”. The Chinese Society of Animal Science. 112 Farm Road, Hsi-nhua, Tainan, Taiwan.
Kai, X., C. Hong, W. Shan, C. Xin, L. Bo1, Z. Cun-Fang, L. Chu-Zhao, W. Xin-Zhuang, W. Yi-Min, & N. Hui. 2006. Effect of genetic variations of the POU1F1 gene on growth traits of Nanyang cattle. Acta Genetica Sinica 33:901–907. http:// dx.doi.org/10.1016/S0379-4172(06)60124-8
Misrianti, R., C. Sumantri, & A. Farajallah. 2010. Polymor-phism identification of PIT1 gene in Indonesian buffaloes (Bubalus bubalis) and Holstein-Friesian Cows. Med. Pet. 3:131-136. http://dx.doi.org/10.5398/medpet.2010.33.3.131
Moody, D. E., D. Pomp, & W. Barendse. 1995. Restriction frag-ment length polymorphisms in amplification products of the bovine Pit-1 gene assignment of Pit-1 to bovine chromosome 1. Animal Genetics 26:45-47. http://dx.doi. org/10.1111/j.1365-2052.1995.tb02620.x
Mukesh, M., M. Sodhi, R. C. Sobti, B. Sobti, B. Prakash, R. Kaushik, R. A. K. Aggarwal, & B. P. Mishra. 2008. Analy-sis of bovine pituitary specific transcription factor-HinfI gene polymorphisms in Indian zebu cattle. Livest. Sci. 113:81-86. http://dx.doi.org/10.1016/j.livsci.2007.02.020
Nie, Q, M. Fang, L. Xie, M. Zhou, Z. Liang, Z. Luo, G.Wang, W. Bi, C. Liang, W. Zhang, & X. Zhang. 2008. The PIT1 gene polymorphisms were associated with chicken growth traits. BMC Genet. 9: 20. http://dx.doi.org/10.1186/1471-2156-9-20
Ozdemir, M. 2012. Determination of PIT-1/HINF1 polymor-phism in Holstein and native ear cattle raised as genetic resource in Turkey. Journal Animal and Plant Science 22:25-28.
Oztabak, K., C. Un, D. Tesyafe, I. Akıs, & A. Mengi. 2008. Genetic polymorphisms of osteopontin (OPN), prolac-tin (PRL) and pituitary-specific transcript factor-1 (PIT-1) in South Anatolian and East Anatolian Red cattle. Acta Agric. Scand Section 58: 109-112. http://dx.doi. org/10.1080/09064700802357771
Ribeca C., V. Bonfatti, A. Cecchinato, A. Albera, L. Gallo, & P. Carnier. 2014. Effect of polymorphisms in candidate genes on carcass and meat quality traits in double muscled Piemontese cattle. Meat Sci. 96:1376–1383. http://dx.doi. org/10.1016/j.meatsci.2013.11.028
Curi, R. A., D. A. Palmieri, L. Suguisawa, H. N. de Oliveira, A. C. Silveira, & C. R. Lopes. 2006. Growth and carcass traits associated with GH1/Alu I and POU1F1/Hinf I gene polymorphisms in Zebu and crossbred beef cattle. Gen-et. Mol. Biol. 29: 56-61. http://dx.doi.org/10.1590/S1415-47572006000100012
Selvaggi, M., C. Dario, G. Normanno, A. Dambrosio, & M. Dario. 2011. Analysis of two pit-1 gene polymorphisms and relationships with growth performance traits in Po-dolica young bulls. Livest. Sci. 138: 308–312. http://dx.doi. org/10.1016/j.livsci.2011.01.007
Selvaggi, M. & C. Dario. 2011. Analysis of two Pit-1 gene poly-morphisms: Single nucleotide polymorphisms (SNPs) dis-tribution patterns in Podolica cattle breed. Afric. J. Biotech. 10(55): 11360-11364.
Seong, J., J. D. Oh, I. C. Cheong, K. W. Lee, H. K. Lee, D. S. Suh, G. J. Jeon, K. D. Park, & H. S. Kong. 2011. Associa-tion between polymorphisms of Myf5 and POU1F1 genes with growth and carcass traits in Hanwoo (Korean cattle). Genes & Genomics 33: 425-430. http://dx.doi.org/10.1007/ s13258-011-0006-4
Tamura, K, J. Dudley, M. Nei, & S. Kumar. 2013. MEGA6: Mo-lecular Evolutionary Genetics Analysis (MEGA) software version 6.0. Advance Access published May 7. Oxford Uni-versity Press. Mol. Biol. Evol. http://dx.doi.org/10.1093/ molbev/msm092
Thomas, M. G., R. M. Enns, K. L. Shirley, M. D. Garcia, A. J. Garrett, & G. A. Silver. 2007. Associations of DNA poly-morphisms in growth hormone and its transcriptional reg-ulators with growth and carcass traits in two populations of Brangus bulls. Genet. Mol. Res. 6:222-237.
Viljoen, G. J., L. H. Neil, & J. R. Crowther. 2005. Molecular Di-agnostic PCR handbook. Springer, Netherlands.
Wollard, J., C. B. Schmitz, A. E. Freeman, & C. K. Tuggle. 1994. Rapid communication: HinfI polymorphism at the bo-vine PIT1 locus. J. Animal Science 72:3267. Online version http://jas.fass.org/content/72/12/3267.citation.
Yeh, F. C, R. Yang, T. J. Boyle, Z. Ye, & J. M. Xiyan. 2000. Pop-Gene32, Microsoft Windows-based freeware for popula-tion genetic analysis, version 1.32. Molecular Biology and Biotechnology Centre, University of Alberta, Edmonton, Alberta, Canada.
Zhang, C., B. Liu, H. Chen, X. Lan, C. Lei, Z. Zhang, & R. Zhang.