Journal of Information Technology and Computer Science Volume 1, Number 2, 2016, pp. 53 – 64
Journal Homepage: www.jitecs.ub.ac.id
Cost Optimization of Multi-Level Multi-Product
Distribution Using an Adaptive Genetic Algorithm
Mohammad Zoqi Sarwani1*, Wayan Firdaus Mahmudy1, Agus Naba2
1 Faculty of Computer Science, University of Brawijaya. 8 Veteran Road, Malang, Indonesia, 65145
2 Faculty of Mathematics and Natural Sciences, University of Brawijaya. 2 Veteran Road, Malang, Indonesia, 65145
*[email protected], 1[email protected], 2[email protected]
Received 26 December 2016; accepted 12 January 2017
Abstract. Distribution is the challenging and interesting problem to be solved. Distribution problems have many facets to be resolved because it is too complex problems such as limited multi-level with one product, one-level and multi-product even desirable in terms of cost also has several different versions. In this study is proposed using an adaptive genetic algorithm that proved able to acquire efficient and promising result than the classical genetic algorithm. As the study and the extension of the previous study, this study applies an adaptive genetic algorithm considering the problems of multi-level distribution and combination of various products. This study considers also the fixed cost and variable cost for each product for each level distributor. By using the adaptive genetic algorithm, the complexity of multi-level and multi-product distribution problems can be solved. Based on the cost, the adaptive genetic algorithm produces promising result compared to the existing algorithm
1
Introduction
The shipping activity of the production company to customers called the distribution process. At the time of the distribution process, companies need a strategy to minimize the costs incurred with the objective able to produce a profit. With the limited time in returning profits to some investors, the company should be able to manag time well and quickly in deciding on the right distribution model while still providing minimal costs. Increasingly wide distribution area covered by the company, the more complex the distribution in resolving problems. The wide of the range of the distribution process, implemented with a multi-level model where there are several levels of distributors such as distributor center, dealer and wholesaler [1].
process of distribution.
Some studies related to this study have been done by implementing several algorithms such as system dynamic [2], and fuzzy [3, 4]. The completion of the distribution problem using a system dynamic addreses a model of level, multi-product and consider multi-region shipping. Based on multi-region, the distribution process with some cases give the different results ie when under normal conditions, the shipment is in one region only, but if there are changes in product prices, transportation costs, or etc then the region product's placement is outside. It aims to minimize the costs and product shipment. But when the shipment considers multi-region, it is possible will extend the lead time so it does not consider the time required for the shipment. In addition, the study also only considers a uniform distribution.
Fuzzy is also applied by academicians to solve the problems of fuzzy transportation (distribution) with the function of ranking [3]. Trapezium fuzzy value represents distribution costs resulting in a ranking function. Once it is converted into crisp, which is solved easily using standard transport algorithm. The approach is still too classic to be easily understood and applied in the real world. The benefit is reduced computational complexity. However, the optimal solution produced has the possibility of the same value with standard transport algorithms without fuzzed. This shows that there is no change in the optimal solution of methods offered. While the study, using type-2 fuzzy parameters on the two problems fixed costs of transportation [4]. Unit transportation cost and fixed cost in the first problem and the second problem is the unit transportation cost, fixed cost, supplies, and demands. As with previous studies [3], the proposed methodology is still said to be public so that it can be implemented with type-2 fuzzy parameters for decision-making. But in both of these studies, the topic distribution problems only take two stages from multiple sources to multiple destinations (customer) only without going through the distribution center or retailer, etc.
Another study completed distribution problems using the evolutionary algorithm such as genetic algorithms [5, 6]. Both of those studies solved the multi-level distribution using one-type of the product. As the basis study, genetic algorithm (GA) implemented using the test of GA parameters (population size, the number of generation, the combination of crossover rate and mutation rate) but the model of crossover, mutation, and selection process are not tested [5]. The other study is using the different model of crossover, mutation, and selection process. Based on the same data used also the test performed, the extension of the study before is superior [6].
Sarwani M. Z. et al., Cost Optimization of Multi-Level Multi-Product ... 55
2
Problem Description
The Mathematical formulation used to model the distribution of level multi-product problem into a mathematical, making it easier to understand. On the problem of the distribution of multi-level and multi-product in this study is assumed there is I level of distribution. At each level, there is a distribution of the distributor unit j. On each level, there are a number of P products. Where for every item at every distribution level are Cp costs of different products. In addition, each unit has a CAPp capacity distributor to stock the product. At each distributor unit having an amount vehicles to make deliveries. Where on each vehicle v has a payload capacity of Vcap. In addition, for each vehicle v is used for shipping items has fixed costs of C.
Each unit distributor R can place an order for Op for each product will be serviced by the unit distributors at the level above. For each level of distribution that serves the demand order status is shown by St. If St is 1 then the level in the distribution demand order. Meanwhile, if the value is 0 then the reverse.
Based on a mathematical formulation problems of the distribution of multi-level and multi-product that has been described, it is to calculate the total cost to be incurred can use the following formula in equation (1).
(1)
Description
I represents the number of distribution level J is the number of units on each level distributor
R is the number of subscriber units on each level distributor P is the number of types of products
Xijrp represents the number of units of items to be sent by the distributor j to distributor
r with p product.
Cpijp is the variable cost for each product p at distributor unit j at level i.
CVijr is a fixed cost for shipping items of vehicles from distributor j to distributor r.
Sti is a distributor in status that level i do the delivery.
Besides formulating a mathematical model of distribution problems, in this study, there are also some constraint functions are used as a prerequisite to represent a chromosome so as to provide optimal solutions. The function of the constraints used in this study among others :
2.1 The Function of Demand Order
(2)
Description
J is the number of the sender on the distributor level i P is the number of types of products
Xijp represents the number of units of goods shipped from the distributor j for each
product p
2.2 The Function of the Limits of Inventory For Each Product on The Distributor Unit
(3)
Description
J is the number of units at the distributor level i P is the number of types of products
Xijp represents the number of units of goods shipped from the distributor unit j for each product p.
CAPjp is the capacity of the stock owned by the distributor unit j for each product p
2.3 The Function of The Vehicle Capacity Constraint for Each Unit
Distributor
(4)
Description
J is the number of the sender distributor unit for each level i. V is the number of vehicles for each unit j distributor P is the number of types of products.
Xijvp represents the number of units of goods to be shipped by the distributor j by using the vehicle v.
Vcapijv a vehicle capacity v owned by distributor unit j
3
Genetic Algorithm (GA)
Genetic Algorithm (GA) is a method which is used as the basis for the settlement of the problem of distribution. GA is a proven method capable of solving various problems of distribution of both the multi-level, two-level or multi-level multi products. GA works by mimicking the workings of natural selection [7]. GA has stages that must be passed to produce a solution of which the process of forming the individual as the candidate solution, the reproduction process, and the selection process. At the stage of the selection process, each individual contained in the GA has the value obtained from the evaluation process. The value of the evaluation process is the value that will be used as a benchmark to get a good solution due to the highest value [8].
3.1 Chromosome Representation
The process of chromosome representation is a crucial stage in the genetic algorithm. Representation of the chromosome is a process of encoding a solution to the problems, where the solution to this problem is coded into coding model contained on genetic algorithms [9]. The accuracy in selecting the encoding model for chromosome representation process is important and greatly affect the resulting solutions. In this study, the encoding used is encoding real (real-coded). the selection of the coding model has been based on the issues raised in this study which is about distribution.
Sarwani M. Z. et al., Cost Optimization of Multi-Level Multi-Product ... 57
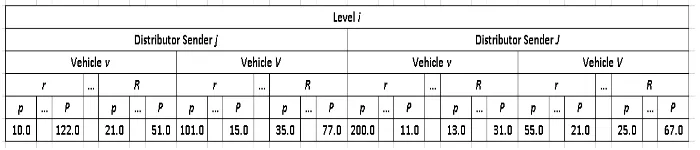
chromosome or individual has several levels depending on the orders. Every level of the chromosome is a segment and there are several sub-segments such as sender distributor unit, delivery vehicles, distributor subscriber units and units of the product ordered. If I is the segment of level, j is the sub-segment for distributor unit shipper, k is the vehicle of shipper, r is the distributor unit ordered as a receiver, and p is a kind of product ordered and every gene for each chromosome or individual is the total of product unit that will be shipped. Every chromosome can be read that the number of product units with p-type ordered by the distributor unit r are shipped by the distributor unit j using vehicle v for each level i.
Fig. 1. Chromosome representation for multi-level multi-product distribution consists sub-segments. The first gene on a chromosome describes that 10 p-type product shipped by distributor unit shipped j to distributor unit receiver r using vehicle v.
3.2 3.2 Calculate The Fitness Function
Each chromosome or individual in the genetic algorithm has a function value which is used as a measuring tool. The value of this function is owned chromosome also determines the individuals who will be elected in the selection process for next generation. The value of functions found on an algorithm popular called the fitness function [10]. In this study, to minimize the cost to be the benchmark goal of fitness. Because the purpose of distribution is contrary to the fitness value obtained, then the fitness value is the inverse of the distribution cost as shown in equation (5) and z as the total cost spent referring to equation (1).
Z
fitness
1
(5)3.3 Reproduction
Reproduction is a process used in genetic algorithms to produce new individuals. The total number of individuals generated in reproduction depend on the value of the reproductive parameters, namely crossover rate and mutation rate. In reproduction consists two operators, there are crossover and mutation. The purpose of the reproduction process is to produce new individuals who adopt the properties of its parent so the new individuals more diverse which mean more explore and exploit in finding the new solutions [11].
perform of crossover operator is the cross-breeding of the two parents to produce a new individual [12]. The number of new individuals is produced from crossover operator is obtained by multiplying the parameter crossover rate (Cr) and the number of population size (popSize).
In this study, the model contained in the crossover operator is the one cut point. This method performs by selecting random cut points of the gene for each level on each chromosome or individual then do exchange genes from two parents that randomly selected and the length of genes are exchanged until the cutoff obtained. Any individual or chromosome is carried out crossover process as many levels it has.
Fig. 2 is shown the crossover process using one cut point
Individual 1 : 1
Fig. 2. is the process of one cut point model in crossover operator using 4rd gene as the cut point to exchange the length gene for both individuals.
Mutation. Besides the crossover operator, in the reproduction process, there is also a mutation operator. In contrast to crossover operator, mutation operator only involves one individual to produce new individuals [13]. The number of new individuals produced in the process of mutation is also obtained by multiplying the parameter mutation rate (Mr) and the population.
In this study, the method used in the process of mutation is a swap model. The perform of this model is a way to redeem the 2 positions of the gene that randomly selected [14]. As well as the process of crossover, mutation process is also done as much as the number of levels which is on each individual.
3.4 Selection
The genetic algorithm is able to provide the best solution because it has the selection process where selecting individuals using fitness value. Any individual who has a greater fitness value has a better chance to be selected as the initialization of the population in the next generation [15].
Sarwani M. Z. et al., Cost Optimization of Multi-Level Multi-Product ... 59
4
Adaptive Genetic Algorithm
Adaptive Genetic Algorithm (AGA) is the proposed algorithm to solve distribution problems. The implementation of AGA still using parameter population size and the number of generations. The difference compared to the classic algorithm is the parameter Cr and Mr functioning as determining the number of new individual results of the process of reproduction. Cr and Mr value are not settling for a whole generation but will change to reflect the average fitness results obtained from current generation with average fitness in the previous generation. Benchmark change of the values of Cr and Mr is obtained from the difference between the average fitness and the threshold that has been set in advance. If the difference between the average fitness is smaller than the threshold, then reproduced the process of exploration and shrink the exploitation and vice versa. The goal is to maintain the diversity of non-convergence results so early and get more efficient results [6].
program adativeGADistribution (Output) const MaxYears = 10;
var gene : 0..MaxGene; pop : 0..popSize;
cr, mr, threshold : Real; begin
population initilization; repeat
Reproduction (); Evaluation(); Selection ();
condition((cAvg-bAvg) <= treshold){ cr += 0.01;
mr -= 0.01; } else { cr -= 0.01; mr += 0.01; }
until gene = MaxGene end.
5
Analysis and Discussion
5.1 Test of Population Size
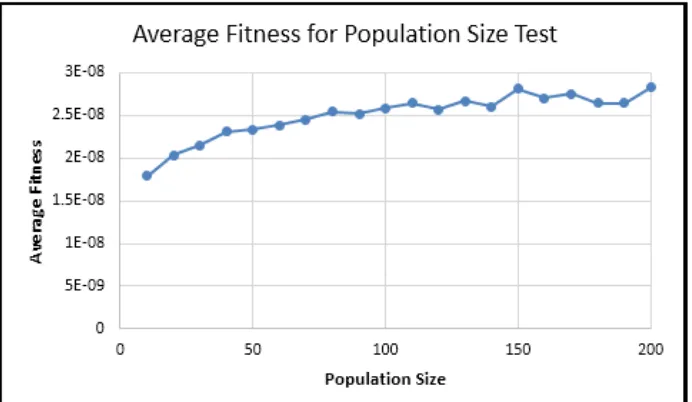
The test is the population size to get the right size that is able to provide optimal solutions. The size of population is performed by the execution of as many as 10 times for each size where the total population to be tested are from 10 to 200. The 10 times of execution is performed to get the average fitness for each size because the stochastic properties of GA give the different result for each execution [16].
Fig. 3. Average fitness for population size test result
In Fig. 3 is shown the test results combined population size. On that result, the average value of fitness has increased along with the growing size of population. It shows that the size of population can determine the diversity of the resulting solutions. However, if the size of population is too large, it has an impact on the execution time but the average value of fitness did not change significantly [17]. Therefore, based on the results of testing the population shown in Fig. 3, it is obtained the population size of 150 which is the exact population size.
5.2 Test of Generation Number
Sarwani M. Z. et al., Cost Optimization of Multi-Level Multi-Product ... 61
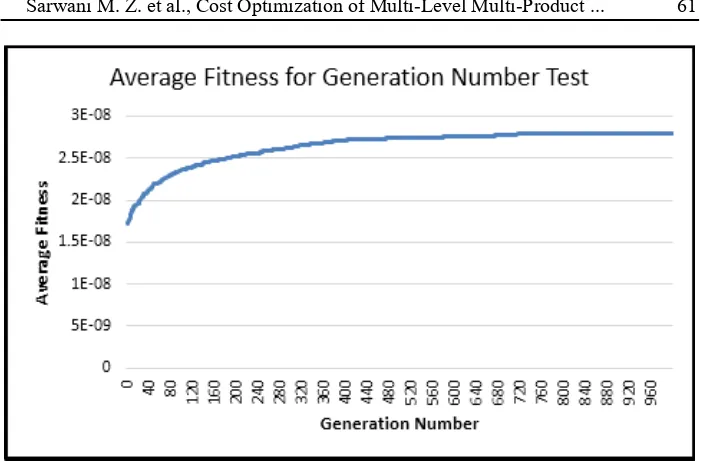
Fig. 4. The result of the generation number test shown by the line of average fitness for each generation number that has executed ten times.
The test results demonstrated by the number of generations that Fig. 4. The greater of the number of generations, the greater the average fitness value is generated. The test results show that there is a convergence point in the generation number 807. It happened because, after 807 generations, the average fitness is unchanged.
5.3 Combination Test of Cr and Mr
Cr and Mr are the GA parameters used in the reproduction process. These parameters affect the total number of new individuals produced by crossover and mutation operator. This combination test used to get the combination of Cr and Mr value which able give the optimal solution.
Table 1. The result of the combination tests shown by average fitness and average cost.
Mr Cr Average Fitness Average Cost
0.1 0.9 2.8685E-08 34861800
0.2 0.8 2.9663E-08 33712500
0.3 0.7 2.8513E-08 35072200
0.4 0.6 2.8723E-08 34815800
0.5 0.5 2.8413E-08 35195100
0.6 0.4 2.7681E-08 36125300
0.7 0.3 2.6690E-08 37467200
0.8 0.2 2.6676E-08 37486700
0.9 0.1 2.6037E-08 38406200
cost is the lowest. Based on the best combination of Cr and Mr, it is known that for the distribution problems, crossover operator provides a major influence on the resulting solutions genetic algorithm. it can be proved with the greater value of Cr than Mr.
5.4 Analysis
After testing the genetic parameters, at this stage is testing the proposed algorithm by the comparison algorithms to determine how well the resulting solution. The parameters results from previous tests is used for the classical genetic algorithm that will be compared with the proposed algorithm. Table 2 is shown the configuration of genetic parameters.
Table 2. The configuration parameters for classical GA regarding the previous tests
Parameters Result
Population Size (popSize) 150
Generation Number 807
Crossover rate (Cr) 0.8
Mutation rate (Mr) 0.2
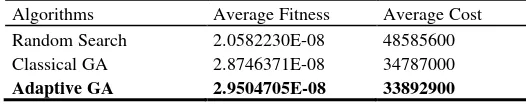
Next is a new test to compare the random search algorithms as an algorithm that is not population-based, the classical genetic algorithm using selected parameters outlined in Table 2, and the proposed algorithm. In this study, the proposed algorithm is an adaptive genetic algorithm that adaptive the results of the fitness function based on the number of new individual candidates generated from the primary process, namely genetic algorithm crossover and mutation. The test results are shown in Table 3 and it can be seen that the adaptive genetic algorithm is superior and able to provide the best average fitness value than the classic algorithms. The difference of proposed algorithm and the classic algorithm is Rp 894.100 and with random search is Rp 14.692.700.
Table 3. The comparison of random search, classic GA, and adaptive GA.
Algorithms Average Fitness Average Cost
Random Search 2.0582230E-08 48585600
Classical GA 2.8746371E-08 34787000
Adaptive GA 2.9504705E-08 33892900
6
Conclusion
Sarwani M. Z. et al., Cost Optimization of Multi-Level Multi-Product ... 63
compared to the classical algorithm and Rp 14.692.700 compared to random search. The minimal result of AGA proves that the adaptive of the number of new individuals produced from crossover and mutation operators in reproduction process affects the result. It shows that the ability of exploration and exploitation to get the diversity of new individuals avoid the trap of local optimum solutions.
Although AGA able to give promising results, it could still be said to be not optimal global because despite applying an adaptive process, the basic algorithm used is still the classic of GA, so they converge early sometimes and should be optimized then it can approach the global optimum solution. For future study the genetic algorithm will be hybridized with local search algorithm.
References
1. Bahrampour, P., M. Safari, and M.B. Taraghdari, Modeling Multi-Product Multi-Stage Supply Chain Network Design, in 1st International Conference on Applied Economics and Business, ICAEB 2015 Modeling2016, Elsevier B.V. p. 70-80.
2. Langroodi, R.R.P. and M. Amiri, A system dynamics modeling approach for a multi-level, multi-product, multi-region supply chain under demand uncertainty. Expert Systems with Applications, 2016. 51: p. 231-244. 3. Ebrahimnejad, A., A simplified new approach for solving fuzzy
transportation problems with generalized trapezoidal fuzzy numbers. Applied Soft Computing Journal, 2014. 19: p. 171-176.
4. Kundu, P., S. Kar, and M. Maiti, Fixed charge transportation problem with type-2 fuzzy variables. Information Sciences, 2014. 255: p. 170-186.
5. Rahmi, A., M.Z. Sarwani, and W.F. Mahmudy, Genetic Algorithms for Optimization of Multi-Level Product Distribution. Accepted in International Journal of Intelligent Engineering & Systems, 2016.
6. Sarwani, M.Z., A. Rahmi, and W.F. Mahmudy, An Adaptive Genetic Algorithm for Cost Optimization of Multi-Stage Supply Chain. Accepted in Journal of Telecommunication, Electronic and Computer Engineering, 2016. 7. Qiongbing, Z., A New Crossover Mechanism for Genetic Algorithms with
Variable-length Chromosomes for Path Optimization Problems. Expert Systems With Applications, 2016.
8. Thakur, M. and A. Kumar, Electrical Power and Energy Systems Optimal coordination of directional over current relays using a modified real coded genetic algorithm : A comparative study. International Journal of Electrical Power and Energy Systems, 2016. 82: p. 484-495.
9. Mahmudy, W.F., R.M. Marian, and L.H.S. Luong, Modeling and optimization of part type selection and loading problems in flexible manufacturing system using real coded genetic algorithms. International Journal of Electrical, Computer, Electronics and Communication Engineering, 2013. 7(4): p. 251-260.
11. Magalhães-Mendes, J., A comparative study of crossover operators for genetic algorithms to solve the job shop scheduling problem. WSEAS Transactions on Computers, 2013. 12: p. 164-173.
12. Welikala, R.A., et al., Genetic algorithm based feature selection combined with dual classification for the automated detection of proliferative diabetic retinopathy. Computerized Medical Imaging and Graphics, 2015. 43: p. 64-77.
13. Wang, L. and D.-b. Tang, An improved adaptive genetic algorithm based on hormone modulation mechanism for job-shop scheduling problem. Expert Systems with Applications, 2011. 38(6): p. 7243-7250.
14. Abdoun, O., J. Abouchabaka, and C. Tajani, Analyzing the Performance of Mutation Operators to Solve the Travelling Salesman Problem. International Journal of Emerging Sciences, 2012. 2: p. 61-77.
15. Karami, A.H. and M. Hasanzadeh, An adaptive genetic algorithm for robot motion planning in 2D complex environments. Computers & Electrical Engineering, 2015. 43: p. 317-329.
16. Horng, S.-C., S.-S. Lin, and F.-Y. Yang, Evolutionary Algorithm for Stochastic Job Shop Scheduling with Random Processing Time. Expert Systems with Applications, 2012. 39(1): p. 3603-3610.