HAPPINESS
REPORT
2017
TABLE OF CONTENTS
1. Overview 2
John F. Helliwell, Richard Layard and Jeffrey D. Sachs
2. Social Foundations of World Happiness 8
John F. Helliwell, Haifang Huang and Shun Wang
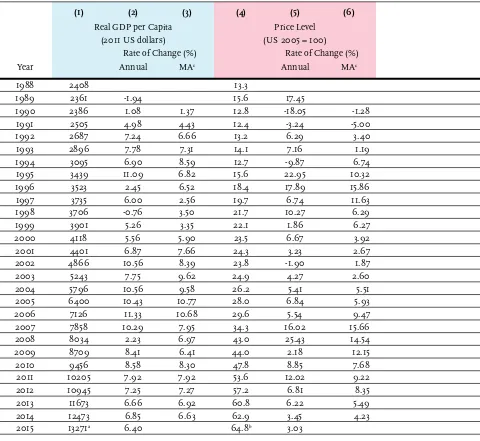
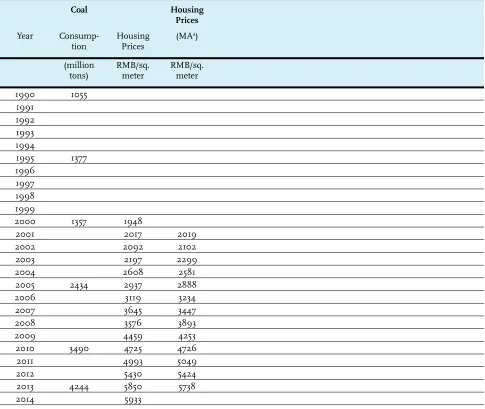
3. Growth and Happiness in China, 1990-2015 48
Richard A. Easterlin, Fei Wang and Shun Wang
4. ‘Waiting for Happiness’ in Africa 84
Valerie Møller, Benjamin Roberts, Habib Tiliouine and Jay Loschky
5. The Key Determinants of Happiness and Misery 122
Andrew Clark, Sarah Flèche, Richard Layard, Nattavudh Powdthavee and George Ward
6. Happiness at Work 144
Jan-Emmanuel De Neve, George Ward
7. Restoring American Happiness 178
Jeffrey D. Sachs
HAPPINESS
REPORT
2017
Editors: John Helliwell, Richard Layard, and Jeffrey Sachs Associate Editors: Jan-Emmanuel De Neve, Haifang Huang and Shun Wang
2
JOHN F. HELLIWELL, RICHARD LAYARD AND JEFFREY D. SACHS
Chapter 1
3 Chapter 1: Overview (John F. Helliwell,
Richard Layard, and Jeffrey D. Sachs)
The irst World Happiness Report was published in April, 2012, in support of the UN High Level Meeting on happiness and well-being. Since then we have come a long way. Happiness is increasingly considered the proper measure of social progress and the goal of public policy. In June 2016, the OECD committed itself “to redeine the growth narrative to put people’s well-being at the centre of governments’ ef-forts”.1 In a recent speech, the head of the UN Development Program (UNDP) spoke against what she called the “tyranny of GDP”, arguing that what matters is the quality of growth.“ Paying more attention to happiness should be part of our efforts to achieve both human and sustainable development” she said.
In February 2017, the United Arab Emirates held a full-day World Happiness meeting, as part of the World Government Summit. Now Inter-national Day of Happines, March 20th, provides a focal point for events spreading the inluence of global happiness research. The launch of this report at the United Nations on International Day of Happines is to be preceded by a World Happiness Summit in Miami, and followed by a three-day meeting on happiness research and policy at Erasmus University in Rotterdam. Interest, data, and research continue to build in a mutually supporting way.
This is the ifth World Happiness Report. Thanks to generous long-term support from the Ernesto Illy Foundation, we are now able to combine the timeliness of an annual report with adequate preparation time by looking two or three years ahead when choosing important topics for detailed research and invited special chapters. Our next report for 2018 will focus on the issue of migration.
In the remainder of this introduction, we high-light the main contributions of each chapter in this report.
Chapter 2: The Social Foundations of World Happiness (John F. Helliwell, Haifang Huang, and Shun Wang)
This report gives special attention to the social foundations of happiness for individuals and nations. The chapter starts with global and regional charts showing the distribution of answers, from roughly 3000 respondents in each of more than 150 countries, to a question asking them to evaluate their current lives on a ladder where 0 represents the worst possible life and 10 the best possible. When the global population is split into ten geographic regions, the resulting distributions vary greatly in both shape and average values. Average levels of happiness also differ across regions and coun-tries. A difference of four points in average life evaluations, on a scale that runs from 0 to 10, separates the ten happiest countries from the ten unhappiest countries.
Although the top ten countries remain the same as last year, there has been some shufling of places. Most notably, Norway has jumped into irst position, followed closely by Denmark, Iceland and Switzerland. These four countries are clustered so tightly that the differences among them are not statistically signiicant, even with samples averaging 3,000 underlying the averages. Three-quarters of the differences among countries, and also among regions, are accounted for by differences in six key variables, each of which digs into a different aspect of life. These six factors are GDP per capita, healthy years of life expectancy, social support (as mea-sured by having someone to count on in times of trouble), trust (as measured by a perceived absence of corruption in government and business), perceived freedom to make life
decisions, and generosity (as measured by recent donations). The top ten countries rank highly on all six of these factors.
4
measures are used as additional elements in the explanation of life evaluations, only positive emotions contribute signiicantly, appearing to provide an important channel for the effects of both perceived freedom and social support.
Analysis of changes in life evaluations from 2005-2007 to 2014-2016 continue to show big international differences in the dynamics of happiness, with both the major gainers and the major losers spread among several regions.
The main innovation in the World Happiness Report 2017 is our focus on the role of social factors in supporting happiness. Even beyond the effects likely to low through better health and higher incomes, we calculate that bringing the social foundations from the lowest levels up to world average levels in 2014-2016 would increase life evaluations by almost two points (1.97). These social foundations effects are together larger than those calculated to follow from the combined effects of bottom to average improvements in both GDP per capita and healthy life expectancy. The effect from the increase in the numbers of people having someone to count on in times of trouble is by itself equal to the happiness effects from the 16-fold increase in average per capita annual incomes required to shift the three poorest countries up to the world average (from about $600 to about $10,000).
Chapter 3: Growth and Happiness in China, 1990-2015 (Richard A. Easterlin, Fei Wang, and Shun Wang)
While Subjective well-being (SWB) is receiving increasing attention as an alternative or comple-ment to GDP as a measure of well-being. There could hardly be a better test case than China for comparing the two measures. GDP in China has multiplied over ive-fold over the past quarter century, subjective well-being over the same period fell for 15 years before starting a recovery process. Current levels are still, on average, less than a quarter of a century ago. These disparate
results relect the different scope of the two measures. GDP relates to the economic side of life, and to just one dimension—the output of goods and services. Subjective well-being, in contrast, is a comprehensive measure of individ-ual well-being, taking account of the variety of economic and noneconomic concerns and aspirations that determine people’s well-being. GDP alone cannot account for the enormous structural changes that have affected people’s lives in China. Subjective well-being, in contrast, captures the increased anxiety and new concerns that emerge from growing dependence on the labor market. The data show a marked decline in subjective well-being from 1990 to about 2005, and a substantial recovery since then. The chapter shows that unemployment and changes in the social safety nets play key roles in explaining both the post-1990 fall and the subsequent recovery.
Chapter 4: ‘Waiting for Happiness’ in Africa (Valerie Møller, Benjamin J. Roberts, Habib Tiliouine, and Jay Loschky)
This chapter explores the reasons why African countries generally lag behind the rest of the world in their evaluations of life. It takes as its starting point the aspirations expressed by the Nigerian respondents in the 1960s Cantril study as they were about to embark on their irst experience of freedom from colonialism. Back then, Nigerians stated then that many changes, not just a few, were needed to improve their lives and those of their families. Fifty years on,
judging by the social indicators presented in this chapter, people in many African countries are still waiting for the changes needed to improve their lives and to make them happy. In short, African people’s expectations that they and their countries would lourish under self-rule and democracy appear not yet to have been met.
5
is the best political system, they are critical of governance in their countries. Despite signiicant improvement in meeting basic needs according to the Afrobarometer index of ‘lived poverty’, popula-tion pressure may have stymied infrastructure and youth development.
Although most countries in the world project that life circumstances will improve in future, Africa’s optimism may be exceptional. African people demonstrate ingenuity that makes life bearable even under less than perfect circum-stances. Coping with poor infrastructure, as in the case of Ghana used in the chapter, is just one example of the remarkable resilience that African people seem to have perfected. African people are essentially optimistic, especially the youth. This optimism might serve as a self-fulilling prophecy for the continent in the years ahead.
Chapter 5: The Key Determinants of Happiness and Misery (Andrew Clark, Sarah Flèche, Richard Layard, Nattavudh Powdthavee, and George Ward)
This chapter uses surveys from the United States, Australia, Britain and Indonesia to cast light on the factors accounting for the huge variation across individuals in their happiness and misery (both of these being measured in terms of life satisfaction). Key factors include economic variables (such as income and em-ployment), social factors (such as education and family life), and health (mental and physical). In all three Western societies, diagnosed mental illness emerges as more important than income, employment or physical illness. In every coun-try, physical health is also important, yet in no country is it more important than mental health.
The chapter deines misery as being below a cutoff value for life satisfaction, and shows by how much the fraction of the population in misery would be reduced if it were possible to eliminate poverty, low education, unemploy-ment, living alone, physical illness and mental illness. In all countries the most powerful effect
would come from the elimination of depression and anxiety disorders, which are the main form of mental illness.
The chapter then uses British cohort data to ask which factors in child development best predict whether the resulting adult will have a satisfying life, and inds that academic qualiications are a worse predictor than the emotional health and behaviour of the child. In turn, the best predic-tor of the child’s emotional health and behaviour is the mental health of the child’s mother.
Schools are also crucially important determi-nants of children’s wellbeing.
In summary, mental health explains more of the variance of happiness in Western countries than income. Mental illness also matters in Indone-sia, but less than income. Nowhere is physical illness a bigger source of misery than mental illness. Equally, if we go back to childhood, the key factors for the future adult are the mental health of the mother and the social ambiance of primary and secondary school.
Chapter 6: Happiness at Work
(Jan-Emmanuel De Neve and George Ward)
This chapter investigates the role of work and employment in shaping people’s happiness, and studies how employment status, job type, and workplace characteristics affect subjective wellbeing.
6
lasting impact even after regaining employment. The data also show that rising unemployment negatively affects everyone, even those still employed. These results are obtained at the individual level, but they also come through at the macroeconomic level, as national unemploy-ment levels are negatively correlated with aver-age national wellbeing across the world.
This chapter also considers how happiness relates to the types of job that people do, and inds that manual labor is systematically cor-related with lower levels of happiness. This result holds across all labor-intensive industries such as construction, mining, manufacturing, transport, farming, ishing, and forestry.
Finally, the chapter studies job quality by consid-ering how speciic workplace characteristics relate to happiness. Beyond the expected inding that those in well-paying jobs are happier and more satisied with their lives and their jobs, a number of further aspects of people’s jobs are strongly predictive of greater happiness—these include work-life balance, autonomy, variety, job security, social capital, and health and safety risks.
Chapter 7: Restoring American Happiness (Jeffrey D. Sachs)
This chapter uses happiness history over the past ten years to show how the Report’s empha-sis on the social foundations of happiness plays out in the case of the United States. The ob-served decline in the Cantril ladder for the United States was 0.51 points on the 0 to 10 scale. The chapter then decomposes this decline according to the six factors. While two of the explanatory variables moved in the direction of greater happiness (income and healthy life expectancy), the four social variables all deterio-rated—the United States showed less social support, less sense of personal freedom, lower donations, and more perceived corruption of government and business. Using the weights estimated in Chapter 2, the drops in the four social factors could explain 0.31 points of the total drop of 0.51 points. The offsetting gains from higher income and life expectancy were together calculated to increase happiness by only 0.04 points, leaving almost half of the overall drop to be explained by changes not accounted for by the six factors.
7
References
OECD (2016) Strategic Orientations of the Secretary-General: For 2016 and beyond, Meeting of the OECD Council at Ministerial Level Paris, 1-2 June 2016. https://www.oecd.org/ mcm/documents/strategic-orientations-of-the-secretary-gen-eral-2016.pdf
8
JOHN F. HELLIWELL, HAIFANG HUANG AND SHUN WANG
Chapter 2
THE SOCIAL FOUNDATIONS
OF WORLD HAPPINESS
9
Introduction
It is now ive years since the publication of the irst World Happiness Report in 2012. Its central purpose was to survey the science of measuring and understanding subjective well-being. Subse-quent World Happiness Reports updated and extended this background. To make this year’s World Happiness Report more useful to those who are coming fresh to the series, we repeat enough of the core analysis in this chapter to make it understandable. We also go beyond previous reports in exploring more deeply the social foundations of happiness.
Our analysis of the levels, changes, and determi-nants of happiness among and within nations continues to be based chiely on individual life evaluations, roughly 1,000 per year in each of more than 150 countries, as measured by an-swers to the Cantril ladder question: “Please imagine a ladder, with steps numbered from 0 at the bottom to 10 at the top. The top of the ladder represents the best possible life for you and the bottom of the ladder represents the worst possible life for you. On which step of the ladder would you say you personally feel you stand at this time?”1 We will, as usual, present
the average life evaluation scores for each country, based on averages from surveys cover-ing the most recent three-year period, in this report including 2014-2016.
This will be followed, as in earlier editions, by our latest attempts to show how six key variables contribute to explaining the full sample of nation-al annunation-al average scores over the whole period 2005-2016. These variables include GDP per capita, social support, healthy life expectancy, social freedom, generosity, and absence of corrup-tion. Note that we do not construct our happiness measure in each country using these six factors— rather we exploit them to explain the variation of happiness across countries. We shall also show how measures of experienced well-being, espe-cially positive emotions, add to life circumstances in explaining higher life evaluations.
We shall then turn to consider how different aspects of the social context affect the levels and distribution of life evaluations among individu-als within and among countries. Previous World Happiness Reports have shown that of the inter-national variation in life evaluations explainable by the six key variables, about half comes from GDP per capita and healthy life expectancy, with the rest lowing from four variables relecting different aspects of the social context. In World Happiness Report 2017 we dig deeper into these social foundations, and explore in more detail the different ways in which social factors can explain differences among individuals and nations in how highly they rate their lives. We shall consider here not just the four factors that measure different aspects of the social context, but also how the social context inluences the other two key variables—real per capita incomes and healthy life expectancy.
10
Measuring and Understanding
Happiness
Chapter 2 of the irst World Happiness Report explained the strides that had been made during the preceding three decades, mainly within psychology, in the development and validation of a variety of measures of subjective well-being. Progress since then has moved faster, as the number of scientiic papers on the topic has continued to grow rapidly,2 and as the
measure-ment of subjective well-being has been taken up by more national and international statistical agencies, guided by technical advice from experts in the ield.
By the time of the irst report, there was already a clear distinction to be made among three main classes of subjective measures: life evaluations, positive emotional experiences (positive affect), and negative emotional experiences (negative
affect) (see Technical Box 1). The Organization for Economic Co-operation and Development (OECD) subsequently released Guidelines on Measuring Subjective Well-being,3 which included
both short and longer recommended modules of subjective well-being questions.4 The
center-piece of the OECD short module was a life evaluation question, asking respondents to assess their satisfaction with their current lives on a 0 to 10 scale. This was to be accompanied by two or three affect questions and a question about the extent to which the respondents felt they had a purpose or meaning in their lives. The latter question, which we treat as an import-ant support for subjective well-being, rather than a direct measure of it, is of a type that has come to be called “eudaimonic,” in honor of Aristotle, who believed that having such a purpose would be central to any relective individual’s assess-ment of the quality of his or her own life.5
Technical Box 1: Measuring Subjective Well-Being
The OECD (2013, p.10) Guidelines on Measuring of Subjective Well-being deine and recommend the following measures of subjective well-being:
“Good mental states, including all of the various evaluations, positive and negative, that people make of their lives and the affective reactions of people to their experiences.
… This deinition of subjective well-being hence encompasses three elements:
1. Life evaluation—a relective assessment on a person’s life or some speciic aspect of it. 2. Affect—a person’s feelings or emotional
states, typically measured with reference to a particular point in time.
3. Eudaimonia—a sense of meaning and purpose in life, or good psychological functioning.”
11
Analysis over the past ten years has clariied what can be learned from different measures of subjective well-being.7 What are the main
messages? First, all three of the commonly used life evaluations (speciically Cantril ladder, satisfaction with life, and happiness with life in general) tell almost identical stories about the nature and relative importance of the various factors inluencing subjective well-being. For example, for several years it was thought (and is still sometimes reported in the literature) hat respondents’ answers to the Cantril ladder question, with its use of a ladder as a framing device, were more dependent on their incomes than were answers to questions about satisfac-tion with life. The evidence for this came from comparing modeling using the Cantril ladder in the Gallup World Poll (GWP) with modeling based on life satisfaction answers in the World Values Survey (WVS). But this conclusion was due to combining survey and method differenc-es with the effects of qudifferenc-estion wording. When it subsequently became possible to ask both questions8 of the same respondents on the
same scales, as was the case in the Gallup World Poll in 2007, it was shown that the estimated income effects and almost all other structural inluences were identical, and a more powerful explanation was obtained by using an average of the two answers.9
People also worried at one time that when questions included the word “happiness” they elicited answers that were less dependent on income than were answers to life satisfaction questions or the Cantril ladder.10 For this
im-portant question, no deinitive answer was available until the European Social Survey (ESS) asked the same respondents “satisfaction with life” and “happy with life” questions, wisely using the same 0 to 10 response scales. The answers showed that income and other key variables all have the same effects on the “happy with life” answers as on the “satisied with life” answers, so much so that once again more powerful explanations come from averaging the two answers.
A related strand of literature, based on GWP data, compared happiness yesterday, which is an experiential/emotional response, with the Cantril ladder, which is equally clearly an evalua-tive measure. In this context, the inding that income has more purchase on life evaluations than on emotions seems to have general applica-bility, and stands as an established result.11
Another previously common view was that changes in life evaluations at the individual level were largely transitory, returning to their base-line as people rapidly adapt to their circumstanc-es. This view has been rejected by four indepen-dent lines of evidence. First, average life
evaluations differ signiicantly and systematical-ly among countries, and these differences are substantially explained by life circumstances. This implies that rapid and complete adaptation to different life circumstances does not take place. Second, there is evidence of long-standing trends in the life evaluations of sub-populations within the same country, further demonstrating that life evaluations can be changed within policy-relevant time scales.12 Third, even though
individual-level partial adaptation to major life events is a normal human response, there is very strong evidence of continuing inluence on well-being from major disabilities and unem-ployment, among other life events.13 The case of
marriage has been subject to some debate. Some results using panel data from the UK suggested that people return to baseline levels of life satisfaction several years after marriage, a inding that has been argued to support the more general applicability of set points.14
How-ever, subsequent research using the same data has shown that marriage does indeed have long-lasting well-being beneits, especially in protecting the married from as large a decline in the middle-age years that in many countries represent a low-point in life evaluations.15
12
comparable residents in the countries from which they have emigrated.16 This conirms that
life evaluations do depend on life circumstances, and are not destined to return to baseline levels as required by the set point hypothesis.
Why Use Life Evaluations for
International Comparisons of
the Quality of Life?
We continue to ind that experiential and evalua-tive measures differ from each other in ways that help to understand and validate both, and that life evaluations provide the most informa-tive measures for international comparisons because they capture the overall quality of life as a whole in a more complete and stable way than do emotional reports based on daily experiences.
For example, experiential reports about happi-ness yesterday are well explained by events of the day being asked about, while life evaluations more closely relect the circumstances of life as a whole. Most Americans sampled daily in the Gallup-Healthways Well-Being Index Survey feel happier on weekends, to an extent that depends on the social context on and off the job. The weekend effect disappears for those employed in a high trust workplace, who regard their superi-or msuperi-ore as a partner than a boss, and maintain their social life during weekdays.17
By contrast, life evaluations by the same respon-dents in that same survey show no weekend effects.18 This means that when they are
answer-ing the evaluative question about life as a whole, people see through the day-to-day and hour-to-hour luctuations, so that the answers they give on weekdays and weekends do not differ.
On the other hand, although life evaluations do not vary by the day of week, they are much more responsive than emotional reports to differences in life circumstances. This is true whether the comparison is among national averages19 or
among individuals.20
Furthermore, life evaluations vary more between countries than do emotions. Thus almost
one-quarter of the global variation in life evalua-tions is among countries, compared to
three-quarters among individuals in the same country. This one-quarter share for life evalua-tions is far higher than for either positive affect (7 percent) or negative affect (4 percent). This difference is partly due to the role of income, which plays a stronger role in life evaluations than in emotions, and is also more unequally spread among countries than are life evalua-tions, emoevalua-tions, or any of the other variables used to explain them. For example, more than 40 percent of the global variation among house-hold incomes is among nations rather than among individuals within nations.21
These twin facts—that life evaluations vary much more than do emotions across countries, and that these life evaluations are much more fully explained by life circumstances than are emotional reports– provide for us a suficient reason for using life evaluations as our central measure for making international compari-sons.22 But there is more. To give a central role
13
patterns varied among the different measures, these differences were far smaller than the international differences in life evaluations.
We would also like to be able to compare in-equality measures for life evaluations with those for emotions, but this is unfortunately not currently possible as the Gallup World Poll emotion questions all offer only yes and no responses. Thus we can know nothing about their distribution beyond the national average shares of yes and no answers. For life evalua-tions, however, there are 11 response categories, so we were able, in World Happiness Report 2016 Update to contrast distribution shapes for each country and region, and see how these evolved with the passage of time.
Why do we use people’s actual life evaluations rather than some index of factors likely to inlu-ence well-being? We have four main reasons:
First, we attach fundamental importance to the evaluations that people make of their own lives. This gives them a reality and power that no expert-constructed index could ever have. For a report that strives for objectivity, it is very import-ant that the rankings depend entirely on the basic data collected from population-based samples of individuals, and not at all on what we think might inluence the quality of their lives. The average scores simply relect what individual respondents report to the Gallup World Poll surveyors.
Second, the fact that life evaluations represent primary new knowledge about the value people attach to their lives means we can use the data as a basis for research designed to show what helps to support better lives. This is especially useful in helping us to discover the relative importance of different life circumstances, thereby making it easier to ind and compare alternative ways to improve well-being.
Third, the fact that our data come from popula-tion-based samples in each country means that we can present conidence regions for our estimates, thus providing a way to see if the rankings are based on differences big enough to be statistically meaningful.
Fourth, all of the alternative indexes depend importantly, but to an unknown extent, on the index-makers’ opinions about what is important. This uncertainty makes it hard to treat such an index as an overall measure of well-being, since the index itself is just the sum of its parts, and not an independent measure of well-being.
We turn now to consider the population-weight-ed global and regional distributions of individual life evaluations, based on how respondents rate their lives. In the rest of this Chapter, the Cantril ladder is the primary measure of life evaluations used, and “happiness” and “subjective well-be-ing” are used interchangeably. All the global analysis on the levels or changes of subjective well-being refers only to life evaluations, specii-cally, the Cantril ladder.
Life Evaluations Around the World
The various panels of Figure 2.1 contain bar charts showing for the world as a whole, and for each of 10 global regions23, the distribution of
14
Figure 2.1: Population-Weighted Distributions of Happiness, 2014-2016
.25
Middle East & North Africa
15
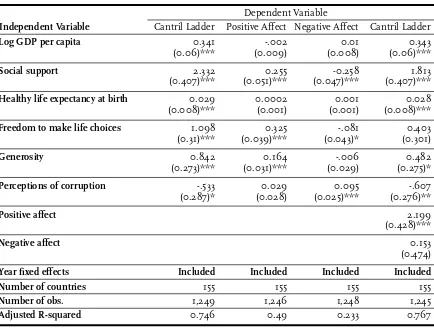
In Table 2.1 we present our latest modeling of national average life evaluations and measures of positive and negative affect (emotion) by country and year. For ease of comparison, the table has the same basic structure as Table 2.1 in the World Happiness Report Update 2016. The major difference comes from the inclusion of data for late 2015 and all of 2016, which increas-es by 131 (or about 12 percent) the number of country-year observations.24 The resulting
changes to the estimated equation are very slight.25 There are four equations in Table 2.1.
The irst equation provides the basis for con-structing the sub-bars shown in Figure 2.2.
The results in the irst column of Table 2.1 explain national average life evaluations in terms of six key variables: GDP per capita, social support, healthy life expectancy, freedom to make life choices, generosity, and freedom from corruption.26 Taken together, these six variables
explain almost three-quarters of the variation in national annual average ladder scores among countries, using data from the years 2005 to 2016. The model’s predictive power is little changed if the year ixed effects in the model are removed, falling from 74.6% to 74.0% in terms of the adjusted R-squared.
The second and third columns of Table 2.1 use the same six variables to estimate equations for national averages of positive and negative affect, where both are based on averages for answers about yesterday’s emotional experiences. In general, the emotional measures, and especially negative emotions, are much less fully explained by the six variables than are life evaluations. Yet, the differences vary greatly from one circum-stance to another. Per capita income and healthy life expectancy have signiicant effects on life evaluations, but not, in these national average data, on either positive or negative affect. The situation changes when we consider social variables. Bearing in mind that positive and negative affect are measured on a 0 to 1 scale, while life evaluations are on a 0 to 10 scale, social support can be seen to have a similar
proportionate effect on positive and negative emotions as on life evaluations. Freedom and generosity have even larger inluences on posi-tive affect than on the ladder. Negaposi-tive affect is signiicantly reduced by social support, freedom, and absence of corruption.
In the fourth column we re-estimate the life evaluation equation from column 1, adding both positive and negative affect to partially implement the Aristotelian presumption that sustained positive emotions are important supports for a good life.27 The most striking
feature is the extent to which the results but-tress a inding in psychology that the existence of positive emotions matters much more than the absence of negative ones. Positive affect has a large and highly signiicant impact in the inal equation of Table 2.1, while negative affect has none.
16
Table 2.1: Regressions to Explain Average Happiness across Countries (Pooled OLS)
Notes: This is a pooled OLS regression for a tattered panel explaining annual national average Cantril ladder responses from all available surveys from 2005 to 2016. See Technical Box 2 for detailed information about each of the predictors. Coeficients are reported with robust standard errors clustered by country in parentheses. ***, **, and * indicate signiicance at the 1, 5 and 10 percent levels respectively.
Dependent Variable
Independent Variable Cantril Ladder Positive Affect Negative Affect Cantril Ladder
Log GDP per capita 0.341 -.002 0.01 0.343
(0.06)*** (0.009) (0.008) (0.06)***
Social support 2.332 0.255 -0.258 1.813
(0.407)*** (0.051)*** (0.047)*** (0.407)***
Healthy life expectancy at birth 0.029 0.0002 0.001 0.028
(0.008)*** (0.001) (0.001) (0.008)***
Freedom to make life choices 1.098 0.325 -.081 0.403
(0.31)*** (0.039)*** (0.043)* (0.301)
Generosity 0.842 0.164 -.006 0.482
(0.273)*** (0.031)*** (0.029) (0.275)*
Perceptions of corruption -.533 0.029 0.095 -.607
(0.287)* (0.028) (0.025)*** (0.276)**
Positive affect 2.199
(0.428)***
Negative affect 0.153
(0.474)
Year ixed effects Included Included Included Included
Number of countries 155 155 155 155
Number of obs. 1,249 1,246 1,248 1,245
17 Technical Box 2: Detailed information about each of the predictors in Table 2.1
1. GDP per capita is in terms of Purchasing Power Parity (PPP) adjusted to constant 2011 international dollars, taken from the World Development Indicators (WDI) released by the World Bank in August 2016. See the ap-pendix for more details. GDP data for 2016 are not yet available, so we extend the GDP time series from 2015 to 2016 using coun-try-speciic forecasts of real GDP growth from the OECD Economic Outlook No. 99 (Edition 2016/1) and World Bank’s Global Economic Prospects (Last Updated: 01/06/2016), after adjustment for population growth. The equa-tion uses the natural log of GDP per capita, as this form its the data signiicantly better than GDP per capita.
2. The time series of healthy life expectancy at birth are constructed based on data from the World Health Organization (WHO) and WDI. WHO publishes the data on healthy life expectancy for the year 2012. The time series of life expectancies, with no adjustment for health, are available in WDI. We adopt the following strategy to construct the time series of healthy life expectancy at birth: irst we generate the ratios of healthy life expectancy to life expectancy in 2012 for countries with both data. We then apply the country-speciic ratios to other years to generate the healthy life expectancy data. See the appendix for more details.
3. Social support is the national average of the binary responses (either 0 or 1) to the Gallup World Poll (GWP) question “If you were in trouble, do you have relatives or friends you can count on to help you whenever you need them, or not?”
4. Freedom to make life choices is the national average of binary responses to the GWP question “Are you satisied or dissatisied with your freedom to choose what you do with your life?”
5. Generosity is the residual of regressing the national average of GWP responses to the question “Have you donated money to a char-ity in the past month?” on GDP per capita.
6. Perceptions of corruption are the average of binary answers to two GWP questions: “Is corruption widespread throughout the government or not?” and “Is corruption widespread within businesses or not?” Where data for government corruption are missing, the perception of business corruption is used as the overall corrup-tion-perception measure.
7. Positive affect is deined as the average of pre-vious-day affect measures for happiness, laughter, and enjoyment for GWP waves 3-7 (years 2008 to 2012, and some in 2013). It is deined as the average of laughter and enjoy-ment for other waves where the happiness question was not asked.
18
Ranking of Happiness by Country
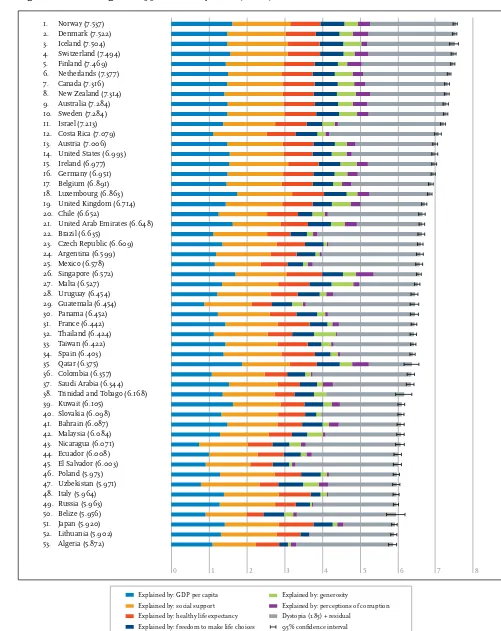
Figure 2.2 (below) shows the average ladder score (the average answer to the Cantril ladder question, asking people to evaluate the quality of their current lives on a scale of 0 to 10) for each country, averaged over the years 2014-2016. Not every country has surveys in every year; the total sample sizes are reported in the statistical appendix, and they are relected in Figure 2.2 by the horizontal lines showing the 95 percent conidence regions. The conidence regions are tighter for countries with larger samples. To increase the number of countries ranked, we also include one that had no 2014-2016 surveys, but did have one in 2013. This brings the num-ber of countries shown in Figure 2.2 to 155.
The length of each overall bar represents the average score, which is also shown in numerals. The rankings in Figure 2.2 depend only on the average Cantril ladder scores reported by the respondents.
Each of these bars is divided into seven seg-ments, showing our research efforts to ind possible sources for the ladder levels. The irst six sub-bars show how much each of the six key variables is calculated to contribute to that country’s ladder score, relative to that in a hypothetical country called Dystopia, so named because it has values equal to the world’s lowest national averages for 2014-2016 for each of the six key variables used in Table 2.1. We use Dystopia as a benchmark against which to compare each other country’s performance in terms of each of the six factors. This choice of benchmark permits every real country to have a non-negative contribution from each of the six factors. We calculate, based on estimates in Table 2.1, that Dystopia had a 2014-2016 ladder score equal to 1.85 on the 0 to 10 scale. The inal sub-bar is the sum of two components: the calculated average 2014-2016 life evaluation in Dystopia (=1.85) and each country’s own predic-tion error, which measures the extent to which life evaluations are higher or lower than predicted
by our equation in the irst column of Table 2.1. The residuals are as likely to be negative as positive.28
19
Our limited choice means that the variables we use may be taking credit properly due to other better variables, or to un-measurable other factors. There are also likely to be vicious or virtuous circles, with two-way linkages among the variables. For example, there is much evi-dence that those who have happier lives are likely to live longer, be most trusting, be more cooperative, and be generally better able to meet life’s demands.30 This will feed back to improve
health, GDP, generosity, corruption, and sense of freedom. Finally, some of the variables are derived from the same respondents as the life evaluations and hence possibly determined by common factors. This risk is less using national averages, because individual differences in personality and many life circumstances tend to average out at the national level.
To provide more assurance that our results are not seriously biased because we are using the same respondents to report life evaluations, social support, freedom, generosity, and corrup-tion, we have tested the robustness of our procedure this year (see Statistical Appendix for more detail). We did this by splitting each country’s respondents randomly into two groups, and using the average values for one group for social support, freedom, generosity, and absence of corruption in the equations to explain average life evaluations in the other half of the sample. The coeficients on each of the four variables fall, just as we would expect. But the changes are reassuringly small (ranging from 1% to 5%) and are far from being statisti-cally signiicant.31
The seventh and inal segment is the sum of two components. The irst component is a ixed number representing our calculation of the 2014-2016 ladder score for Dystopia (=1.85). The second component is the average 2014-2016 residual for each country. The sum of these two components comprises the right-hand sub-bar for each country; it varies from one country to the next because some countries have life evaluations above their predicted values, and
20
Figure 2.2: Ranking of Happiness 2014-2016 (Part 1)
1. Norway (7.537) 2. Denmark (7.522) 3. Iceland (7.504) 4. Switzerland (7.494) 5. Finland (7.469) 6. Netherlands (7.377) 7. Canada (7.316) 8. New Zealand (7.314) 9. Australia (7.284) 10. Sweden (7.284) 11. Israel (7.213) 12. Costa Rica (7.079) 13. Austria (7.006) 14. United States (6.993) 15. Ireland (6.977) 16. Germany (6.951) 17. Belgium (6.891) 18. Luxembourg (6.863) 19. United Kingdom (6.714) 20. Chile (6.652)
21. United Arab Emirates (6.648) 22. Brazil (6.635)
23. Czech Republic (6.609) 24. Argentina (6.599) 25. Mexico (6.578) 26. Singapore (6.572) 27. Malta (6.527) 28. Uruguay (6.454) 29. Guatemala (6.454) 30. Panama (6.452) 31. France (6.442) 32. Thailand (6.424) 33. Taiwan (6.422) 34. Spain (6.403) 35. Qatar (6.375) 36. Colombia (6.357) 37. Saudi Arabia (6.344) 38. Trinidad and Tobago (6.168) 39. Kuwait (6.105)
40. Slovakia (6.098) 41. Bahrain (6.087) 42. Malaysia (6.084) 43. Nicaragua (6.071) 44. Ecuador (6.008) 45. El Salvador (6.003) 46. Poland (5.973) 47. Uzbekistan (5.971) 48. Italy (5.964) 49. Russia (5.963) 50. Belize (5.956) 51. Japan (5.920) 52. Lithuania (5.902) 53. Algeria (5.872)
0 1 2 3 4 5 6 7 8
Explained by: GDP per capita Explained by: social support Explained by: healthy life expectancy Explained by: freedom to make life choices
Explained by: generosity
Explained by: perceptions of corruption Dystopia (1.85) + residual
21 Figure 2.2: Ranking of Happiness 2014-2016 (Part 2)
0 1 2 3 4 5 6 7 8
54. Latvia (5.850) 55. Moldova (5.838) 56. South Korea (5.838) 57. Romania (5.825) 58. Bolivia (5.823) 59. Turkmenistan (5.822) 60. Kazakhstan (5.819) 61. North Cyprus (5.810) 62. Slovenia (5.758) 63. Peru (5.715) 64. Mauritius (5.629) 65. Cyprus (5.621) 66. Estonia (5.611) 67. Belarus (5.569) 68. Libya (5.525) 69. Turkey (5.500) 70. Paraguay (5.493) 71. Hong Kong (5.472) 72. Philippines (5.430) 73. Serbia (5.395) 74. Jordan (5.336) 75. Hungary (5.324) 76. Jamaica (5.311) 77. Croatia (5.293) 78. Kosovo (5.279) 79. China (5.273) 80. Pakistan (5.269) 81. Indonesia (5.262) 82. Venezuela (5.250) 83. Montenegro (5.237) 84. Morocco (5.235) 85. Azerbaijan (5.234) 86. Dominican Republic (5.230) 87. Greece (5.227)
88. Lebanon (5.225) 89. Portugal (5.195)
90. Bosnia and Herzegovina (5.182) 91. Honduras (5.181)
92. Macedonia (5.175) 93. Somalia (5.151) 94. Vietnam (5.074) 95. Nigeria (5.074) 96. Tajikistan (5.041) 97. Bhutan (5.011) 98. Kyrgyzstan (5.004) 99. Nepal (4.962) 100. Mongolia (4.955) 101. South Africa (4.829) 102. Tunisia (4.805)
103. Palestinian Territories (4.775) 104. Egypt (4.735)
105. Bulgaria (4.714) 106. Sierra Leone (4.709)
Explained by: GDP per capita Explained by: social support Explained by: healthy life expectancy Explained by: freedom to make life choices
Explained by: generosity
Explained by: perceptions of corruption Dystopia (1.85) + residual
22
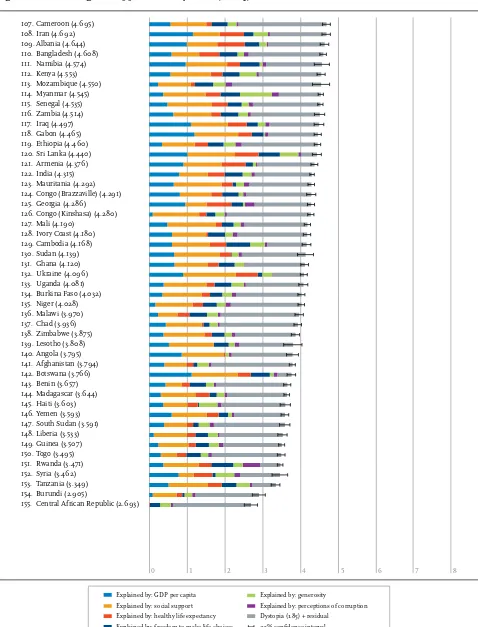
Figure 2.2: Ranking of Happiness 2014-2016 (Part 3)
Explained by: GDP per capita Explained by: social support Explained by: healthy life expectancy Explained by: freedom to make life choices
Explained by: generosity
Explained by: perceptions of corruption Dystopia (1.85) + residual
95% conidence interval
0 1 2 3 4 5 6 7 8
107. Cameroon (4.695) 108. Iran (4.692) 109. Albania (4.644) 110. Bangladesh (4.608) 111. Namibia (4.574) 112. Kenya (4.553) 113. Mozambique (4.550) 114. Myanmar (4.545) 115. Senegal (4.535) 116. Zambia (4.514) 117. Iraq (4.497) 118. Gabon (4.465) 119. Ethiopia (4.460) 120. Sri Lanka (4.440) 121. Armenia (4.376) 122. India (4.315) 123. Mauritania (4.292) 124. Congo (Brazzaville) (4.291) 125. Georgia (4.286)
126. Congo (Kinshasa) (4.280) 127. Mali (4.190)
128. Ivory Coast (4.180) 129. Cambodia (4.168) 130. Sudan (4.139) 131. Ghana (4.120) 132. Ukraine (4.096) 133. Uganda (4.081) 134. Burkina Faso (4.032) 135. Niger (4.028) 136. Malawi (3.970) 137. Chad (3.936) 138. Zimbabwe (3.875) 139. Lesotho (3.808) 140. Angola (3.795) 141. Afghanistan (3.794) 142. Botswana (3.766) 143. Benin (3.657) 144. Madagascar (3.644) 145. Haiti (3.603) 146. Yemen (3.593) 147. South Sudan (3.591) 148. Liberia (3.533) 149. Guinea (3.507) 150. Togo (3.495) 151. Rwanda (3.471) 152. Syria (3.462) 153. Tanzania (3.349) 154. Burundi (2.905)
23
What do the latest data show for the 2014-2016 country rankings? Two features carry over from previous editions of the World Happiness Report. First, there is a lot of year-to-year consistency in the way people rate their lives in different countries. Thus there remains a four-point gap between the 10 top-ranked and the 10 bot-tom-ranked countries. The top 10 countries in Figure 2.2 are the same countries that were top-ranked in World Happiness Report 2016
Update, although there has been some swapping
of places, as is to be expected among countries so closely grouped in average scores. The top four countries are the same ones that held the top four positions in World Happiness Report 2016
Update, with Norway moving up from 4th place
to overtake Denmark at the top of the ranking. Denmark is now in 2nd place, while Iceland remains in 3rd, Switzerland is now 4th, and Finland remains in 5th position. Netherlands and Canada have traded places, with Nether-lands now 6th, and Canada 7th. The remaining three in the top ten have the same order as in the World Happiness Report 2016 Update, with New Zealand 8th, Australia 9th, and Sweden 10th. In Figure 2.2, the average ladder score differs only by 0.25 points between the top country and the 10th country, and only 0.043 between the 1st and 4th countries. The 10
countries with the lowest average life evaluations are somewhat different from those in 2016, part-ly due to some countries returning to the sur-veyed group—the Central African Republic, for example, and some quite large changes in average ladder scores, up for Togo and Afghani-stan, and down for Tanzania, South Sudan, and Yemen. Compared to the top 10 countries in the current ranking, there is a much bigger range of scores covered by the bottom 10 countries. Within this group, average scores differ by as much as 0.9 points, more than one-quarter of the average national score in the group. Tanza-nia and Rwanda have anomalous scores, in the sense that their predicted values, which are based on their performance on the six key variables, are high enough to rank them much higher than do the survey answers.
Despite the general consistency among the top countries scores, there have been many signii-cant changes in the rest of the countries. Look-ing at changes over the longer term, many countries have exhibited substantial changes in average scores, and hence in country rankings, between 2005-2007 and 2014-2016, as shown later in more detail.
When looking at average ladder scores, it is also important to note the horizontal whisker lines at the right-hand end of the main bar for each country. These lines denote the 95 percent conidence regions for the estimates, so that countries with overlapping error bars have scores that do not signiicantly differ from each other. Thus it can be seen that the ive top-ranked countries (Norway, Denmark, Iceland, Switzerland, and Finland) have overlapping conidence regions, and all have national aver-age ladder scores either above or just below 7.5. The remaining ive of the top ten countries are closely grouped in a narrow range from 7.377 for Netherlands in 6th place, to 7.284 for Sweden in 10th place.
Average life evaluations in the top 10 countries are thus more than twice as high as in the bottom 10. If we use the irst equation of Table 2.1 to look for possible reasons for these very different life evaluations, it suggests that of the 4 point difference, 3.25 points can be traced to differences in the six key factors: 1.15 points from the GDP per capita gap, 0.86 due to differences in social support, 0.57 to differences in healthy life expectancy, 0.33 to differences in freedom, 0.2 to differences in corruption, and 0.13 to differences in generosity. Income differ-ences are more than one-third of the total
explanation because, of the six factors, income is the most unequally distributed among countries. GDP per capita is 25 times higher in the top 10 than in the bottom 10 countries.32
24
regions and for the world as a whole.33 On
average, however, the countries of Latin America still have mean life evaluations that are higher (by about 0.6 on the 0 to 10 scale) than predict-ed by the model. This difference has been found in earlier work and been considered to represent systematic personality differences, some unique features of family and social life in Latin coun-tries, or some other cultural differences.34 In
partial contrast, the countries of East Asia have average life evaluations below those predicted by
the model, a inding that has been thought to relect, at least in part, cultural differences in response style. It is also possible that both differences are in substantial measure due to the existence of important excluded features of life that are more prevalent in those countries than elsewhere.35 It is reassuring that our
indings about the relative importance of the six factors are generally unaffected by whether or not we make explicit allowance for these regional differences.36
Technical Box 3: Country happiness averages are based on resident populations, sometimes including large non-national populations.
The happiness scores used in this report are in-tended to be representative of resident popula-tions of each country regardless of their citizen-ship. This relects standard census practice, and thereby includes all of the world’s population in the survey frame, as appropriate for a full ac-counting of world happiness. Some countries have very large shares of residents who are not citizens (non-Nationals). This is especially true for member countries of the Gulf Cooperation Council (GCC). In United Arab Emirates and Qatar, for example, non-Nationals are estimated to comprise well over 80% of the country’s total population. The following table compares the happiness scores of GCC countries’ Nationals and non-Nationals over the period from 2014-2016, focusing on those that have suficiently large numbers of survey respondents in both categories of Nationals and non-Nationals (ex-ceeding 300 over the 3-year period).
The table does not include Oman because it was not surveyed between 2014 and 2016. It does not include Qatar because there was only one survey in the period, with the number of Nation-als surveyed being less than 100. We are grateful to Gallup for data and advice on tabulations.
The sources and nature of the differences in life evaluations between migrants and non-migrants deserve more research in a world with increas-ingly mobile populations. We are planning in
World Happiness Report 2018 to do a deeper anal-ysis of migration and its consequences for the happiness of migrants and others in the nations from which and to which they move.
Country
Total population
Nationals
only Non-Nationals
25 Figure 2.3: Changes in Happiness from 2005-2007 to 2014-2016 (Part 1)
Changes from 2005–2007 to 2014–2016 95% conidence interval
Changes in the Levels of Happiness
In this section we consider how life evaluations have changed. For life evaluations, we consider the changes from 2005-2007 before the onset of the global recession, to 2014-2016, the most recent three-year period for which data from the
Gallup World Poll are available. We present irst the changes in average life evaluations. In Figure 2.3 we show the changes in happiness levels for all 126 countries having suficient numbers of observations for both 2005-2007 and 2014-2016.37
-1.5 -1.2 -0.9 -0.6 -0.3 0.0 0.3 0.6 0.9 1.2
1. Nicaragua (1.364) 2. Latvia (1.162) 3. Sierra Leone (1.103) 4. Ecuador (0.998) 5. Moldova (0.899) 6. Bulgaria (0.870) 7. Russia (0.845) 8. Slovakia (0.833) 9. Chile (0.773) 10. Uzbekistan (0.739) 11. Uruguay (0.714) 12. Peru (0.702) 13. Macedonia (0.681) 14. Serbia (0.645) 15. Romania (0.606) 16. Cameroon (0.595) 17. Georgia (0.595) 18. Azerbaijan (0.584) 19. Thailand (0.581) 20. Philippines (0.576) 21. China (0.552) 22. Tajikistan (0.519) 23. El Salvador (0.507) 24. Paraguay (0.491) 25. Germany (0.442) 26. Argentina (0.406) 27. Mongolia (0.346)
28. Palestinian Territories (0.342) 29. Guatemala (0.341)
30. Trinidad and Tobago (0.336) 31. Kyrgyzstan (0.334) 32. Benin (0.327) 33. Turkey (0.327) 34. Bolivia (0.323) 35. Zimbabwe (0.321) 36. Cambodia (0.306) 37. Nepal (0.304) 38. South Korea (0.299) 39. Togo (0.292)
40. Bosnia and Herzegovina (0.283) 41. Colombia (0.275)
26
Figure 2.3: Changes in Happiness from 2005-2007 to 2014-2016 (Part 2)
Changes from 2005–2007 to 2014–2016 95% conidence interval
-1.5 -1.2 -0.9 -0.6 -0.3 0.0 0.3 0.6 0.9 1.2 43. Estonia (0.260)
44. Hungary (0.249) 45. Indonesia (0.243) 46. Poland (0.236) 47. Taiwan (0.233) 48. Kazakhstan (0.222) 49. Israel (0.204) 50. Mali (0.176) 51. Kosovo (0.175) 52. Brazil (0.157) 53. Lebanon (0.154) 54. Kenya (0.153) 55. Chad (0.148)
56. Dominican Republic (0.145) 57. Mauritania (0.143) 58. Czech Republic (0.138) 59. Bangladesh (0.135) 60. Burkina Faso (0.122) 61. Norway (0.121) 62. Zambia (0.100) 63. Sri Lanka (0.061) 64. Montenegro (0.041) 65. Kuwait (0.029) 66. Niger (0.029) 67. Mexico (0.025) 68. Switzerland (0.021) 69. Lithuania (0.020) 70. Albania (0.010) 71. Senegal (-0.012) 72. Uganda (-0.015) 73. Sweden (-0.025) 74. Australia (-0.026) 75. Hong Kong (-0.040) 76. Slovenia (-0.053) 77. Malaysia (-0.053) 78. Panama (-0.059) 79. Honduras (-0.065) 80. Singapore (-0.068) 81. Belarus (-0.068) 82. Netherlands (-0.081) 83. United Arab Emirates (-0.086) 84. Austria (-0.116)
27 Figure 2.3: Changes in Happiness from 2005-2007 to 2014-2016 (Part 3)
Changes from 2005–2007 to 2014–2016 95% conidence interval
87. Haiti (-0.151) 88. Mozambique (-0.163) 89. Ireland (-0.167) 90. Liberia (-0.169) 91. United Kingdom (-0.172) 92. Costa Rica (-0.178) 93. Finland (-0.203) 94. Armenia (-0.210) 95. Portugal (-0.210) 96. Pakistan (-0.237) 97. Vietnam (-0.285) 98. Namibia (-0.312) 99. South Africa (-0.316) 100. Madagascar (-0.336) 101. Belgium (-0.349) 102. France (-0.372) 103. United States (-0.372) 104. Malawi (-0.391) 105. Denmark (-0.404) 106. Japan (-0.447) 107. Belize (-0.495) 108. Croatia (-0.528) 109. Jordan (-0.605) 110. Cyprus (-0.617) 111. Egypt (-0.624) 112. Iran (-0.629) 113. Spain (-0.669) 114. Rwanda (-0.744) 115. Italy (-0.749) 116. Ghana (-0.757) 117. Tanzania (-0.776) 118. Saudi Arabia (-0.829) 119. India (-0.839) 120. Yemen (-0.884) 121. Jamaica (-0.897) 122. Ukraine (-0.930) 123. Botswana (-0.973) 124. Greece (-1.099)
125. Central African Republic (-1.467) 126. Venezuela (-1.597)
28
Of the 126 countries with data for 2005-2007 and 2014-2016, 95 had signiicant changes, 58 of which were signiicant increases, ranging from 0.12 to 1.36 points on the 0 to 10 scale. There were 38 showing signiicant decreases, ranging from -0.12 to -1.6 points, while the remaining 30 countries revealed no signiicant trend from 2005-2007 to 2014-2016. As shown in Table 34 of the Statistical Appendix, the signiicant gains and losses are very unevenly distributed across the world, and sometimes also within continents. For example, in Western Europe there were 11 signiicant losses but only 1 signiicant gain. In Central and Eastern Europe, by contrast, these results were reversed, with 12 signiicant gains against 1 loss. Two other re-gions had many more signiicant gainers than losers, as measured by country counts. Latin America and the Caribbean had 13 signiicant gainers against 4 losses, and the Common-wealth of Independent States had 8 gains against 2 losses. In all other world regions, the numbers of signiicant gains and losses were much more equally divided.
Among the 20 top gainers, all of which showed average ladder scores increasing by 0.50 or more, eleven are in the Commonwealth of Independent States, Central and Eastern Europe, ive in Latin America, two in sub-Saharan Africa, Thailand and Philippines in Asia. Among the 20 largest losers, all of which showed ladder reduc-tions of 0.5 or more, ive were in the Middle East and North Africa, ive in sub-Saharan Africa, four in Western Europe, three in Latin America and the Caribbean, and one each in South Asia, Central and Eastern Europe, and the Common-wealth of Independent States.
These gains and losses are very large, especially for the 10 most affected gainers and losers. For each of the 10 top gainers, the average life evaluation gains exceeded those that would be expected from a doubling of per capita incomes. For each of the 10 countries with the biggest drops in average life evaluations, the losses were more than would be expected from a halving of
GDP per capita. Thus the changes are far more than would be expected from income losses or gains lowing from macroeconomic changes, even in the wake of an economic crisis as large as that following 2007.
On the gaining side of the ledger, the inclusion of ive transition countries among the top 10 gainers relects the rising average life evalua-tions for the transition countries taken as a group. The appearance of sub-Saharan African countries among the biggest gainers and the big-gest losers relects the variety and volatility of experiences among the sub-Saharan countries for which changes are shown in Figure 2.3, and whose experiences are analyzed in more detail in Chapter 4.
The 10 countries with the largest declines in average life evaluations typically suffered some combination of economic, political, and social stresses. In the World Happiness Report 2016 Update, 3 of the 10 largest losers (Greece, Italy, and Spain) were among the four hard-hit Euro-zone countries whose post-crisis experience was analyzed in detail in World Happiness Report 2013. Of the three, Greece, the hardest hit, is the only one still ranked among the ten largest declines, with a net decline of 1.1, compared to 1.3 previ-ously. The other nine countries come from six of the ten global regions, with separate circum-stances at play in each case.
29
gain, while the actual change was a very small drop. For all other regions, the predicted and actual changes were in the same direction, with the substantial reductions in the United States (the largest country in the NANZ group), West-ern Europe, and the Middle East and North Africa being larger in each case than predicted. The substantial happiness gains in Southeast Asia, East Asia, and Central and Eastern Europe were all predicted to be substantial, while the Latin American gain was not predicted by the equation. As Figure 18 shows, changes in the six factors are only moderately successful in captur-ing the evolvcaptur-ing patterns of life over what have been tumultuous times for many countries. Most of the directions of change were predicted, but generally not the amounts of change.
Social Foundations of Happiness
In this central section of the chapter we exam-ine the social foundations of world happexam-iness. Within the six-factor explanatory framework we have adopted to explain levels and changes of life evaluations, four—social support, freedom to make life choices, generosity, and absence of corruption in government and business—are best seen as representative of different aspects of the social foundations of well-being. The other two—GDP per capita and healthy life expectancy—both long-established as goals for development, are not themselves measures of the quality of a nation’s social foundations, but they are nonetheless strongly affected by the social context. So where do we start in attempt-ing to understand the importance of the social context to the quality of life? After toying with a number of approaches, we come back to the simplest, and organize our discussion under the headings provided by our six explanatory vari-ables, followed by some links to what this method fails to cover.
We start by reviewing some of the linkages between the quality of the social context and real incomes as well as healthy life expectancy. We
then turn to consider the mechanisms whereby the other four variables, themselves more plausibly treated as primary measures of the quality of a society’s social foundations, establish their additional linkages to the quality of life, as revealed by individual life assessments. We then consider how inequality affects the social foun-dations, and vice versa, followed by some links to our earlier analysis of the social foundations of resilience. Finally, we consider new evidence about the social foundations of well-being over the life course, arguing that the age-proiles of happiness in different societies relect the relative quality of the social fabric for people at different ages and stages of life.
Social Foundations of Income
As human lives and technologies have become more complicated and intertwined over the centuries, the beneits of a bedrock of stable social norms and institutions have become increasingly obvious. There have been many strands of opinion and research about which social norms are most favorable for human development. Adam Smith highlighted two of these strands. In the Theory of Moral Sentiments, Smith argued that human beings are inherently sympathetic to the fates of others beyond them-selves, but too imperfect to apply such sympa-thies beyond themselves, their friends and family, and perhaps their countries. The power and responsibility for achieving general happi-ness of the world population lay with God, with individuals and families presumed able to be fully sympathetic only with those close to them-selves. Modern experimental research in psy-chology echoes this view, since the willingness of students to mark in their own favor has been found to be signiicant, but reversed by remind-ers of instructions from a higher power.38
Smith’s idea of a strong but limited sense of sympathy underpinned his later and more inluential arguments in the Wealth of Nations. Therein, he extolled the capacities of impersonal markets to facilitate specialization in production, with trade being used to share efforts and
30
markets were suficiently underpinned by social norms. These norms are needed to enable people to plan in some conidence that others would deliver as promised, as well as to limit the use of coercion. Much subsequent research in economics has tended to follow Smith’s pre-sumption that each individual’s moral sympathy is limited mainly to family and friends, with individual self-interest serving to explain their decisions. Over the past century, there has been increasing realization of the importance of social norms for any joint activity, especially including the production and distribution of goods and services, as measured by GDP. Indeed, research, including that in this chapter, shows that people routinely act more unselishly than Smith presumed39, and are happier when they do so40.
Trust has long been seen as an especially im-portant support for economic eficiency. Trust among participants is an asset vital to dealing with the many contingencies that lie beyond the power of contracts to envisage. It also helps to ensure that contracts themselves will be reli-able.41 Empirical research over the past twenty
years on the social basis of economic eficiency has given trust a central role, seen as an element or consequence of social capital, which the OECD has deined as “networks together with shared norms, values and understandings that facilitate co-operation within or among
groups.”42 Evidence that average levels of
eco-nomic performance and rates of ecoeco-nomic growth have been higher in regions or countries with higher trust levels is accumulating.43 To the
extent that these social norms are present in and protected by public institutions, their capacity to support economic performance is thereby increased.44 There is thus much evidence that
good governance is a key foundation for eco-nomic growth; we shall see later that it has beneits for happiness that extend beyond its support for economic progress.
Social foundations of health
There is a long-standing research literature on the social determinants of health. The primary factors considered to represent social determi-nants are measures of social and economic status, primarily income, education, and job status.45 For all three of these markers, both
within and across societies, those at the top fare better, in terms of both death and illness, than do those at the bottom.46 The channels for these
effects are not yet widely understood, but are thought to include access to health care, better health behaviors, and better nutrition. There has also been some evidence that addressing in-equalities of income and education would not only narrow health inequalities, but also raise average levels at the same time. This literature suggests that at least some of the total inluence of income, and perhaps a larger part of the inluence of education, on well-being lows through its inluence on healthy life expectancy.
Another stream of research has tested and found signiicant links between social trust and health status.47 The case was made that inequalities in
income might have effects on health status through the established linkage between income inequality and social trust.48 Global evidence also
suggests that two key social variables—social support and volunteering—are in most coun-tries consistently associated with better self-re-ported health status.49 Furthermore, the quality
of social institutions also has important direct effects on health, as health outcomes are better where corruption is less and government quality generally higher.50
More generally, there are many studies showing that maintaining or improving the quality of the social context, whether within the operating room51, in post-operative care, among those
recovering from trauma52 or hoping to avoid a
new or recurring disease, or among those in elder care53, is a notable protective and healing
31
delivers better health by reducing the damage to health from stressful events. For example, a prospective study of Swedish men found that prior exposure to stressful events sharply in-creased subsequent mortality among previously healthy men, but that this risk was almost eliminated for those who felt themselves to have high levels of emotional support.54 More direct
beneicial health effects of social integration, without mediation through stressful events, is revealed by a variety of community-level pro-spective studies wherein those with more active social networks had lower subsequent mortality, even after taking into account initial health status and a variety of other protective factors.55
Generosity, which we have found an important source of happiness, also turn out to beneit physical health, with a variety of studies showing that health beneits greater for the givers than for the receivers of peer-to-peer and other forms of support.56
Experimental evidence has shown that those with a broader range of social contacts have signiicantly lower susceptibility to a common cold virus to an extent that relects the range of social roles they play.57 By similar reasoning,
negative social relations can impose a health cost. For example, those with enduring social conlicts were more than twice as likely to develop a cold from an experimentally delivered cold virus.58
The bulk of the evidence on the health-giving powers of social capital relates to the presence or maintenance of pre-existing natural social connections. The evidence from social support interventions for those with serious life-threat-ening illnesses is more mixed, leading some to suggest that improving natural social networks may be more effective than more targeted patient support.59
The direct role of social support
Social support has been shown in the previous section to have strong linkages to happiness through its effects on physical and mental health. This is only part of the story, however. We have already seen in Table 2.1 that having someone to count on has a very large impact on life evaluations even after allowing for the effects lowing through higher incomes and better health. The percentage of the population who report that they have someone to count on in times of trouble ranges from 29% in Dystopia to almost 99% in Iceland. For a country to have 10% more of its population with someone to count on, (not a large change given the range of 70% between the highest and lowest countries) is associated with an increase in average life evaluations of 0.23 points on the 0 to 10 scale. An increase of that size in life evaluations is equivalent to that from a doubling of GDP per capita, or, for the median country, a ranking increase of seven places in Figure 2.2. These effects are above and beyond those that might low through higher incomes or better health. Having just one person to count on is not a very demanding deinition of social support, as revealed by the large number of countries where more than 90% of respondents have someone to count on. We suspect that a more informative measure of social support might show even larger effects, and, of course, there are many other dimensions of the social support available to people in their homes, on the streets, in their workplaces, among their neighbors, and within their social networks. Having someone to count on is of fundamental importance, but having a fuller set of supporting friendships and social contacts must be even better.